Strength of Divergence Across Multiple IndicatorsOverview:
One-stop shop for all your divergence needs, including:
(1) A single metric for divergence strength across multiple indicators.
(2) Labels that make it easy to spot where the truly strong divergence is by showing the overall divergence strength value along with the number of divergent indicators. Hovering over the label shows a breakdown of each divergent indicator and its individual divergence strength value.
(3) Fully customizable, including inputs for pivot lengths, divergence types, and weights for every component of the divergence strength calculation. This allows you to quickly and easily optimize the output for any chart. Don't worry, the default settings will have you covered if you're not interested in what's going on under the hood.
The Divergence Strength Calculation:
The total divergence strength value is the sum of the divergence strengths of all indicators for which divergence was detected at a given bar. Each indicator's individual divergence strength is comprised of two basic components: (1) |ΔPrice| - the magnitude of the change in price over the divergence period (pivot-to-pivot), and (2) |ΔIndicator| - the magnitude of the change in indicator value over the divergence period.
Because different indicators' scales and volatility can vary greatly, the Δ values are expressed in terms of standard deviation to ensure that the values are meaningful and equitable across all indicators and assets/instruments/currency pairs, etc:
|ΔIndicator| = |indicator_value_1 - indicator_value_2| / 2 * StDev(indicator_series,100)
Calculation Weights:
All components of the calculation are weighted and can be modified on the Inputs page in settings (weights are simply multipliers). For example, if you think hidden divergence should carry less weight than regular divergence, you can assign it a lesser weight. Or if you think RSI divergence is worth more than OBV divergence, you can adjust their weights accordingly. List of weights:
Regular divergence weight - default = 1
Hidden divergence weight - default = 1
ΔPrice weight - default = 0.5 (multiplied by the ΔPrice component)
ΔIndicator weight - default = 1.5 (multiplied by the ΔIndicator component)
RSI weight - default = 1.1
OBV weight - default = 0.8
MACD weight - default = 0.9
STOCH weight - default = 0.9
Development for additional indicators is ongoing, as is research into the optimal weight configuration(s).
Other Inputs:
Pivot lengths - specify the number of bars before and after each pivot high/low to consider it a valid candidate for divergence.
Lookback bars and Lookback pivots - specify the number of bars or the number of pivots to look back across.
Price sources - specify separate price sources for bullish and bearish divergence
Display settings - specify how lines and labels should display, including which divergence strength values should show the largest labels. Include/exclude specific divergence types and indicators.
Please report any bugs, or let me know if you have any enhancement suggestions or requests for additional indicators.
@reees
Cerca negli script per "Divergence"

Volume Price Trend with Divergence and Pivot Points The volume price trend indicator is used to determine the balance between a security’s demand and supply. The percentage change in the share price trend shows the relative supply or demand of a particular security, while volume indicates the force behind the trend. The VPT indicator is similar to the on-balance volume (OBV) indicator in that it measures cumulative volume and provides traders with information about a security’s money flow.
This is Volume Price Trend or VPT recalculated to be an Oscillator, a Divergence hunter was added, also Pivot Points and Alerts.
VPT is considered a "leading indicator" - in contrast to a "lagging indicator" just as Moving Averages it does not show a confirmation what already happened, but it shows what can happen in the future. For example: The chart is climbing while the VPT oscillator is slowly declining, gets weaker and weaker, maybe even prints bearish divergences? That means that a reversal might be occurring soon. Leading indicators are best paired with Stop and Resistance Lines, general Trendlines , Fib Retracements etc...Your chart is approaching a very important Resistance Trendline but the VPT shows a very positive signal? That means there is a high probability that the Resistance is going to be pushed though and becomes Support in the future.
What are those circles?
-These are Divergences. Red for Regular-Bearish. Orange for Hidden-Bearish. Green for Regular-Bullish. Aqua for Hidden-Bullish.
What are those triangles?
- These are Pivots . They show when the VPT oscillator might reverse, this is important to know because many times the price action follows this move.
Please keep in mind that this indicator is a tool and not a strategy, do not blindly trade signals, do your own research first! Use this indicator in conjunction with other indicators to get multiple confirmations.

On-Balance Volume Oscillator with Divergence and PivotsThis is On-Balance Volume recalculated to be an Oscillator, a Divergence hunter was added, also Pivot Points and Alerts.
On-Balance Volume, or OBV is considered a "leading indicator" - in contrast to a "lagging indicator" just as Moving Averages it does not show a confirmation what already happened, but it shows what can happen in the future. For example: The chart is climbing while the OBV oscillator is slowly declining, gets weaker and weaker, maybe even prints bearish divergences? That means that a reversal might be occurring soon. Leading indicators are best paired with Stop and Resistance Lines, general Trendlines, Fib Retracements etc...Your chart is approaching a very important Resistance Trendline but the OBV shows a very positive signal? That means there is a high probability that the Resistance is going to be pushed though and becomes Support in the future.
What are those circles?
-These are Divergences. Red for Regular-Bearish. Orange for Hidden-Bearish. Green for Regular-Bullish. Aqua for Hidden-Bullish.
What are those triangles?
- These are Pivots. They show when the OBV oscillator might reverse, this is important to know because many times the price action follows this move.
Please keep in mind that this indicator is a tool and not a strategy, do not blindly trade signals, do your own research first! Use this indicator in conjunction with other indicators to get multiple confirmations.

RSI + DivergencesHi Guys,
This indicator gives you the trend changes (Designed with the basics of Vash's RSI advanced and the Fikira divergence indicator)
This indicator will only give you regular divergences.
Please keep in mind that a trading plan is not only built with momentum but also with location and structure.
Good trading,

OBV Divergence Indicator [TradingFinder] On-Balance Vol Reversal🔵 Introduction
The On-Balance Volume (OBV) indicator, introduced by Joe Granville in 1963, is a powerful technical analysis tool used to measure buying and selling pressure based on trading volume and price.
By aggregating trading volume—adding it on positive days and subtracting it on negative days—OBV creates a cumulative line that reflects market volume pressure, making it valuable for confirming trends, identifying entry and exit points, and forecasting potential price movements.
Divergences between price and OBV often provide significant signals. A bearish divergence occurs when the price forms higher highs while the OBV line forms lower highs. This discrepancy indicates that upward momentum is weakening, increasing the likelihood of a downward trend.
In contrast, a bullish divergence happens when the price makes lower lows, but the OBV line forms higher lows. This suggests increasing buying pressure and the potential for an upward trend reversal.
For instance, if the price is rising but the OBV trendline is falling, it may signal a bearish divergence, warning of a possible price decline. Conversely, if the price is falling while the OBV line is rising, this could signal a bullish divergence, indicating a possible price recovery. These signals are particularly useful for identifying market turning points.
OBV often acts as a leading indicator, moving ahead of price changes. For example, a rising OBV alongside stable or declining prices can signal an impending upward breakout.
Conversely, a declining OBV with rising prices may indicate that the current uptrend is losing strength. Traders using this strategy often consider entering positions at breakout levels while setting stop losses near recent swing highs or lows to manage risk effectively.
This integration highlights how OBV divergences can provide actionable insights for predicting price movements and managing trades efficiently.
Bullish Divergence :
Bearish Divergence :
🔵 How to Use
The OBV indicator, as a cumulative tool, assists analysts in comparing volume and price changes to identify new trends and key levels for entering or exiting trades. Beyond confirming existing trends, it is particularly effective in analyzing positive and negative divergences between price and volume, providing valuable signals for trading decisions.
🟣 Bullish Divergence
A bullish divergence occurs when the price continues its downward or stable trend, but the OBV line starts rising, forming a higher low compared to its previous low. This suggests increasing volume on up days relative to down days and often signals a reversal to the upside.
For instance, if an asset's price stabilizes near a support level but the OBV line shows an upward trend, this divergence could present an opportunity to enter a long position.
🟣 Bearish Divergence
A bearish divergence occurs when the price forms higher highs, but the OBV line declines, creating lower highs compared to previous peaks. This indicates decreasing volume on up days relative to down days and often acts as a warning for a reversal to the downside.
For example, if an asset’s price approaches a resistance level while OBV starts declining, this divergence may signal the beginning of a downtrend and could indicate a good time to exit long trades or enter short positions.
🔵 Setting
Period : The "Period" setting allows you to define the number of bars or intervals for "Periodic" and "EMA" modes. A shorter period captures more short-term movements, while a longer period smooths out the fluctuations and provides a broader view of market trends.
You can enable or disable labels to highlight key levels or divergences and tables to show numerical details like values and divergence types. These options allow for a customized chart display.
🔵 Table
The following table breaks down the main features of the oscillator. It covers four critical categories: Exist, Consecutive, Divergence Quality, and Change Phase Indicator.
Exist : If divergence is detected, a "+" will appear in this row.
Consecutive: Shows the number of consecutive divergences that have formed in a short period.
Divergence Quality : Evaluates the quality of the divergence based on the number of occurrences. One is labeled "Normal," two are "Good," and three or more are considered "Strong."
Change Phase Indicator : If a phase change is detected between two oscillation peaks, this is marked in the table.
🔵 Conclusion
The OBV (On Balance Volume) indicator is a simple yet effective tool in technical analysis that combines volume and price changes to provide a comprehensive view of market buying and selling pressure. By identifying positive and negative divergences, OBV enables analysts to detect early signs of trend reversals and refine their trading strategies.
Divergences in OBV often precede price changes, making it a leading indicator for predicting market movements. Using OBV alongside other technical tools can enhance decision-making accuracy and help traders identify better entry and exit points. However, it is essential to consider the limitations of OBV, such as the potential for signal errors and the impact of sudden news events.
Ultimately, OBV serves as a complementary tool in technical analysis, aiding in trend identification, signal confirmation, and risk management. A thoughtful application of this indicator, in combination with other analytical tools, can create valuable opportunities for profiting in financial markets.

TSI in Dynamic Zones with Divergence and Pivot PointsTrue Strength Index , or TSI is considered a "leading indicator" - in contrast to a "lagging indicator" just as Moving Averages it does not show a confirmation what already happened, but it shows what can happen in the future. For example: The chart is climbing while the TSI oscillator is slowly declining, gets weaker and weaker, maybe even prints bearish divergences? That means that a reversal might be occurring soon. Leading indicators are best paired with Stop and Resistance Lines, General Trendlines , Fib Retracements etc. Your chart is approaching a very important Resistance Trendline but the TSI shows a very positive signal? That means there is a high probability that the Resistance is going to be pushed through and becomes Support in the future.
What are those circles?
-These are Divergences. Red for Regular-Bearish. Orange for Hidden-Bearish. Green for Regular-Bullish. Aqua for Hidden-Bullish.
What are those triangles?
- These are Pivots . They show when the TSI oscillator might reverse, this is important to know because many times the price action follows this move.
What are these blue or orange areas?
- Those are dynamic zones. For the analysis of the TSI its important to know if the indicator is in a state of oversold or overbought to filter out ranging price movement. Normally those zones are static, in this version of the TSI oscillator dynamic zones were added to show a dynamic calculation whether the TSI oscillator is oversold, overbought or ranging.
Please keep in mind that this indicator is a tool and not a strategy, do not blindly trade signals, do your own research first! Use this indicator in conjunction with other indicators to get multiple confirmations.

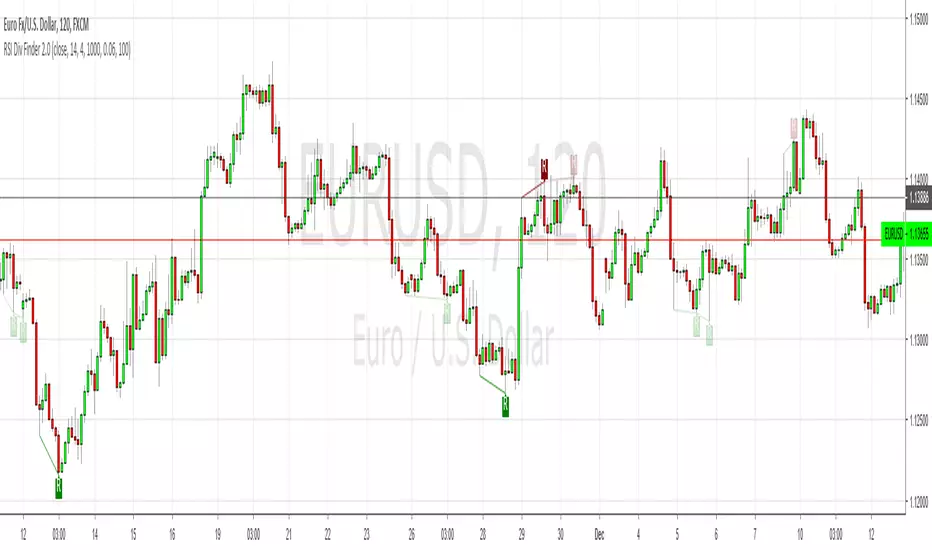
Filtered RSI Divergence Finder Check the settings to see how the filters work. I added alerts and a feature that shows the divergences that have been filtered, but as faded "ghost" divergences. Spooooky. This is useful for tuning the script to a particular market. All credit to RicardoSantos for the original.
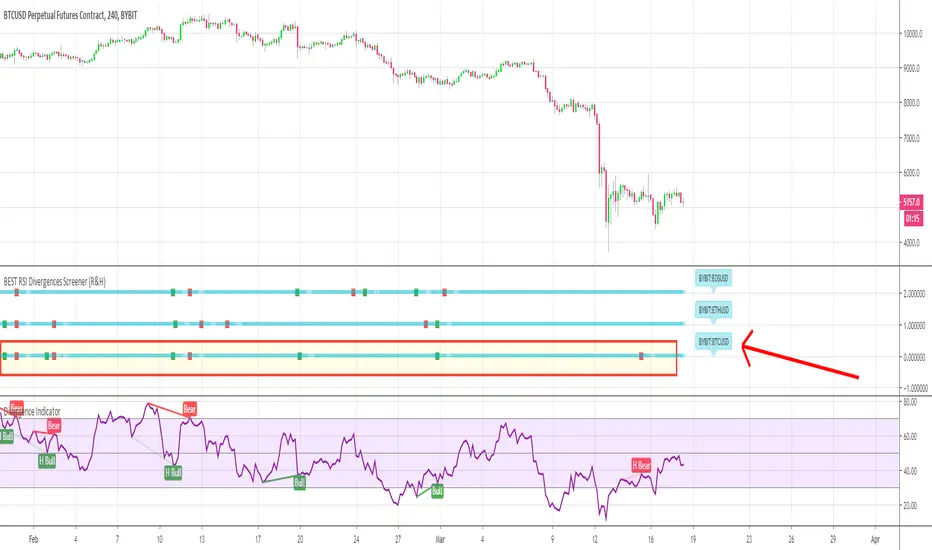
BEST RSI Divergences Screener (Regular and Hidden)Hello traders
My way to fight this situation is to stay productive.
Hope some of my scripts will help you out as most of us are locked-down at home, hence have more time for trading - and preparing ourselves when the sun will shine on us again
I - Concept
This is an upgrade of this script which captured only the regular divergences
This screener detects whether the regular RSI divergences based on the TradingView Divergence built-in indicator (made by the gentleman @everget I believe)
With this screener, you can see in 1 view which of your favorite cryptos/stocks/forex pairs/etc. showing strong regular and hidden divergences
The gentlemen (and demoiselles) traders can play with the lookback/ranges inputs to adjust the divergences based on what they think is best of their trading/timeframe/instrument/life
On that script screenshot, I'm showing the BYBIT:BTCUSD part of the screener matching with the divergences on the chart
II - How did I set the screener
The visual signals are as follow:
- square: whenever a regular or hidden divergence is detected
Then the colors are:
- green when there is bullish divergence
- red when there is bearish divergence
🔔🔔 I also added the alerts for capturing those bullish/bearish divergences
III - Does it repaint?
It should not :)
Best regards
Dave
MG - Real time RSI divergenceShows RSI divergences in real time (as soon as bar closes in divergence instead of waiting for an RSI pivot).
There are alerts included on these events so you are immediately made aware of divergence.
Adjustement:
It works by detecting a break of a previous high or low and then comparing the RSI value at the last break to the current break. Therefore, by decreasing the adjacent candles required for a pivot, you increase the number of divergence checks and therefore divergence readings. As with many indicators, with higher the values, you get less but more significant signals. (This can be visualized with the plot pivot lines option)
RSI period can be adjusted

Gradient Money Flow Divergence DetectorThe "Gradient Money Flow Divergence Detector" indicator has several use cases for traders. Let's explore the main use cases:
1. Money Flow Analysis : The primary purpose of this indicator is to analyze money flow in a particular asset. The Money Flow Index (MFI) is a momentum indicator that uses price and volume data to assess the buying and selling pressure in a market. Traders can use the MFI to identify overbought and oversold conditions, potential trend reversals, and divergences between the MFI and price movement.
2. Divergence Detection : The indicator incorporates a divergence detection mechanism for multiple timeframes (micro, sub-mid, mid, and macro). Divergence occurs when the price movement and an indicator (MFI in this case) move in opposite directions, signaling a potential shift in the price trend. Traders can use divergences to anticipate trend reversals or trend continuation.
3. Multiple Lookback Analysis : The indicator allows traders to assess divergences and money flow trends across various time horizons by providing divergence detection for different lengths. This can help traders identify confluence areas where divergences align on multiple timeframes, strengthening the potential signal.
4. Overbought and Oversold Conditions : The indicator plots horizontal lines at MFI levels of 20, 50, and 80. These levels can be used to identify overbought (MFI above 80) and oversold (MFI below 20) conditions. Traders may look for potential reversal signals when the MFI reaches extreme levels.
5. Confirmation of Price Trends : The indicator's color gradient visually represents the MFI value, which can help traders confirm the strength of a prevailing price trend. For example, an uptrend with a consistently high MFI might suggest strong buying pressure, reinforcing the bullish bias.
6. Fine-Tuning Divergence Signals : Traders can adjust the parameters of divergence detection (e.g., pivot points, rangeUpper, rangeLower) to fine-tune the sensitivity of the divergence signals. This allows for greater customization based on individual trading preferences.
7. Combining with Other Indicators : The indicator can be used in combination with other technical indicators or price action analysis to strengthen trading decisions. For example, traders may look for divergences in conjunction with support and resistance levels or chart patterns to increase the probability of successful trades.
8. Trend Reversal Confirmation : When a divergence is detected, it may indicate a potential trend reversal. Traders can use other confirmation signals (e.g., candlestick patterns, trendline breaks) to validate the reversal before making trading decisions.
Remember that no single indicator should be used in isolation, and it's essential to use the indicator in combination with other confirmations such as support and resistance, and analysis methods for more robust trading strategies. Additionally, thorough backtesting and practice in a demo environment are recommended before using the indicator in live trading.

RSI Divergence Screener by zdmreThis screener tracks the following for up to 20 assets:
-All selected tickers will be screened in same timeframes (as in the chart).
-Values in table indicate that how many days passed after the last Bullish or Bearish of RSI Divergence.
For example, when BTCUSDT appears Bullish-Days Ago (15) , Bitcoin has switched to a Bullish Divergence signal 15 days ago.
Thanks to @QuantNomad and @MUQWISHI for building the base for this screener.
*Use it at your own risk
Note:
Screener shows the information about the RSI Divergence Scanner by zdmre with default settings.
Based indicator:

Triangular Momentum Oscillator & Real Time Divergences [LuxAlgo]Oscillators are widely used in technical analysis and can return a large amount of information to the trader depending on their design. It is common to use oscillators to detect divergences with the price, divergences occur when the tops/bottoms made by the oscillator and price are negatively correlated.
The following oscillator is based on the momentum of a triangular moving average, hence the name "triangular momentum" because of the very smooth property of the triangular moving average, we aimed at a real-time detection of divergences instead of using more common methods such as relying on pivot high/low detection which are suitable for more noisy oscillators.
The oscillator can also be colored based on a gradient derived from the correlation between its output and the price which can be useful to detect when the oscillator is out of phase (significantly lagging or leading the price).
Settings
length : Period of the oscillator, higher values return a smoother output.
src : Input source of the indicator.
Show Lines : Show lines connecting the current top/bottom with the previous one made by the oscillator when a divergence is detected. True by default.
Color Based On Price/Oscillator Correlation : Allows the color of the oscillator to change based on its correlation with the price, with red colors suggesting a negative correlation.
Usages
The advantage of having a smoother oscillator for divergences detection is that it can be done in real-time since a top or bottom is present when the oscillator first difference cross 0. Smoother oscillators are also easier to interpret, however, they will still suffer from lag.
The divergences detected by the oscillator are regular divergences, where the oscillator leads price variations.
Using higher values of length allows the oscillator to filter out longer-term variations thus being smoother as a result.
By using the color mode based on the price/oscillator correlation we can see where the oscillator leads or lag the price, and since divergences are based on the price and oscillator going in the opposite direction we can have information where price might reverse.
It is also possible to interpret the oscillator without relying on the divergence detection, with a decreasing value of the oscillator indicating a downtrend and an increasing value indicating an uptrend.
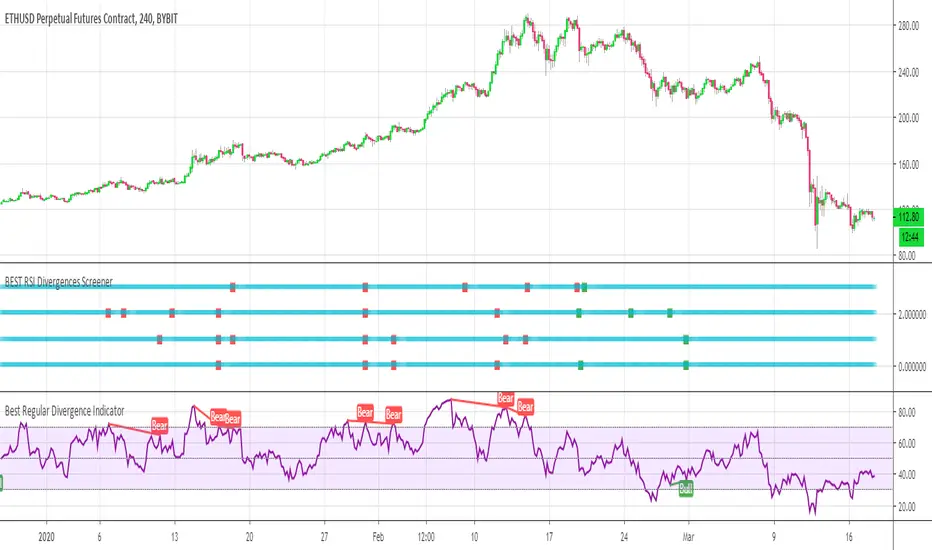
BEST RSI Divergences ScreenerHello traders
I hope you're all hanging on at home with what's going on these days...
The good news is.... it gives us more time to trade ^^.... #positive #attitude
I - Concept
This screener detects whether the regular RSI divergences based on the TradingView Divergence built-in indicator (made by the gentleman @everget I believe)
With this screener, you can see in 1 view which of your favorite cryptos/stocks/forex pairs/etc. showing strong divergences
The gentlemen (and demoiselles) traders can play with the lookback/ranges inputs to adjust the divergences based on what they think is best of their trading/timeframe/instrument/life
On that script screenshot, I'm showing the BYBIT:BTCUSD part of the screener matching with the divergences on the chart
II - How did I set the screener
The visual signals are as follow:
- square: whenever a divergence is detected
Then the colors are:
- green when there is bullish regular divergence
- red when there is bearish regular divergence
Best regards
Dave
SMT Oscillator: Smarter Money Divergence Detector [PhenLabs]📊Phenlabs - SMT Oscillator: Smarter Money Divergence Detector
Version: PineScript™v6
📌Description
The SMT Oscillator is a sophisticated tool designed to identify smart money divergence between two correlated assets. By analyzing the momentum and volume-weighted price action of a primary and secondary symbol, traders can spot subtle shifts in market dynamics that often precede significant price movements. This indicator is built to provide a clearer, more filtered view of inter-market relationships, solving the common problem of false signals and market noise. Its primary purpose is to equip traders with a quantifiable edge in detecting potential reversals or continuations that are not obvious on a standard price chart.
🚀Points of Innovation
Dual-Symbol Divergence Core: Directly compares momentum (RSI or MACD) between two user-selected symbols to pinpoint true SMT divergence.
Volume-Weighted Analysis: Integrates volume delta into the divergence calculation, giving more weight to moves backed by significant market participation.
Entropy Filter for Noise Reduction: Employs an entropy calculation to filter out low-quality signals during choppy or consolidating market conditions.
Predictive Forecast Line: Utilizes a linear regression model to project the oscillator’s future trajectory, offering a forward-looking glimpse of potential momentum shifts.
Customizable Signal Sensitivity: Allows fine-tuning of overbought and oversold levels to adapt to different market volatilities and trading styles.
Integrated Signal Alerts: Provides built-in alerts for bullish/bearish zero crosses and overbought/oversold conditions.
🔧Core Components
Momentum Engine: The user can select either RSI or MACD as the underlying engine for the divergence calculation, allowing for flexibility in analysis.
Normalization Function: Price data from both symbols is normalized using percentage change to ensure a true “apples-to-apples” comparison, regardless of their nominal price differences.
Divergence Calculator: The core algorithm that subtracts the secondary symbol’s momentum from the primary’s and normalizes the result using the combined standard deviation.
Smoothing Mechanism: An Exponential Moving Average (EMA) is applied to the raw oscillator output to reduce choppiness and provide a clearer signal line.
🔥Key Features
Multi-Asset Comparison: Go beyond single-asset analysis by comparing correlated pairs like ES/NQ or BTC/ETH to uncover hidden trading opportunities.
Heatmap Visualization: An optional heatmap mode provides an intuitive visual representation of divergence strength, making it easier to gauge market sentiment at a glance.
Configurable Lookback and Timeframe: Adjust the lookback period and analysis timeframe to suit your specific strategy, from short-term scalping to long-term trend analysis.
Signal Markers: Visual markers are plotted directly on the chart for bullish and bearish zero-line crossovers, providing clear entry and exit signals.
🎨Visualization
SMT Oscillator Line: The primary visual element, colored blue for bullish (positive) divergence and orange for bearish (negative) divergence.
Zero Line: A solid horizontal line at the zero level, indicating the equilibrium point between the two assets. Crossovers of this line signal a shift in relative strength.
Overbought/Oversold Zones: Dotted lines at the +80 and -80 levels (customizable) that highlight extreme divergence readings, often indicating potential exhaustion points.
Forecast Line: A predictive line that plots the anticipated path of the oscillator, giving traders an advanced warning of potential changes in momentum.
📖Usage Guidelines
Setting Categories
Primary Symbol
Default: (Chart Symbol)
Description: The main asset you are analyzing. Leave blank to use the symbol currently on your chart.
Secondary Symbol
Default: CME_MINI:ES1! (used with NASDAQ futures due to inherent heavy correlation
Description: The asset to compare against the primary symbol.
Lookback Period
Default: 14
Range: 8-100
Description: Controls the calculation window for momentum (RSI/MACD). Higher values result in a smoother, less sensitive oscillator.
Divergence Type
Default: RSI
Options: RSI, MACD
Description: Choose the momentum indicator to use for the divergence calculation.
Enable Volume Weighting
Default: true
Description: When enabled, gives more weight to divergence signals that are accompanied by significant volume.
✅Best Use Cases
Identifying high-probability reversal points by spotting divergence in overbought or oversold territory.
Confirming the strength of a trend by observing sustained positive or negative divergence.
Pairs trading by taking a long position on the outperforming asset and a short position on the underperforming one during a divergence.
Risk management by recognizing when a current trend is losing its underlying momentum.
⚠️Limitations
Requires Correlated Assets: The indicator’s effectiveness is highly dependent on the selection of two assets with a known correlation (e.g., ES and NQ).
Not a Standalone System: Divergence signals should be used in conjunction with other forms of analysis (price action, market structure) and not as a complete trading system.
Lagging by Nature: As it is based on moving averages and past price data, the oscillator is inherently lagging and may not capture all rapid price changes.
💡What Makes This Unique
Combined Momentum & Volume: Unlike standard oscillators, it fuses momentum with volume delta for a more robust “Smart Money” perspective.
Noise-Filtering Mechanism: The proprietary entropy filter is a unique feature designed to weed out insignificant market chatter and focus on high-conviction signals.
🔬How It Works
Data Normalization:
The script first normalizes the price data of the two selected symbols into percentage changes. This ensures that the comparison is fair, regardless of the difference in their price scales.
Momentum Calculation:
It then calculates the chosen momentum value (either RSI or MACD histogram) for each of the normalized price series.
Divergence Computation:
The core of the indicator lies in subtracting the momentum of the secondary symbol from the primary one. This raw divergence is then optionally weighted by volume and filtered for market noise (entropy) to produce the final oscillator value.
💡Note:
For best results, use this indicator on adequate timeframes to filter out market noise. Always confirm signals with price action analysis before entering a trade.

SMT DivergenceSMT Divergence Indicator
This powerful indicator identifies high-probability reversal points by detecting SMT (Smart Money Technique) divergences between two correlated assets. It spots subtle shifts in market momentum, revealing when one asset fails to confirm the price action of another—often signaling an impending trend change.
Key Features:
Inter-Market Divergence Detection: Automatically compares the price action of the main symbol with a second user-defined asset.
Identifies Key Reversals: Pinpoints both bullish and bearish SMT divergences, highlighting hidden strength in downtrends and underlying weakness in uptrends.
Customizable Pivot Detection: Allows fine-tuning of the pivot length to adjust sensitivity for different market conditions and timeframes.
Flexible Display Modes: Choose between clean 'Lines' connecting the diverging pivots or precise 'Labels' marking the exact high/low points.
Full Visual Customization: Complete control over the colors and line thickness for seamless integration with your existing chart layout.
Built-in Alerts: Stay notified of every potential opportunity with alerts for both bullish and bearish signals.
Settings:
Core Parameters:
Comparison Symbol: Select the second asset to compare against for divergence analysis (e.g., NQ1! if you are charting ES1!).
Pivot Length: Defines the number of bars to the left and right required to confirm a pivot high or low.
Visual Settings:
Display Style: Choose to visualize divergences as 'Lines' or 'Labels'.
Bearish/Bullish Color: Set custom colors for bearish and bullish divergence indicators.
Line Width: Adjust the thickness of the divergence lines for optimal visibility.
Perfect for traders who utilize inter-market analysis to confirm trade ideas. The SMT Divergence indicator provides a crucial edge by exposing non-confirmations between related assets, allowing for earlier and more confident entries into potential market reversals.

MACD 4C with DivergenceMACD 4C Indicator with Divergence
This indicator, named MACD 4C, enhances the traditional MACD (Moving Average Convergence Divergence) by providing a visually intuitive representation with four distinct colors for the histogram bars. It offers a clear interpretation of market momentum and potential trend reversals.
Key Features:
Customizable Parameters: Users can adjust the fast and slow moving average periods along with the signal smoothing parameter to tailor the indicator to their preferred trading style and market conditions.
Four-color Histogram: The histogram bars are color-coded for easy interpretation. Lime and green bars indicate increasing bullish momentum, while maroon and red bars signify increasing bearish momentum.
Bullish and Bearish Divergence Detection: The indicator identifies bullish and bearish divergences between the MACD histogram and price action. Bullish divergence occurs when the price makes a lower low while the MACD histogram forms a higher low, indicating potential bullish reversal. Conversely, bearish divergence occurs when the price makes a higher high while the MACD histogram forms a lower high, suggesting a potential bearish reversal.
How to Use:
Trend Confirmation: Monitor the color of the histogram bars. A series of green (or lime) bars suggests a strengthening bullish trend, while a series of red (or maroon) bars indicates a strengthening bearish trend.
Divergence Identification: Watch for divergences between the MACD histogram and price action. Bullish divergence may signal a potential bullish reversal, while bearish divergence may indicate a potential bearish reversal. These signals can be used in conjunction with other technical analysis tools to confirm trade entries and exits.
The MACD 4C indicator was developed by user vkno422 You can find the original author and their work on their TradingView profile: www.tradingview.com

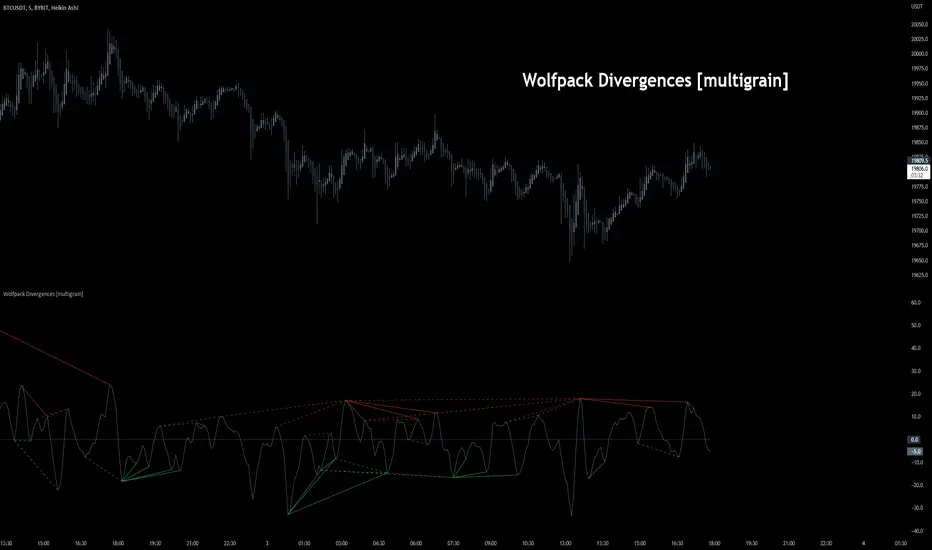
Wolfpack Divergences [multigrain]█ OVERVIEW
A fast and improved divergence finding algorithm that aims to be better than the built-in TradingView divergence algorithm.
█ CONCEPTS
Wolfpack
Wolfpack is an oscillator made popular by darrellfischer1 all the way back in 2017. Since then the Wolfpack oscillator has been utilized by a number of notable strategy/indicator creators. At some point it was realized that the oscillator was simply the Moving Average Crossover Divergence oscillator with the fast and slow length of 3 and 8, respectively. The true significance and reasoning behind these lengths are unknown, however one may surmise that they are chosen due to their relevance as Fibonacci numbers.
Divergences
Divergence is when the price of an asset is moving in the opposite direction of a technical indicator, such as an oscillator, or is moving contrary to other data. Divergence warns that the current price trend may be weakening, and in some cases may lead to the price changing direction.
█ USAGE
Wolfpack
Similar to many other oscillators, when the Wolfpack oscillator reports a value above the zero-line, this indicates a bullish trend in the price. Subsequently, a value below the zero-line indicate a bearish trend in the price.
Divergences
Divergence in technical analysis may signal a major positive or negative price move. A positive divergence occurs when the price of an asset makes a new low while an indicator, such as money flow, starts to climb. Conversely, a negative divergence is when the price makes a new high but the indicator being analyzed makes a lower high.
VWMA/SMA Breakout and Divergence DetectorThis indicator compares four different values :
-Fast Simple Moving Average(SMA)
-Fast Volume Weighted Moving Average(VWMA)
-Slow SMA
-Slow VWMA
Comparing SMA's and VWMA's of the same length is a common trading tactic. Since volume is not taken into consideration when calculating Simple Moving Averages, we can gain valuable insights from the difference between the two lines.
Since volume should be increasing along with an upwards price movement, the VWMA should be greater than the SMA during a volume-supported uptrend. Thus, we can confirm an uptrend if the VWMA remains greater than the SMA. If the VWMA falls under the SMA in the midst of an upwards price movement, however, that indicates bearish divergence. The opposite is true for downtrends. If price is decreasing and volume is decreasing at the same time (as it should), then we can confirm the downtrend.
Interpreting the Graph:
If the slow SMA is greater than the slow VWMA, then the area representing the difference between the two lines is filled in red. If the slow VWMA is greater than the slow SMA, however, the area between the two is filled green.
If the fast SMA is greater than the fast VWMA, then the area between the two dotted lines is filled in red. On the other hand, the area will be filled green if the fast VWMA is greater than the slow SMA.
In addition to spotting divergences and confirming trends, the four lines can be used to spot breakouts. Typically, a VWMA crossover will precede the SMA crossover. When the fast VWMA crosses over the slow VWMA and then a SMA crossover follows shortly after, then it is a hint that a bullish trend is beginning to form.

Bats Bearish Divergence Detector (BRED-)After the release of BUBD+ here comes BRED- for calling the tops.
6 indicators are tested for the presence of any bearish Divergences and are plotted on chart as soon as they are.
Note - Price can move up after bearish divergence as well so its not foolproof. However multiple bearish divergences signify that bulls are losing power and price might reverse downwards.
Instead of blindly trusting the divergence on this indicator I suggest that you use this as a tracking mechanism instead. Once you spot a bearish divergence here, go to the oscillator that was called by the indicator and see the strength of the divergence involved.
This way you dont have to look at the indicators for divergence all the time, just only when the indicator calls for it. (Note that different timeframes will have different divergences so make sure you watch most of them. Higher timeframes indicate larger potential reversals)
Colour -
MACD- Aqua blue
RSI - Red
Stoch RSI - pink
CCI - Orange
MFI - Teal (Blue)
RVI - Silver
If you want to change the number of indicators you can do so from the bottom and remove the indicators you dont want to see by commenting them out.

Bullish Divergence Short-term Long Trade FinderThis script is a Bullish divergence trade finder built to find small periods where Bitcoin will likely rise from. It looks for bullish divergence followed by a higher low as long as the hour RSI value is below the 40 mark, if then it will enter an long. It marks out Buy signals on the RSI if the value dips below 'RSI Bull Condition Minimum' (Default 40) on the current time frame in view. It also marks out Sell signals found when the RSI is above the 'RSI Bearish Condition Minimum' (Default 50). The sell signals are bearish divergence that has occurred recently on the RSI. When a long is in play it will sell if it finds bearish divergence or the time frame in view reaches RSI value higher than the 'RSI Sell Value'(Default 75). You can set your stop loss value with the 'Stop loss Percentage' (default 5).
Available inputs:
RSI Period: relative strength measurement length(Typically 14)
RSI Oversold Level: the bottom bar of the RSI (Typically 30)
RSI Overbought Level: the top bar of the RSI (Typically 70)
RSI Bearish Condition Minimum: The minimum value the script will use to look for a pivot high that starts the Bearish condition to Sell (Default 50)
RSI Bearish Condition Sell Min: the minimum value the script will accept a bearish condition (Default 60)
RSI Bull Condition Minimum: the minimum value it will consider a pivot low value in the RSI to find a divergence buy (Default 40)
Look Back this many candles: the amount of candles thee script will look back to find a low value in the RSI (Default 25)
RSI Sell Value: The RSI value of the exit condition for a long when value is reached (Default 75)
Stop loss Percentage: Percentage value for amount to lose (Default 5)
The formula to enter a long is stated below:
If price finds a lower low and there is a higher low found following a lower low and price has just made another dip and price closes lower than the last divergence and Relative strength index hour value is less than 40 enter a long.
The formula to exit a long is stated below:
If the value drops below the stop loss percentage OR (the RSI value is greater than the value of the parameter 'RSI Sell Value' or bearish divergence is found greater than the parameter 'RSI Bearish Condition Minimum' )
This script was built from much strategy testing on BTC but works with alts (occasionally) also. It is most successful to my knowledge using the 15 min and 7 min time frames with default values. Hope it helps! Follow for further possible updates to this script or other entry or exit strategies.
snapshot:
I only have a Pro trading view account so I cannot share a larger data set about this script because the buy signals happen pretty rarely. The most amount that I could find within a view for me was 40 trades within a viewable time. The suggested/default parameters that I have do not occur very often so it limits the data set. Adjustments can be made to the parameters so that trades can be entered more often. The scripts success is dependent on the values of the parameters set by the user. This script was written to be used for BTC/USD or BTC/USDT trading. I am unable to share a larger dataset without putting out results that are intended to fail or having a premium account so reaching the 100 trade minimum is not possible with my account.

Smarter Money Flow Divergence Detector [PhenLabs]📊 Smarter Money Flow Divergence Detector
Version: PineScript™ v6
📌 Description
SMFD was developed to help give you guys a better ability to “read” what is going on behind the scenes without directly having access to that level of data. SMFD is an enhanced divergence detection indicator that identifies money flow patterns from advanced volume analysis and price action correspondence. The detection portion of this indicator combines intelligent money flow calculations with multi timeframe volume analysis to help you see hidden accumulation and distribution phases before major price movements occur.
The indicator measures institutional trading activity by looking at volume surges, price volume dynamics, and the factors of momentum to construct an overall picture of market sentiment. It’s built to assist traders in identifying high probability entries by identifying if smart money is positioning against price action.
🚀 Points of Innovation
● Advanced Smart Money Flow algorithm with volume spike detection and large trade weighting
● Multi timeframe volume analysis for enhanced institutional activity detection
● Dynamic overbought/oversold zones that adapt to current market conditions
● Enhanced divergence detection with pivot confirmation and strength validation
● Color themes with customizable visual styling options
● Real time institutional bias tracking through accumulation/distribution analysis
🔧 Core Components
● Smart Money Flow Calculation: Combines price momentum, volume expansion, and VWAP analysis
● Institutional Bias Oscillator: Tracks accumulation/distribution patterns with volume pressure analysis
● Enhanced Divergence Engine: Detects bullish/bearish divergences with multiple confirmation factors
● Dynamic Zone Detection: Automatically adjusts overbought/oversold levels based on market volatility
● Volume Pressure Analysis: Measures buying vs selling pressure over configurable periods
● Multi factor Signal System: Generates entries with trend alignment and strength validation
🔥 Key Features
● Smart Money Flow Period: Configurable calculation period for institutional activity detection
● Volume Spike Threshold: Adjustable multiplier for detecting unusual institutional volume
● Large Trade Weight: Emphasis factor for high volume periods in flow calculations
● Pivot Detection: Customizable lookback period for accurate divergence identification
● Signal Sensitivity: Three tier system (Conservative/Medium/Aggressive) for signal generation
● Themes: Four color schemes optimized for different chart backgrounds
🎨 Visualization
● Main Oscillator: Line, Area, or Histogram display styles with dynamic color coding
● Institutional Bias Line: Real time tracking of accumulation/distribution phases
● Dynamic Zones: Adaptive overbought/oversold boundaries with gradient fills
● Divergence Lines: Automatic drawing of bullish/bearish divergence connections
● Entry Signals: Clear BUY/SELL labels with signal strength indicators
● Information Panel: Real time statistics and status updates in customizable positions
📖 Usage Guidelines
Algorithm Settings
● Smart Money Flow Period
○ Default: 20
○ Range: 5-100
○ Description: Controls the calculation period for institutional flow analysis.
Higher values provide smoother signals but reduce responsiveness to recent activity
● Volume Spike Threshold
○ Default: 1.8
○ Range: 1.0-5.0
○ Description: Multiplier for detecting unusual volume activity indicating institutional participation. Higher values require more extreme volume for detection
● Large Trade Weight
○ Default: 2.5
○ Range: 1.5-5.0
○ Description: Weight applied to high volume periods in smart money calculations. Increases emphasis on institutional sized transactions
Divergence Detection
● Pivot Detection Period
○ Default: 12
○ Range: 5-50
○ Description: Bars to analyze for pivot high/low identification.
Affects divergence accuracy and signal frequency
● Minimum Divergence Strength
○ Default: 0.25
○ Range: 0.1-1.0
○ Description: Required price change percentage for valid divergence patterns.
Higher values filter out weaker signals
✅ Best Use Cases
● Trading with intraday to daily timeframes for institutional position identification
● Confirming trend reversals when divergences align with support/resistance levels
● Entry timing in trending markets when institutional bias supports the direction
● Risk management by avoiding trades against strong institutional positioning
● Multi timeframe analysis combining short term signals with longer term bias
⚠️ Limitations
● Requires sufficient volume for accurate institutional detection in low volume markets
● Divergence signals may have false positives during highly volatile news events
● Best performance on liquid markets with consistent institutional participation
● Lagging nature of volume based calculations may delay signal generation
● Effectiveness reduced during low participation holiday periods
💡 What Makes This Unique
● Multi Factor Analysis: Combines volume, price, and momentum for comprehensive institutional detection
● Adaptive Zones: Dynamic overbought/oversold levels that adjust to market conditions
● Volume Intelligence: Advanced algorithms identify institutional sized transactions
● Professional Visualization: Multiple display styles with customizable themes
● Confirmation System: Multiple validation layers reduce false signal generation
🔬 How It Works
1. Volume Analysis Phase:
● Analyzes current volume against historical averages to identify institutional activity
● Applies multi timeframe analysis for enhanced detection accuracy
● Calculates volume pressure through buying vs selling momentum
2. Smart Money Flow Calculation:
● Combines typical price with volume weighted analysis
● Applies institutional trade weighting for high volume periods
● Generates directional flow based on price momentum and volume expansion
3. Divergence Detection Process:
● Identifies pivot highs/lows in both price and indicator values
● Validates divergence strength against minimum threshold requirements
● Confirms signals through multiple technical factors before generation
💡 Note: This indicator works best when combined with proper risk management and position sizing. The institutional bias component helps identify market sentiment shifts, while divergence signals provide specific entry opportunities. For optimal results, use on liquid markets with consistent institutional participation and combine with additional technical analysis methods.

RSI-Divergence Goggles [Trendoscope®]🎲 Introducing the RSI-Divergence Goggle
🎯 Revolutionizing Divergence Analysis in Trading
While the concept of divergence plays a crucial role in technical analysis, existing indicators in the community library have faced limitations, particularly in simultaneously displaying divergence lines on both price and oscillator graphs. This challenge stems from the fact that RSI and other oscillators are typically plotted in a separate pane from the price chart. Traditional Pine Script® indicators are confined to a single pane, thus restricting comprehensive divergence analysis.
🎯 Our Innovative Solution: RSI on the Price Pane
The RSI-Divergence Goggle breaks through these limitations. Our innovative approach involves plotting the RSI directly onto the price pane within a movable and resizable widget. This groundbreaking feature allows for the simultaneous drawing of zigzag patterns on both price and the oscillator, enabling the effective calculation and visualization of divergence lines on both.
🎯 The Foundation: Our Divergence Research and Rules
Our journey into divergence research began three years ago with the launch of the "Zigzag Trend Divergence Detector." The foundational rules established with this script remain pertinent and form the basis of all our subsequent divergence-based indicators.
🎯 Understanding Divergence: Key Concepts
Divergence Varieties : We identify two main types - Bullish Divergence (and its hidden counterpart) occurs at pivot lows, while Bearish Divergence (and its hidden version) appears at pivot highs.
Contextual Occurrence : Bullish divergence is a phenomenon of downtrends, whereas bearish divergence is unique to uptrend. Conversely, hidden bullish divergence arises in uptrends, and hidden bearish divergence in downtrends.
Oscillator Behavior : In standard divergence scenarios, the oscillator lags behind price, signaling potential reversals. In hidden divergence cases, the oscillator leads, suggesting trend continuation.
🎯 Visual Insights: Divergence and Hidden Divergence
For a clearer understanding, refer to our visual guides:
🎯 A Word of Caution
While divergence is a powerful tool, it's not a standalone guarantee of trend reversals or continuations. We recommend using these patterns in conjunction with support and resistance levels, as demonstrated in our "Divergence Based Support Resistance" implementation.
🎯 Using the RSI-Divergence Goggles
Upon applying the indicator to your chart, you'll be prompted to select two corner points, defining the widget's placement and size. This widget is the stage for your RSI plotting and divergence calculations. Choose these points carefully to ensure they encompass your area of interest without overlapping important price bars.
An example as below.
🎯 Innovative Features:
Plotting RSI: RSI values are scaled from 0 to 100 within the widget. This unique plotting may not align with individual bar values, but pivot labels and tooltips provide detailed RSI and retracement ratio information.
Zigzag and Pivots: Our adjusted RSI plots determine the zigzag pivot highs and lows, which may not always correspond with visible price pivots. However, calculations based on close prices ensure minimal deviation.
Divergence Display: Divergence types are identified following our established rules, with a simple moving average employed to discern the prevailing trend.
🎯 Trend Detection Mechanism
A simple moving average is used as base for determining the trend. If the difference between moving averages of the alternate pivots is positive, then the sentiment is considered to be uptrend. Else, we consider the sentiment to be in downtrend.
This is a simple method to identify trend, implemented via this indicator. The indicator does not provide alternative methods to identify trend. This is something that we can explore in the future.
🎯 Interactive and Customizable
The RSI-Divergence Goggle isn't just a static tool; it's an interactive feature on your chart. You can move or resize the widget, allowing for dynamic analysis and focused study on different chart segments.

RSI Overbought/Oversold + Divergence IndicatorDESCRIPTION:
This script combines the Relative Strength Index ( RSI ), Moving Average and Divergence indicator to make a better decision when to enter or exit a trade.
- The Moving Average line (MA) has been made hidden by default but enhanced with an RSIMA cloud.
- When the RSI is above the selected MA it turns into green and when the RSI is below the select MA it turns into red.
- When the RSI is moving into the Overbought or Oversold area, some highlighted areas will appear.
- When some divergences or hidden divergences are detected an extra indication will be highlighted.
- When the divergence appear in the Overbought or Oversold area the more weight it give to make a decision.
- The same color pallet has been used as the default candlestick colors so it looks familiar.
HOW TO USE:
The prerequisite is that we have some knowledge about the Elliot Wave Theory, the Fibonacci Retracement and the Fibonacci Extension tools.
Wave 1
(1) When we receive some buy signals we wait until we receive some extra indications.
(2) On the RSI Overbought/Oversold + Divergence Indicator we can see a Bullish Divergence and our RSI is changing from red to green ( RSI is higher then the MA).
(3) If we are getting here into the trade then we need to use a stop loss. We put our stop loss 1 a 2 pips just below the lowest wick. We also invest maximum 50% of the total amount we want to invest.
Wave 2
(4) Now we wait until we see a clear reversal and here we starting to use the Fibonacci Retracement tool. We draw a line from the lowest point of wave(1) till the highest point of wave (1). When we are retraced till the 0.618 fib also called the golden ratio we check again the RSI Overbought/Oversold + Divergence Indicator. When we see a reversal we do our second buy. We set again a stop loss just below the lowest wick (this is the yellow line on the chart). We also move the stop loss we have set in step (3) to this level.
Wave 3
(5) To identify how far the uptrend can go we need to use the Fibonacci Extension tool. We draw a line from the lowest point of wave(1) till the highest point of wave (1) and draw it back to the lowest point of wave (2). Wave (3) is most of the time the longest wave and can go till it has reached the 1.618 or 2.618 fib. On the 1.618 we can take some profit. If we don't want to sell we move our stop loss to the 1 fib line (yellow line on the chart).
(6) We wait until we see a clear reversal on the Overbought/Oversold + Divergence Indicator and sell 33% to 50% of our investment.
Wave 4
(7) Now we wait again until we see a clear reversal and here we starting to use the Fibonacci Retracement tool. We draw a line from the lowest point of wave(2) till the highest point of wave (3). When we are retraced till the 0.618 fib also called the golden ratio we check again the RSI Overbought/Oversold + Divergence Indicator. When we see a reversal we buy again. We set again a stop loss just below the lowest wick (this is the yellow line on the chart).
(8) If we bought at the first reversal ours stop los was triggered (9) and we got out of the trade.
(9) If we did not bought at step (7) because our candle did not hit the 0.618 fib or we got stopped out of the trade we buy again at the reversal.
Wave 5
(10) To identify how far the uptrend can go we need to use the Fibonacci Extension tool. We draw a line from the lowest point of wave(2) till the highest point of wave (3) and draw it back to the lowest point of wave (4). Most of the time wave 5 goes up till it has reached the 1 fib. And that is the point where we got out of the trade with all of our investment. In this trade we got out of the trade a bit earlier. We received the sell signals and got a reversal on the Overbought/Oversold + Divergence Indicator.
We are hoping you learned something so you can make better decisions when to get into or out of a trade.
If you have any question just drop it into the comments below.
FEATURES:
• You can show/hide the RSI .
• You can show/hide the MA.
• You can show/hide the lRSIMA cloud.
• You can show/hide the Stoch RSI cloud.
• You can show/hide and adjust the Overbought and Oversold zones.
• You can show/hide and adjust the Overbought Extended and Oversold Extended zones.
• You can show/hide the Overbought and Oversold highlighted zones.
• Etc...
HOW TO GET ACCESS TO THE SCRIPT:
• Favorite the script and add it to your chart.
REMARKS:
• This advice is NOT financial advice.
• We do not provide personal investment advice and we are not a qualified licensed investment advisor.
• All information found here, including any ideas, opinions, views, predictions, forecasts, commentaries, suggestions, or stock picks, expressed or implied herein, are for informational, entertainment or educational purposes only and should not be construed as personal investment advice.
• We will not and cannot be held liable for any actions you take as a result of anything you read here.
• We only provide this information to help you make a better decision.
• While the information provided is believed to be accurate, it may include errors or inaccuracies.
Good Luck and have fun,
The CryptoSignalScanner Team
