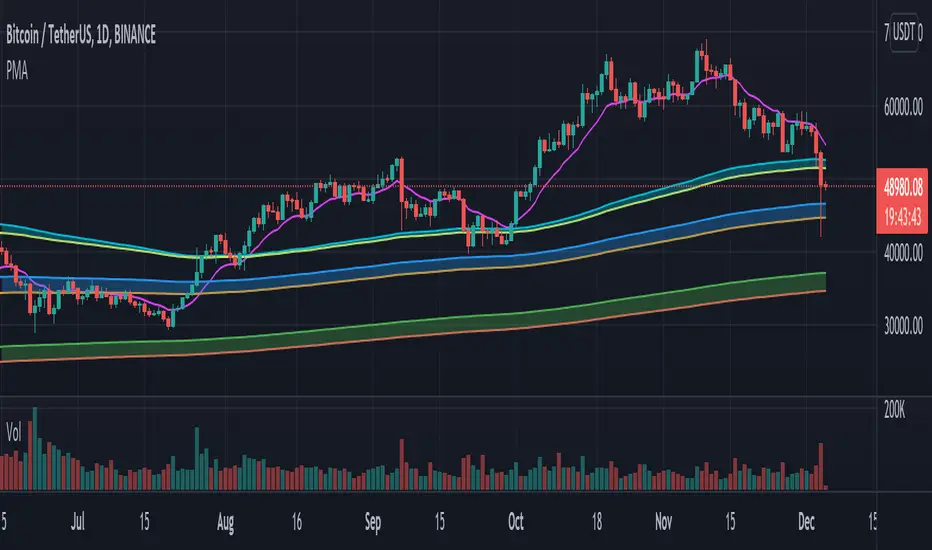
Pulu's Moving AveragesPulu's Moving Averages
This script allows you to customize sets of moving averages. It is configured default as 3 Vegas tunnels + an MA12. You can re-configure it for any of your moving average studies. At the first release, it supports up to 7 moving averages, many parameters, and eight types of algorithms:
ALMA, Arnaud Legoux Moving Average
EMA, Exponential Moving Average
RMA, Adjusted exponential moving average (aka Wilder’s EMA)
SMA, Simple Moving Average
SWMA, Symmetrically-Weighted Moving Average
VWAP, Volume-Weighted Average Price
VWMA, Volume-Weighted Moving Average
WMA, Weighted Moving Average
If you are looking for only 3 moving averages, there is another script "Pulu's 3 Moving Averages".
Cerca negli script per "Exponential Moving Average"
Elder Impulse System + ATR BandsDisregard the above chart, I am not sure why it isn't showing the one I want, which is linked below:
This is as far as I can tell the closest representation to Dr. Alexander Elder's updated "Elder Impulse System" that has added ATR-volatility bands up to 3x deviations from price. I got the idea from watching this recent video (www.youtube.com) of Dr. Elder reviewing some recent trades and noticed he had updated his system from his original books. The Impulse System colour coding was inspired by AstralLoverFlow and LazyBear. ATR Bands are pre-programmed Keltner Channels with some modifications such as filing in the ATR Zones with user-selected colour bands and modifying the ATR value to better suit the volatility of the market being traded.
The script has several components, which I will detail below:
Exponential Moving Averages:
1) A 13-period EMA that is used as a staple in all of Dr. Elder's technical analysis. He uses this EMA as the basis for all of his indicators and why it is included here.
2) A 26-period EMA which can be used as a base-line of sorts to filter when to go long or when to go short. For instance, price over the 26-EMA, price is strong and the rally upwards is likely to continue, underneath it, price is weak and likely to continue downwards for a time.
Volatility Bands:
By definition these are nothing more than 3 separate Keltner Channels of a 13-period EMA each set to one additional multiplier from the moving average. This gives us a 1x, 2x, and 3x multiplier of average volatility from the 13-period EMA based on a 14-period Average True Range (ATR) reading. The ATR was chosen as it accommodates price gaps and also is the standard formula calculation in TradingView. The values of the bands cannot be adjusted but the colour coding of them can be.
Elder Impulse System:
These colour-coded bars show you the strength and direction of the current chart resolution, calculated by the slope of a 13-period EMA and the slope of a MACD histogram. These are used not as a buying or selling recommendation alone but as trend filters, as per Dr. Elder's own description of them.
Green Bars = The 13-period EMA is sloping positively and the MACD histogram is rising compared to previous bars. The trader should only consider buying/long opportunities when a green bar is most recent.
Red Bars = The 13-period EMA is sloping negatively and the MACD histogram is falling compared to previous bars. The trader should only consider selling/short opportunities when a red bar is most recent.
Blue Bars = The 13-period EMA and the MACD histogram are not aligned. One of the indicators is sloping opposite to the other indicator. These are known as indecision bars and are typically seen near the end of a previously established trend. The trader can choose to wait for either a green or red bar to shape their trading bias if they are more risk-averse while a counter-trend trader may decide to try opening a position against the currently-established trend.
How To Trade the System:
This system is unique in that it is so versatile and will fit the styles of many traders, be it trend following traders (generally the original Elder Impulse System design) or mean-reversion/counter-trend trading (the original Keltner Channel design). None of the examples below or in the chart above are financial advice and are just there for demonstration purposes only.
1) The most basic signal given would be the moving average cross up or down. A cross of the 13-EMA over the 26-EMA signals upward trend strength and the trader could look for buying opportunities. Conversely, the 13-EMA under the 26-EMA shows downward trend strength and the trader could look for selling opportunities.
2) Following the Elder Impulse system in conjunction with the EMAs. Look for long opportunities when a green bar is printed and price is over both of the 13- and 26-period EMAs. Look for short opportunities when a red bar is printed and price is below both of the 13- and 26-period EMAs. Keep in mind this does not necessarily need a moving average cross to be viable, a green or red bar over both EMAs is a valid signal in this system, usually. Examine price more closely for better entry signals when a blue bar is printed and price is either above or below both EMAs if you are a trend trader. This is how Dr. Elder originally intended the system to be used in conjunction with his famous Triple Screen Trading System. I am not going into detail here as it is a deep subject but I would suggest an interested trader to examine this Triple Screen System further as it is widely accepted as a strong strategy.
3) Mean Reversion and Counter-Trend Trading. Dr. Elder mentions that the zone between the two EMAs is called the Value Zone. A mean reversion trader could look for buying opportunities if price has generally been in an uptrend and falls back to value, conversely, they could look for shorting opportunities if price has generally been in a downtrend and rises back to value. These are your very basic pull backs found in trends that create your higher lows in an uptrend or your lower highs in a downtrend. A mean reversion/scalper trader may also look to use the upper and lower most ATR bands as an indication of price being overbought or oversold and could look to enter a counter-trend trade here once a blue indecision bar is printed and to ride that move back down to the Value Zone.
Taking Profits and Risk Management
This system again is very versatile and will fit a wide range of trading styles. It has built in take profit levels and risk management depending on your style of trading.
1a) In original Triple Screen Trading (and the original Elder Impulse system), a trader was to place a buy order one tick above a newly printed green bar with a stop loss one tick below the most recent 2-day low, and vice-versa for red bars on short selling. as long as other criteria were met, that I will not go into. It is all over YouTube and in his books and on Investopedia if you want more information. The general idea is to continue the trend in the direction if price is strong and you are bought into that move with a close stop, or if price falls back a little bit, you can get in at a better price. This would be a system typically better suited to a scalper.
1b) The updated risk management according to the above video is to place a stop loss at least 2ATR away from price. These bands already have calculated these values so a trader can place a stop one tick below the 2 or even 3ATR zones depending on their risk appetite. This is assuming you have already received a strong buy signal based on the system you follow. This would be a system typically better suited to a trend-trader.
2a) Taking profits if you are a trend trader has several possibilities. The first, as Dr. Elder suggests, is to place a price target 2ATR values away from your entry giving you approximately a 1:1 risk-reward ratio.
2b) The second possibility if the trade is successful is to ride the trend upwards until a blue bar is printed, suggesting indecision in the market. A modified version of this that could let a winning trade run longer is to wait for the price to close under the 13-EMA in fast markets, or close under the 26-EMA in slightly slower markets to maximize potential winnings.
2c) A scalper trader may wish to have a target at either the value zone if they are playing an extended buy/short back to the mean, or if they are being at the mean, to sell or cover when price extends back out to the 2x or 3x zone.
3) Trend traders can additionally use the ATR zones as a sort of safety guidelines for entering a trade. Anything within the 1ATR zone is typically a safer entry as the market is less volatile at this time. Entering when price has gone into the 2ATR zone is signaled as a strong momentum move and can signal a stronger move in the direction of the current closing bar. While not always the case, it is suggested by Dr. Elder to not enter trend trades at the 3ATR zone as this is where you will be likely looking for a counter-trend retracement back to value and a trader entering here in the direction of the trade has a higher chance of being stopped out or not getting in at the best possible price.

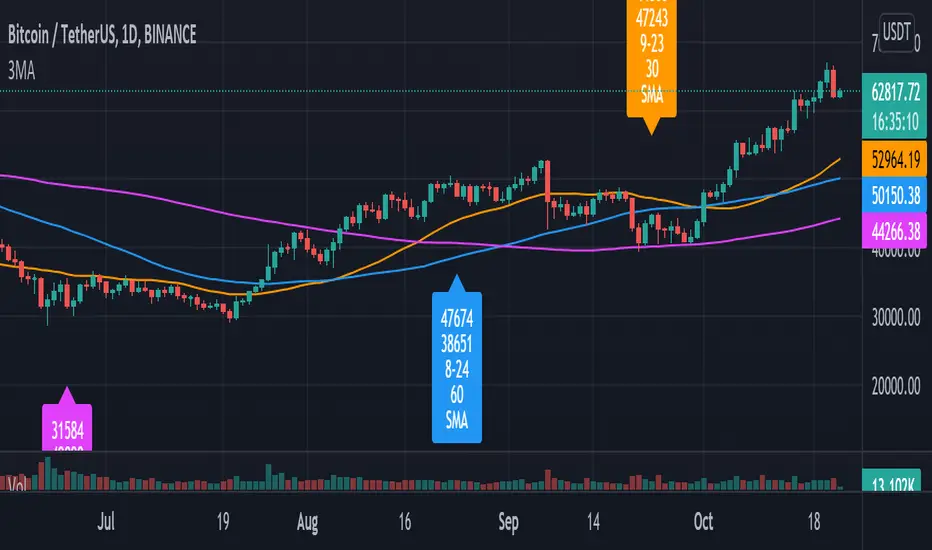
Pulu's 3 Moving Averages
Pulu's 3 Moving Averages
Release version 1, date 2021-09-28
This script allows you to customize three sets of moving averages, turn on/off, set color and parameters. It also tags the start date of the last set of moving average if there is. This, release version 1, supports eight moving average algorithms:
ALMA, Arnaud Legoux Moving Average
EMA, Exponential Moving Average
RMA, Adjusted exponential moving average (aka Wilder’s EMA)
SMA, Simple Moving Average
SWMA, Symmetrically-Weighted Moving Average
VWAP, Volume-Weighted Average Price
VWMA, Volume-Weighted Moving Average
WMA, Weighted Moving Average
The availability and function parameters
Func. Availability Parameters
ALMA
MA1, MA2, MA3
source
length
offset
sigma
EMA
RMA
SMA
VWMA
WMA
MA1, MA2, MA3
source
length
SWMA
VWAP
MA1
source
Parameters
Parameter Description
source the series of values to process. The default is to use the closing price to calculate the moving average.
length an integer value that defines the number of bars to calculate the moving average on. The SWMA and VWAP do not use this parameter.
ALMA offset a floating-point value that controls the tradeoff between smoothness (with a value closer to 1) and responsiveness (with a value closer to 0). This parameter is only used by ALMA.
ALMA sigma a floating-point value that specifies the ALMA’s smoothness. The larger this value, the smoother the moving average is. This parameter is only used by ALMA.
I'm not sure if it is needed, so I do not let the three Moving Averages of the script to have indivial algorithm setting. Because that will involve much complicated condition testing and use up more TradingView script lines limit. If you need to combine different algorithms in the three sets of moving averages, or have other ideas, leave a message to let me know; maybe I will try it in the next update.
我不確定是否需要,所以我沒有讓腳本的三組移動平均線有各別的算法設置。因為這將涉及更多複雜的條件測試,並使用更多 TradingView 腳本列數限制。如果您需要在三組均線中組合不同的算法,或者有其他想法,請留言告訴我;也許我會在下一次更新中嘗試。
Technical Ratings█ OVERVIEW
This indicator calculates TradingView's well-known "Strong Buy", "Buy", "Neutral", "Sell" or "Strong Sell" states using the aggregate biases of 26 different technical indicators.
█ FEATURES
Differences with the built-in version
• You can adjust the weight of the Oscillators and MAs components of the rating here.
• The built-in version produces values matching the states displayed in the "Technicals" ratings gauge; this one does not always, where weighting is used.
• A strategy version is also available as a built-in; this script is an indicator—not a strategy.
• This indicator will show a slightly different vertical scale, as it does not use a fixed scale like the built-in.
• This version allows control over repainting of the signal when you do not use a higher timeframe. Higher timeframe (HTF) information from this version does not repaint.
• You can configure markers on signal breaches of configurable levels, or on advances declines of the signal.
The indicator's settings allow you to:
• Choose the timeframe you want calculations to be made on.
• When not using a HTF, you can select a repainting or non-repainting signal.
• When using both MAs and Oscillators groups to calculate the rating, you can vary the weight of each group in the calculation. The default is 50/50.
Because the MAs group uses longer periods for some of its components, its value is not as jumpy as the Oscillators value.
Increasing the weight of the MAs group will thus have a calming effect on the signal.
• Alerts can be created on the indicator using the conditions configured to control the display of markers.
Display
The calculated rating is displayed as columns, but you can change the style in the inputs. The color of the signal can be one of three colors: bull, bear, or neutral. You can choose from a few presets, or check one and edit its color. The color is determined from the rating's value. Between 0.1 and -0.1 it is in the neutral color. Above/below 0.1/-0.1 it will appear in the bull/bear color. The intensity of the bull/bear color is determined by cumulative advances/declines in the rating. It is capped to 5, so there are five intensities for each of the bull/bear colors.
The "Strong Buy", "Buy", "Neutral", "Sell" or "Strong Sell" state of the last calculated value is displayed to the right of the last bar for each of the three groups: All, MAs and Oscillators. The first value always reflects your selection in the "Rating uses" field and is the one used to display the signal. A "Strong Buy" or "Strong Sell" state appears when the signal is above/below the 0.5/-0.5 level. A "Buy" or "Sell" state appears when the signal is above/below the 0.1/-0.1 level. The "Neutral" state appears when the signal is between 0.1 and -0.1 inclusively.
Five levels are always displayed: 0.5 and 0.1 in the bull color, zero in the neutral color, and -0.1 and - 0.5 in the bull color.
The levels that can be used to determine the breaches displaying long/short markers will only be visible when their respective long/short markers are turned on in the "Direction" input. The levels appear as a bright dotted line in bull/bear colors. You can control both levels separately through the "Longs Level" and "Shorts Level" inputs.
If you specify a higher timeframe that is not greater than the chart's timeframe, an error message will appear and the indicator's background will turn red, as it doesn't make sense to use a lower timeframe than the chart's.
Markers
Markers are small triangles that appear at the bottom and top of the indicator's pane. The marker settings define the conditions that will trigger an alert when you configure an alert on the indicator. You can:
• Choose if you want long, short or both long and short markers.
• Determine the signal level and/or the number of cumulative advances/declines in the signal which must be reached for either a long or short marker to appear.
Reminder: the number of advances/declines is also what controls the brightness of the plotted signal.
• Decide if you want to restrict markers to ones that alternate between longs and shorts, if you are displaying both directions.
This helps to minimize the number of markers, e.g., only the first long marker will be displayed, and then no more long markers will appear until a short comes in, then a long, etc.
Alerts
When you create an alert from this indicator, that alert will trigger whenever your marker conditions are confirmed. Before creating your alert, configure the makers so they reflect the conditions you want your alert to trigger on.
The script uses the alert() function, which entails that you select the "Any alert() function call" condition from the "Create Alert" dialog box when creating alerts on the script. The alert messages can be configured in the inputs. You can safely disregard the warning popup that appears when you create alerts from this script. Alerts will not repaint. Markers will appear, and thus alerts will trigger, at the opening of the bar following the confirmation of the marker condition. Markers will never disappear from the bar once they appear.
Repainting
This indicator uses a two-pronged approach to control repainting. The repainting of the displayed signal is controlled through the "Repainting" field in the script's inputs. This only applies when you have "Same as chart" selected in the "Timeframe" field, as higher timeframe data never repaints. Regardless of that setting, markers and thus alerts never repaint.
When using the chart's timeframe, choosing a non-repainting signal makes the signal one bar late, so that it only displays a value once the bar it was calculated has elapsed. When using a higher timeframe, new values are only displayed once the higher timeframe completes.
Because the markers never repaint, their logic adapts to the repainting setting used for the signal. When the signal repaints, markers will only appear at the close of a realtime bar. When the signal does not repaint (or if you use a higher timeframe), alerts will appear at the beginning of the realtime bar, since they are calculated on values that already do not repaint.
█ CALCULATIONS
The indicator calculates the aggregate value of two groups of indicators: moving averages and oscillators.
The "MAs" group is comprised of 15 different components:
• Six Simple Moving Averages of periods 10, 20, 30, 50, 100 and 200
• Six Exponential Moving Averages of the same periods
• A Hull Moving Average of period 9
• A Volume-weighed Moving Average of period 20
• Ichimoku
The "Oscillators" group includes 11 components:
• RSI
• Stochastic
• CCI
• ADX
• Awesome Oscillator
• Momentum
• MACD
• Stochastic RSI
• Wiliams %R
• Bull Bear Power
• Ultimate Oscillator
The state of each group's components is evaluated to a +1/0/-1 value corresponding to its bull/neutral/bear bias. The resulting value for each of the two groups are then averaged to produce the overall value for the indicator, which oscillates between +1 and -1. The complete conditions used in the calculations are documented in the Help Center .
█ NOTES
Accuracy
When comparing values to the other versions of the Rating, make sure you are comparing similar timeframes, as the "Technicals" gauge in the chart's right pane, for example, uses a 1D timeframe by default.
For coders
We use a handy characteristic of array.avg() which, contrary to avg() , does not return na when one of the averaged values is na . It will average only the array elements which are not na . This is useful in the context where the functions used to calculate the bull/neutral/bear bias for each component used in the rating include special checks to return na whenever the dataset does not yet contain enough data to provide reliable values. This way, components gradually kick in the calculations as the script calculates on more and more historical data.
We also use the new `group` and `tooltip` parameters to input() , as well as dynamic color generation of different transparencies from the bull/bear/neutral colors selected by the user.
Our script was written using the PineCoders Coding Conventions for Pine .
The description was formatted using the techniques explained in the How We Write and Format Script Descriptions PineCoders publication.
Bits and pieces were lifted from the PineCoders' MTF Selection Framework .
Look first. Then leap.

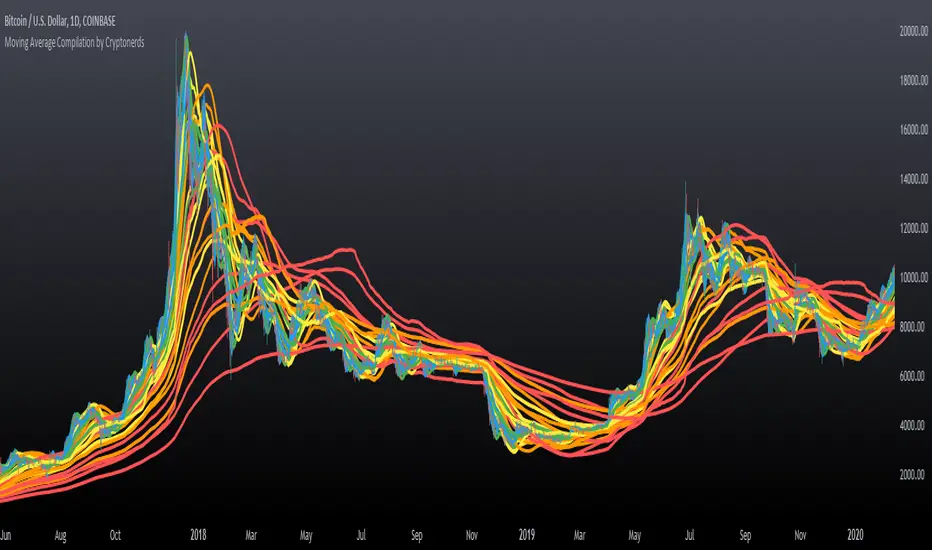
Moving Average Compilation by CryptonerdsThis script contains all commonly used types of moving averages in a single script. To our surprise, it turned out that there was no script available yet that contains multiple types of moving averages.
The following types of moving averages are included:
Simple Moving Averages (SMA)
Exponential Moving Averages (EMA)
Double Exponential Moving Averages (DEMA)
Display Triple Exponential Moving Averages (TEMA)
Display Weighted Moving Averages (WMA)
Display Hull Moving Averages (HMA)
Wilder's exponential moving averages (RMA)
Volume-Weighted Moving Averages (VWMA)
The user can configure what type of moving averages are displayed, including the length and up to five multiple moving averages per type. If you have any other request related to adding moving averages, please leave a comment in the section below.
If you've learned something new and found value, leave us a message to show your support!
Volatility Bands by DGTVolatility represents how large an asset's prices swing around the mean price, the degree of variation of a trading price over time, and is commonly measured with beta (β) coefficients, standard deviations (σ) of returns where tools such as Average True Range, Bollinger Bands, Keltner Channel, Squeeze Indicator, etc presents volatility concept
Volatility often refers to the amount of uncertainty or risk related to the size of changes in a security's value. The higher the volatility, the riskier the security - the price of the security can change dramatically over a short time period in either direction. A lower volatility - security's value does not fluctuate dramatically, and tends to be more steady
This study, Volatility Bands , attempts to present a way to measure and visualize volatility , using standard deviations (σ) and average true range indicator, and aims to point out areas that might indicate potential trading opportunities
I will try to explain the usage with examples,
same setup with different option selected
as you may observe from the examples different setting may have advantages and disadvantages over one another, it is recommended to verify a trading setup with different available options.
Additionally, It is recommended to use this indicator in conjunction with other technical indicators, or verify using chart/candle patterns. Below is an usage example using in conjunction with other indicator, in the given example “Neglected Volume by DGT” is selected
Similarities and Differences
Bollinger Bands depicts two standard deviations above and below a simple moving average, and Keltner Channel depicts two times average true range (ATR) above and below an exponential moving average
Volatility Bands study combines the approach of both Bollinger Bands and Keltner Channel, with different settings and different visualization
Default settings are one standard deviations and one time average true range (ATR) above and below 13 period exponential moving average. Setting can be adjusted by users but let me remind all testes are performed with the default settings.
Mathematically expressed as
Upper band area between “ema + stdev” and “ema + atr”
Lower band area between “ema – stdev” and “ema – atr”
A different display is added with the inspiration I get from one of the @quantgym ‘s study, many thanks @quantgym 😉
When difference band display is selected the study will reflect the area between “ema + stdev – atr” and “ema – stdev + atr”. As shown in the examples above
Note: standard deviation calculation can be adjusted based on price action or its moving average.
Other differentiation between BB and KC is with V-BANDS mostly we look for trade opportunities when price action move out of the bands and in most cases we assume market is consolidating when the price action is within the bands
The other indicator that presents similarities to Volatility Bands is Squeeze Indicator, which measures the relationship between Bollinger Bands and Keltner's Channels to help identify consolidations and signal when prices are likely to break out. Mainly Volatility Bands is different version of Squeeze indicator, in fact the purpose is almost same but visualization is completely different. Additionally Volatility Bands Offers trading opportunities whereas Squeeze indicator only presents market states unless a momentum indicator is adapted to Squeeze indicator.
Disclaimer:
Trading success is all about following your trading strategy and the indicators should fit within your trading strategy, and not to be traded upon solely
The script is for informational and educational purposes only. Use of the script does not constitute professional and/or financial advice. You alone have the sole responsibility of evaluating the script output and risks associated with the use of the script. In exchange for using the script, you agree not to hold dgtrd TradingView user liable for any possible claim for damages arising from any decision you make based on use of the script

Trade System Crypto InvestidorTrade System created to facilitate the visualization of crossing and extensions of the movements with Bollinger bands.
Composed by:
Moving Averages of 21, 50, 100 and 200.
Exponential Moving Averages: 17,34,72,144, 200 and 610.
Bollinger bands with standard deviation 2 and 3.
How it works?
The indicators work together, however there are some important cross-averages that need to be identified.
- Crossing the MA21 with 50, 100 and 200 up or down will dictate an up or down trend.
- MA200 and EMA200 are excellent indicators of resistance and support zone, if the price is above these averages it will be a great support, if the price is below these averages it will indicate strong resistance.
- Another important crossover refers to exponential moving averages of 17 to 72 indicates a possible start of a trend
- The crossing of the exponential moving average of 34 with 144 will confirm the crossing mentioned above.
- In addition, the exponential moving average of 610 used by Bo Williams is an excellent reference for dictating an upward or downward trend, if the price is above it it will possibly confirm an upward trend and the downside.
- To conclude we have bollinger bands with standard deviation 2 and 3, they help to identify the maximum movements.

Binque's Multi-Moving Average Binque's Multi-Moving Average - One indicator with four simple moving average and four exponential moving averages, plus as a bonus a Day High moving average and a Day Low Moving Average.
Simple Moving Average or MA(14), MA(50), MA(100) and MA(200) all in one indicator
Exponential Moving Average or EMA(8), EMA(14), EMA(20) and EMA(33) all in one indicator
Day High Moving Average - Tracks the Daily High versus most moving averages track the daily close.
Day Low Moving Average - Tracks the Daily Low versus most moving average track the daily close.
To Disable moving averages, Set the color to the chart background and then set the length to 1 and uncheck.
I Use the Daily High Moving Average to track upward resistance in a stock movement for Swing Trading.
I Use the Daily Low Moving Average to track my trailing stop in a stock movement for Swing Trading.

Daily Levels & MAs on intraday timeframeDaily Levels & MAs - Professional Key Level Tracker
📊 OVERVIEW
A comprehensive indicator that displays critical daily moving averages and key price levels all in one clean view. Perfect for traders who need to see support/resistance zones and trend indicators without cluttering their charts.
🎯 WHAT IT SHOWS
Seven essential reference levels:
- 50 SMA (Daily Simple Moving Average) - Yellow
- 21 EMA (Daily Exponential Moving Average) - Red
- 9 EMA (Daily Exponential Moving Average) - White
- Prior Day High (PDH) - Green
- Prior Day Low (PDL) - Purple/Magenta
- Premarket High (PM High) - Purple
- Premarket Low (PM Low) - Orange
✨ KEY FEATURES
✓ All lines extend to the right with clear price labels
✓ Daily moving averages calculated from daily timeframe data
✓ Prior Day High/Low tracks ONLY regular trading hours (9:30 AM - 4:00 PM)
✓ Premarket levels capture 4:00 AM - 9:30 AM price action
✓ Dotted line style keeps chart clean and readable
✓ Semi-transparent labels don't obstruct price action
✓ Works on ALL intraday timeframes
✓ Auto-updates throughout the day
🔧 TECHNICAL SPECIFICATIONS
- Lines start from beginning of current trading session
- Labels positioned 10 bars to the right of current price
- Max lines: 500 (efficient performance)
- No repainting - uses confirmed historical data
- Premarket lines remain visible during regular hours
📈 IDEAL FOR
- Day traders tracking intraday support/resistance
- Swing traders monitoring key daily trend levels
- Gap traders who need premarket reference points
- Breakout traders watching PDH/PDL violations
- Trend followers using EMA crossovers
💡 HOW TO USE
**Moving Averages:**
- 50 SMA: Long-term trend direction
- 21 EMA: Medium-term momentum
- 9 EMA: Short-term trend and quick reversals
**Price Levels:**
- PDH/PDL: Yesterday's trading range boundaries
- PM High/Low: Today's premarket extremes
- Watch for breaks above/below these levels for potential momentum
🎨 COLOR CODING
- Yellow: 50 SMA (major trend)
- Red: 21 EMA (medium trend)
- White: 9 EMA (fast trend)
- Green: Prior Day High
- Purple/Magenta: Prior Day Low
- Purple: Premarket High
- Orange: Premarket Low
⚙️ SMART FEATURES
- Prior Day calculations exclude premarket/afterhours noise
- Premarket levels reset daily at 4:00 AM
- All levels visible simultaneously without overlap confusion
- Labels show exact price values for precision entries/exits
- Lines automatically adjust length as trading day progresses
📊 TRADING STRATEGIES
**Breakout Trading:**
- Long above PDH with volume confirmation
- Short below PDL with momentum
**Mean Reversion:**
- Fade extremes back to moving averages
- Look for price rejections at PM High/Low
**Trend Following:**
- Buy pullbacks to 9 EMA in uptrends (price above 21/50)
- Sell rallies to 9 EMA in downtrends (price below 21/50)
**Gap Trading:**
- Compare open to PDH/PDL
- Use PM levels to gauge early sentiment
🔒 NO CONFIGURATION NEEDED
Simply add to your chart and start trading! The indicator automatically:
1. Calculates daily moving averages from higher timeframe
2. Tracks prior day regular hours high/low
3. Monitors current premarket session extremes
4. Displays everything with clear labels and prices
Perfect for professional traders who want institutional-grade levels without the complexity!

Levels Of Interest------------------------------------------------------------------------------------
LEVELS OF INTEREST (LOI)
TRADING INDICATOR GUIDE
------------------------------------------------------------------------------------
Table of Contents:
1. Indicator Overview & Core Functionality
2. VWAP Foundation & Historical Context
3. Multi-Timeframe VWAP Analysis
4. Moving Average Integration System
5. Trend Direction Signal Detection
6. Visual Design & Display Features
7. Custom Level Integration
8. Repaint Protection Technology
9. Practical Trading Applications
10. Setup & Configuration Recommendations
------------------------------------------------------------------------------------
1. INDICATOR OVERVIEW & CORE FUNCTIONALITY
------------------------------------------------------------------------------------
The LOI indicator combines multiple VWAP calculations with moving averages across different timeframes. It's designed to show where institutional money is flowing and help identify key support and resistance levels that actually matter in today's markets.
Primary Functions:
- Multi-timeframe VWAP analysis (Daily, Weekly, Monthly, Yearly)
- Advanced moving average integration (EMA, SMA, HMA)
- Real-time trend direction detection
- Institutional flow analysis
- Dynamic support/resistance identification
Target Users: Day traders, swing traders, position traders, and institutional analysts seeking comprehensive market structure analysis.
------------------------------------------------------------------------------------
2. VWAP FOUNDATION & HISTORICAL CONTEXT
------------------------------------------------------------------------------------
Historical Development: VWAP started in the 1980s when big institutional traders needed a way to measure if they were getting good fills on their massive orders. Unlike regular price averages, VWAP weighs each price by the volume traded at that level. This makes it incredibly useful because it shows you where most of the real money changed hands.
Mathematical Foundation: The basic math is simple: you take each price, multiply it by the volume at that price, add them all up, then divide by total volume. What you get is the true "average" price that reflects actual trading activity, not just random price movements.
Formula: VWAP = Σ(Price × Volume) / Σ(Volume)
Where typical price = (High + Low + Close) / 3
Institutional Behavior Patterns:
- When price trades above VWAP, institutions often look to sell
- When it's below, they're usually buying
- Creates natural support and resistance that you can actually trade against
- Serves as benchmark for execution quality assessment
------------------------------------------------------------------------------------
3. MULTI-TIMEFRAME VWAP ANALYSIS
------------------------------------------------------------------------------------
Core Innovation: Here's where LOI gets interesting. Instead of just showing daily VWAP like most indicators, it displays four different timeframes simultaneously:
**Daily VWAP Implementation**:
- Resets every morning at market open
- Provides clearest picture of intraday institutional sentiment
- Primary tool for day trading strategies
- Most responsive to immediate market conditions
**Weekly VWAP System**:
- Resets each Monday (or first trading day)
- Smooths out daily noise and volatility
- Perfect for swing trades lasting several days to weeks
- Captures weekly institutional positioning
**Monthly VWAP Analysis**:
- Resets at beginning of each calendar month
- Captures bigger institutional rebalancing at month-end
- Fund managers often operate on monthly mandates
- Significant weight in intermediate-term analysis
**Yearly VWAP Perspective**:
- Resets annually for full-year institutional view
- Shows long-term institutional positioning
- Where pension funds and sovereign wealth funds operate
- Critical for major trend identification
Confluence Zone Theory: The magic happens when multiple VWAP levels cluster together. These confluence zones often become major turning points because different types of institutional money all see value at the same price.
------------------------------------------------------------------------------------
4. MOVING AVERAGE INTEGRATION SYSTEM
------------------------------------------------------------------------------------
Multi-Type Implementation: The indicator includes three types of moving averages, each with its own personality and application:
**Exponential Moving Averages (EMAs)**:
- React quickly to recent price changes
- Displayed as solid lines for easy identification
- Optimal performance in trending market conditions
- Higher sensitivity to current price action
**Simple Moving Averages (SMAs)**:
- Treat all historical data points equally
- Appear as dashed lines in visual display
- Slower response but more reliable in choppy conditions
- Traditional approach favored by institutional traders
**Hull Moving Averages (HMAs)**:
- Newest addition to the system (dotted line display)
- Created by Alan Hull in 2005
- Solves classic moving average dilemma: speed vs. accuracy
- Manages to be both responsive and smooth simultaneously
Technical Innovation: Alan Hull's solution addresses the fundamental problem where moving averages are either too slow (missing moves) or too fast (generating false signals). HMAs achieve optimal balance through weighted calculation methodology.
Period Configuration:
- 5-period: Short-term momentum assessment
- 50-period: Intermediate trend identification
- 200-period: Long-term directional confirmation
------------------------------------------------------------------------------------
5. TREND DIRECTION SIGNAL DETECTION
------------------------------------------------------------------------------------
Real-Time Momentum Analysis: One of LOI's best features is its real-time trend detection system. Next to each moving average, visual symbols provide immediate trend assessment:
Symbol System:
- ▲ Rising average (bullish momentum confirmation)
- ▼ Falling average (bearish momentum indication)
- ► Flat average (consolidation or indecision period)
Update Frequency: These signals update in real-time with each new price tick and function across all configured timeframes. Traders can quickly scan daily and weekly trends to assess alignment or conflicting signals.
Multi-Timeframe Trend Analysis:
- Simultaneous daily and weekly trend comparison
- Immediate identification of trend alignment
- Early warning system for potential reversals
- Momentum confirmation for entry decisions
------------------------------------------------------------------------------------
6. VISUAL DESIGN & DISPLAY FEATURES
------------------------------------------------------------------------------------
Color Psychology Framework: The color scheme isn't random but based on psychological associations and trading conventions:
- **Blue Tones**: Institutional neutrality (VWAP levels)
- **Green Spectrum**: Growth and stability (weekly timeframes)
- **Purple Range**: Longer-term sophistication (monthly analysis)
- **Orange Hues**: Importance and attention (yearly perspective)
- **Red Tones**: User-defined significance (custom levels)
Adaptive Display Technology: The indicator automatically adjusts decimal places based on the instrument you're trading. High-priced stocks show 2 decimals, while penny stocks might show 8. This keeps the display incredibly clean regardless of what you're analyzing - no cluttered charts or overwhelming information overload.
Smart Labeling System: Advanced positioning algorithm automatically spaces all elements to prevent overlap, even during extreme zoom levels or multiple timeframe analysis. Every level stays clearly readable without any visual chaos disrupting your analysis.
------------------------------------------------------------------------------------
7. CUSTOM LEVEL INTEGRATION
------------------------------------------------------------------------------------
User-Defined Level System: Beyond the calculated VWAP and moving average levels, traders can add custom horizontal lines at any price point for personalized analysis.
Strategic Applications:
- **Psychological Levels**: Round numbers, previous significant highs/lows
- **Technical Levels**: Fibonacci retracements, pivot points
- **Fundamental Targets**: Analyst price targets, earnings estimates
- **Risk Management**: Stop-loss and take-profit zones
Integration Features:
- Seamless incorporation with smart labeling system
- Custom color selection for visual organization
- Extension capabilities across all chart timeframes
- Maintains display clarity with existing indicators
------------------------------------------------------------------------------------
8. REPAINT PROTECTION TECHNOLOGY
------------------------------------------------------------------------------------
Critical Trading Feature: This addresses one of the most significant issues in live trading applications. Most multi-timeframe indicators "repaint," meaning they display different signals when viewing historical data versus real-time analysis.
Protection Benefits:
- Ensures every displayed signal could have been traded when it appeared
- Eliminates discrepancies between historical and live analysis
- Provides realistic performance expectations
- Maintains signal integrity across chart refreshes
Configuration Options:
- **Protection Enabled**: Default setting for live trading
- **Protection Disabled**: Available for backtesting analysis
- User-selectable toggle based on analysis requirements
- Applies to all multi-timeframe calculations
Implementation Note: With protection enabled, signals may appear one bar later than without protection, but this ensures all signals represent actionable opportunities that could have been executed in real-time market conditions.
------------------------------------------------------------------------------------
9. PRACTICAL TRADING APPLICATIONS
------------------------------------------------------------------------------------
**Day Trading Strategy**:
Focus on daily VWAP with 5-period moving averages. Look for bounces off VWAP or breaks through it with volume. Short-term momentum signals provide entry and exit timing.
**Swing Trading Approach**:
Weekly VWAP becomes your primary anchor point, with 50-period averages showing intermediate trends. Position sizing based on weekly VWAP distance.
**Position Trading Method**:
Monthly and yearly VWAP provide broad market context, while 200-period averages confirm long-term directional bias. Suitable for multi-week to multi-month holdings.
**Multi-Timeframe Confluence Strategy**:
The highest-probability setups occur when daily, weekly, and monthly VWAPs cluster together, especially when multiple moving averages confirm the same direction. These represent institutional consensus zones.
Risk Management Integration:
- VWAP levels serve as dynamic stop-loss references
- Multiple timeframe confirmation reduces false signals
- Institutional flow analysis improves position sizing decisions
- Trend direction signals optimize entry and exit timing
------------------------------------------------------------------------------------
10. SETUP & CONFIGURATION RECOMMENDATIONS
------------------------------------------------------------------------------------
Initial Configuration: Start with default settings and adjust based on individual trading style and market focus. Short-term traders should emphasize daily and weekly timeframes, while longer-term investors benefit from monthly and yearly level analysis.
Transparency Optimization: The transparency settings allow clear price action visibility while maintaining level reference points. Most traders find 70-80% transparency optimal - it provides a clean, unobstructed view of price movement while maintaining all critical reference levels needed for analysis.
Integration Strategy: Remember that no indicator functions effectively in isolation. LOI provides excellent context for institutional flow and trend direction analysis, but should be combined with complementary analysis tools for optimal results.
Performance Considerations:
- Multiple timeframe calculations may impact chart loading speed
- Adjust displayed timeframes based on trading frequency
- Customize color schemes for different market sessions
- Regular review and adjustment of custom levels
------------------------------------------------------------------------------------
FINAL ANALYSIS
------------------------------------------------------------------------------------
Competitive Advantage: What makes LOI different is its focus on where real money actually trades. By combining volume-weighted calculations with multiple timeframes and trend detection, it cuts through market noise to show you what institutions are really doing.
Key Success Factor: Understanding that different timeframes serve different purposes is essential. Use them together to build a complete picture of market structure, then execute trades accordingly.
The integration of institutional flow analysis with technical trend detection creates a comprehensive trading tool that addresses both short-term tactical decisions and longer-term strategic positioning.
------------------------------------------------------------------------------------
END OF DOCUMENTATION
------------------------------------------------------------------------------------

[blackcat] L2 Rhythm RiderOVERVIEW
The L2 Rhythm Rider is an advanced technical analysis tool meticulously crafted to assist traders in identifying intricate market rhythms and uncovering lucrative trading opportunities. By integrating sophisticated calculations such as weighted averages, deviations from Simple Moving Averages (SMAs), and bespoke oscillators, this indicator offers profound insights into market dynamics, momentum, and trend reversals. Whether you're a seasoned trader looking to refine your strategies or a novice seeking robust analytical tools, the Rhythm Rider provides a comprehensive suite of features tailored to enhance your decision-making process 📊✅.
FEATURES
Comprehensive Calculation Suite:
Percentage Deviation from SMA: Quantifies the deviation of the current price from the Simple Moving Average, providing a nuanced understanding of price behavior relative to historical trends.
Normalized Price Range: Standardizes price movements within a defined range, offering a clearer perspective on market volatility and stability.
Explore Line and Average: Utilizes Exponential Moving Averages (EMAs) to gauge market momentum, helping traders anticipate potential shifts in direction.
Banker Fund and Average: Evaluates market sentiment across varying timeframes, enabling traders to align their strategies with broader market trends.
RSI-Like Indicator: Delivers a Relative Strength Index-inspired metric that assesses the magnitude of price changes, akin to traditional RSI but with unique enhancements.
Bear Power: Analyzes selling pressure by examining recent highs and lows, providing valuable insights into bearish market conditions.
Enhanced Color Coding:
Overbought Conditions: Values exceeding 70 are emphasized with warm hues like red and orange, signaling potential overbought scenarios where caution is advised 🔥.
Oversold Conditions: Values falling below 60 are accentuated with cool tones such as blue and cyan, indicating oversold situations ripe for potential buying opportunities ❄️.
Adjusted Line Widths:
Improved Visibility: Line widths have been fine-tuned to ensure clear differentiation between various plotted elements, making it easier to interpret complex market data at a glance 👀.
Visual Representation:
Explore Line: Displayed in blue or red, depending on its value, to signify bullish or bearish momentum.
Banker Fund: Illustrated in orange or aqua, reflecting differing levels of market sentiment.
Bear Power: Depicted through purple columns, highlighting areas of significant selling pressure.
Trade Signals:
Buy ('B') and Sell ('S') Labels: Clearly marked on the chart to indicate optimal entry and exit points, facilitating swift and informed trading decisions 🏷️.
Automated Alerts:
Customizable Notifications: Generate alerts based on predefined conditions, ensuring traders never miss out on critical market movements 🔔.
HOW TO USE
Adding the Indicator:
Navigate to your TradingView chart and select the L2 Rhythm Rider from the indicators list.
Interpreting Visual Elements:
Familiarize yourself with the various plotted lines and columns, each representing distinct facets of market momentum and sentiment.
Monitoring Trade Opportunities:
Keep an eye on the chart for buy and sell labels, which signal potential trading opportunities based on the indicator's calculations.
Setting Up Alerts:
Configure alerts to notify you when specific conditions are met, allowing for timely action without constant chart monitoring 📲.
Combining Insights:
Integrate the information derived from all plotted elements to form a holistic view of the market, enhancing the reliability of your trading decisions.
LIMITATIONS
Market Volatility: In highly volatile or ranging markets, the indicator might produce false signals, necessitating additional confirmation from other analytical tools 🌪️.
Supplementary Analysis: For enhanced accuracy, users should complement this indicator with other forms of technical and fundamental analysis.
Asset and Timeframe Sensitivity: The performance of the indicator can fluctuate based on the asset type and chosen timeframe, requiring periodic adjustments and evaluations.
NOTES
Data Sufficiency: Ensure ample historical data is available to facilitate precise calculations and reliable results.
Demo Testing: Thoroughly test the indicator on demo accounts prior to deploying it in live trading environments to understand its nuances and limitations 🔍.
Personalization: Tailor the indicator’s settings and visual preferences to better suit individual trading styles and objectives.

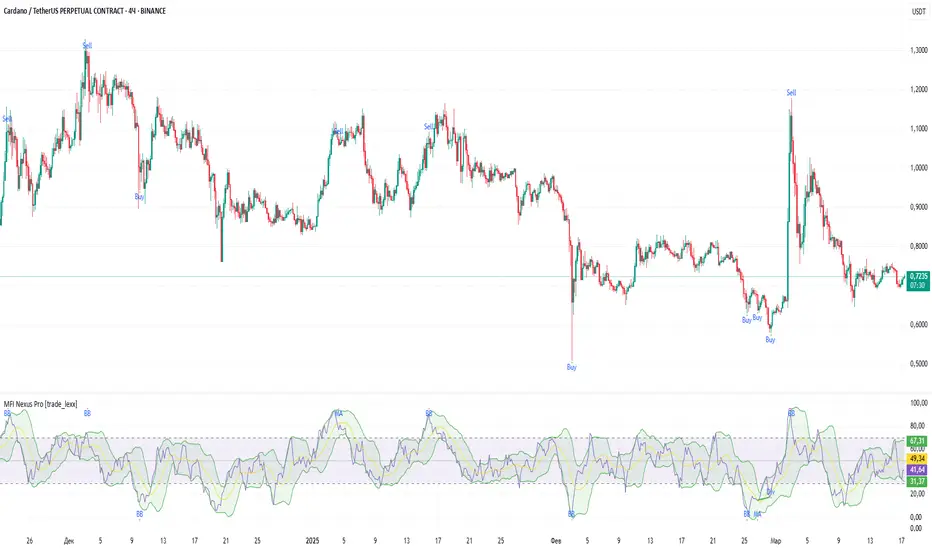
MFI Nexus Pro [trade_lexx]📈 MFI Nexus Pro is your reliable trading assistant!
📊 What is MFI Nexus Pro ?
MFI Nexus Pro is a trading indicator that analyzes cash flows in the market. It shows where money is moving — into or out of an asset, and based on this, generates buy or sell signals.
💡 The main components of the indicator
📊 The MFI Cash Flow Index (MFI)
shows the strength of cash flow into an asset. Values above 70 indicate overbought (an early sale is possible), and values below 30 indicate oversold (an early purchase is possible).
📈 Moving Averages (MA)
The indicator uses 10 different types of moving averages to smooth the MFI line.:
- SMA: Simple moving average
- EMA: Exponential moving average
- WMA: Weighted moving average
And other more complex types (HMA, KAMA, VWMA, ALMA, TEMA, ZLEMA, DEMA)
The choice of the type of moving average affects the speed of the indicator's response to market changes.
🎯 Bollinger Bands (BB)
Bands around the moving average that widen and narrow depending on volatility. They help determine when the MFI is out of the normal range.
🔄 Divergences
Divergences show discrepancies between price and MFI:
- Bullish divergence: the price is falling and the MFI is rising — an upward reversal is possible
- Bearish divergence: the price is rising and the MFI is falling — a downward reversal is possible
🔍 Indicator signals
1️⃣ Moving average signals (MA)
Buy signal
- What happens: MFI crosses its moving average from bottom to top
- What does it look like: the green triangle labeled "MA" under the chart
- What does it mean: money begins to actively flow into the asset, price growth is possible
Sell signal
- What happens: the MFI crosses the moving average from top to bottom
- What does it look like: a red triangle with the label "MA" above the chart
- What does it mean: money starts to leave the asset, the price may fall
2️⃣ Bollinger Band Signals (BB)
Buy signal
- What's happening: The MFI crosses the lower Bollinger band from bottom to top
- What it looks like: the green triangle marked "BB"
- What it means: The MFI was too low and is now starting to recover
Sell Signal
- What's going on: MFI crosses the upper Bollinger band from top to bottom
- What it looks like: a red triangle marked "BB"
- What it means: The MFI was too high and is now starting to decline
3️⃣ Divergence Signals (Div)
Buy Signal (Bullish Divergence)
- What's going on: the price is falling more than the MFI
- What it looks like: a green triangle marked "Div"
- What it means: despite the fall in price, money is already starting to return to the asset
Sell signal (bearish divergence)
- What is happening: the price is rising more strongly than the MFI
- What does it look like: the red triangle with the label "Div"
- What does it mean: despite the price increase, money is already starting to leave the asset
🛠️ Filters to filter out false signals
1️⃣ Minimum distance between the signals
- What it does: sets the minimum number of candles between signals
- Why it is needed: prevents signals from being too frequent during strong market fluctuations
- How to set it up: Set the number from 0 and above (default: 5)
2️⃣ "Waiting for the opposite signal" mode
- What it does: waits for a signal in the opposite direction before generating a new signal
- Why you need it: it helps you not to miss important trend reversals
- How to set up: just turn the function on or off
3️⃣ Filter by MFI levels
- What it does: generates signals only when the MFI is in the specified ranges
- Why it is needed: it helps to catch the moments when the market is oversold or overbought
- How to set up:
- For buy signals: set a range for oversold (e.g. 1-30)
- For sell signals: set a range for overbought (e.g. 70-100)
4️⃣ The RSI filter
- What it does: additionally checks the RSI values to confirm the signals
- Why it is needed: adds additional confirmation from another popular indicator
- How to set up: Similar to the MFI filter, set ranges for buying and selling
🔄 Signal combination modes
1️⃣ Normal mode ("None")
- How it works: all signals (MA, BB, Div) work independently of each other
- When to use it: for general market analysis or when learning how to work with the indicator
2️⃣ "And" mode ("MA and BB and Div")
- How it works: the alarm appears only when several conditions are triggered simultaneously
- Combination options:
- MA+BB: signals from the moving average and Bollinger bands
- MA+Div: signals from the moving average and divergence
- BB+Div: signals from the Bollinger bands and divergence
- MA+BB+Div: all three signals simultaneously
- When to use: for more reliable but rare signals
3️⃣ "OR" mode ("MA or BB or Div")
- How it works: the alarm appears when any of the conditions are triggered
- When to use: for frequent signals when you don't want to miss any opportunity.
🔌 Connecting to trading strategies
The indicator can be connected to your trading strategies using 5 different channels.:
1. Channel for MA signals: connects only signals from moving averages
2. BB signal channel: connects only the signals from the Bollinger bands
3. Channel for divergence signals: connects only divergence signals
4. Channel for "And" mode: connects only combined signals
5. Channel for "OR" mode: connects signals from any source
🔔 Setting up alerts
The indicator can send alerts when alarms appear.:
- Alerts for MA: when the MFI crosses the moving average
- Alerts for BB: when the MFI crosses the Bollinger bands
- Divergence alerts: when a divergence is detected
- Combined alerts: for "AND" and "OR" modes
🎭 What does the indicator look like on the chart ?
- MFI main line: purple line
- Overbought/oversold levels: horizontal lines at levels 30 and 70
- Middle line: dotted line at level 50
- MFI Moving Average: yellow line
- Bollinger bands: green lines around the moving average
- Signals: green and red triangles with corresponding labels
📚 How to start using MFI Nexus Pro
1️⃣ Initial setup
- Add an indicator to your chart
- Select the type of moving average and the period (you can leave it as the default)
- Activate the desired signal types (MA, BB, Div)
2️⃣ Filter settings
- Set the distance between the signals to get rid of unnecessary noise
- Adjust the MFI and RSI levels depending on how volatile your asset is
- If you need more reliable signals, turn on the "Waiting for the opposite signal" mode.
3️⃣ Operation mode selection
- First, use the standard mode to see all possible signals.
- When you get comfortable, try the "And" mode for more reliable signals.
- For active trading, you can use the "OR" mode
4️⃣ Setting up Alerts
- Select the types of signals you want to be notified about
- Set up alerts for "AND" or "OR" modes if you use them
5️⃣ Verification and adaptation
- Check the operation of the indicator on historical data
- Adjust the parameters for a specific asset
- Adapt the settings to your trading style
🌟 Usage examples
For trend trading
- Use MA signals in the direction of the main trend
- Turn on the "Waiting for the opposite signal" mode
- Set stricter levels for filters
For trading in a sideways range
- Use BB signals to detect bounces from the range boundaries
- Use the MFI level filter to confirm overbought/oversold conditions
- Adjust the Bollinger bands according to the width of the range
To determine the pivot points
- Pay attention to the divergence signals
- Use the "And" mode by combining divergences with other signals
- Check the RSI filter for additional confirmation
AadTrend [InvestorUnknown]The AadTrend indicator is an experimental trading tool that combines a user-selected moving average with the Average Absolute Deviation (AAD) from this moving average. This combination works similarly to the Supertrend indicator but offers additional flexibility and insights. In addition to generating Long and Short signals, the AadTrend indicator identifies RISK-ON and RISK-OFF states for each trade direction, highlighting areas where taking on more risk may be considered.
Core Concepts and Features
Moving Average (User-Selected Type)
The indicator allows users to select from various types of moving averages to suit different trading styles and market conditions:
Simple Moving Average (SMA)
Exponential Moving Average (EMA)
Hull Moving Average (HMA)
Double Exponential Moving Average (DEMA)
Triple Exponential Moving Average (TEMA)
Relative Moving Average (RMA)
Fractal Adaptive Moving Average (FRAMA)
Average Absolute Deviation (AAD)
The Average Absolute Deviation measures the average distance between each data point and the mean, providing a robust estimation of volatility.
aad(series float src, simple int length, simple string avg_type) =>
avg = // Moving average as selected by the user
abs_deviations = math.abs(src - avg)
ta.sma(abs_deviations, length)
This provides a volatility measure that adapts to recent market conditions.
Combining Moving Average and AAD
The indicator creates upper and lower bands around the moving average using the AAD, similar to how the Supertrend indicator uses Average True Range (ATR) for its bands.
AadTrend(series float src, simple int length, simple float aad_mult, simple string avg_type) =>
// Calculate AAD (volatility measure)
aad_value = aad(src, length, avg_type)
// Calculate the AAD-based moving average by scaling the price data with AAD
avg = switch avg_type
"SMA" => ta.sma(src, length)
"EMA" => ta.ema(src, length)
"HMA" => ta.hma(src, length)
"DEMA" => ta.dema(src, length)
"TEMA" => ta.tema(src, length)
"RMA" => ta.rma(src, length)
"FRAMA" => ta.frama(src, length)
avg_p = avg + (aad_value * aad_mult)
avg_m = avg - (aad_value * aad_mult)
var direction = 0
if ta.crossover(src, avg_p)
direction := 1
else if ta.crossunder(src, avg_m)
direction := -1
A chart displaying the moving average with upper and lower AAD bands enveloping the price action.
Signals and Trade States
1. Long and Short Signals
Long Signal: Generated when the price crosses above the upper AAD band,
Short Signal: Generated when the price crosses below the lower AAD band.
2. RISK-ON and RISK-OFF States
These states provide additional insight into the strength of the current trend and potential opportunities for taking on more risk.
RISK-ON Long: When the price moves significantly above the upper AAD band after a Long signal.
RISK-OFF Long: When the price moves back below the upper AAD band, suggesting caution.
RISK-ON Short: When the price moves significantly below the lower AAD band after a Short signal.
RISK-OFF Short: When the price moves back above the lower AAD band.
Highlighted areas on the chart representing RISK-ON and RISK-OFF zones for both Long and Short positions.
A chart showing the filled areas corresponding to trend directions and RISK-ON zones
Backtesting and Performance Metrics
While the AadTrend indicator focuses on generating signals and highlighting risk areas, it can be integrated with backtesting frameworks to evaluate performance over historical data.
Integration with Backtest Library:
import InvestorUnknown/BacktestLibrary/1 as backtestlib
Customization and Calibration
1. Importance of Calibration
Default Settings Are Experimental: The default parameters are not optimized for any specific market condition or asset.
User Calibration: Traders should adjust the length, aad_mult, and avg_type parameters to align the indicator with their trading strategy and the characteristics of the asset being analyzed.
2. Factors to Consider
Market Volatility: Higher volatility may require adjustments to the aad_mult to avoid false signals.
Trading Style: Short-term traders might prefer faster-moving averages like EMA or HMA, while long-term traders might opt for SMA or FRAMA.
Alerts and Notifications
The AadTrend indicator includes built-in alert conditions to notify traders of significant market events:
Long and Short Alerts:
alertcondition(long_alert, "LONG (AadTrend)", "AadTrend flipped ⬆LONG⬆")
alertcondition(short_alert, "SHORT (AadTrend)", "AadTrend flipped ⬇Short⬇")
RISK-ON and RISK-OFF Alerts:
alertcondition(risk_on_long, "RISK-ON LONG (AadTrend)", "RISK-ON LONG (AadTrend)")
alertcondition(risk_off_long, "RISK-OFF LONG (AadTrend)", "RISK-OFF LONG (AadTrend)")
alertcondition(risk_on_short, "RISK-ON SHORT (AadTrend)", "RISK-ON SHORT (AadTrend)")
alertcondition(risk_off_short, "RISK-OFF SHORT (AadTrend)", "RISK-OFF SHORT (AadTrend)")
Important Notes and Disclaimer
Experimental Nature: The AadTrend indicator is experimental and should be used with caution.
No Guaranteed Performance: Past performance is not indicative of future results. Backtesting results may not reflect real trading conditions.
User Responsibility: Traders and investors should thoroughly test and calibrate the indicator settings before applying it to live trading.
Risk Management: Always use proper risk management techniques, including stop-loss orders and position sizing.

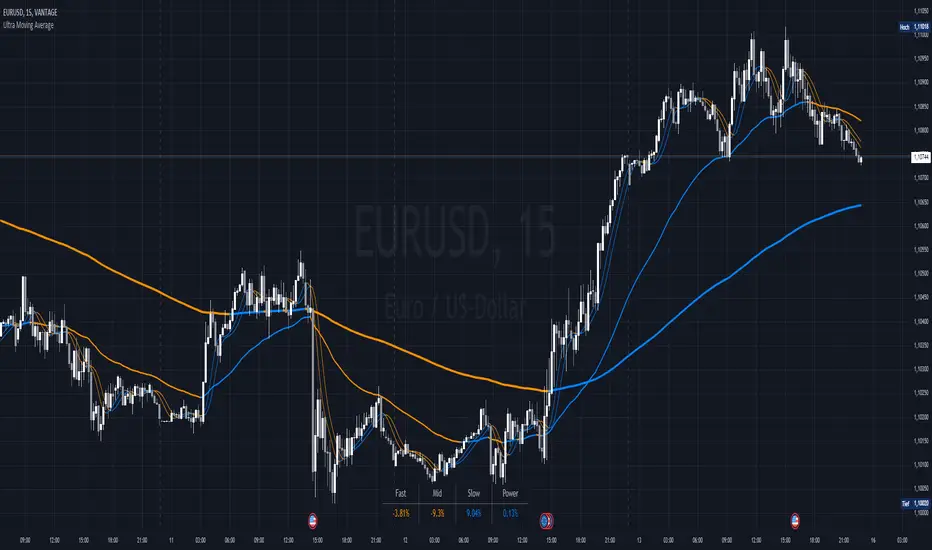
Ultra Moving AverageThe Ultra Moving Average is a versatile technical indicator that combines various types of moving averages to analyze trends, providing multi-timeframe insights for traders. It offers four customizable moving averages and a trend strength table for enhanced decision-making.
Introduction
The Ultra Moving Average indicator is a powerful tool designed to help traders track market trends by offering a combination of four distinct moving averages. With flexible customization options, users can apply different types of moving averages like SMA, EMA, TEMA, and many more, across various timeframes. Additionally, it provides trend strength analysis through an intuitive visual table, helping traders quickly identify market conditions.
Detailed Description
.........
Moving Averages
Each of the four moving averages is independently configurable. You can select the timeframe, type, length, color, and width to match your trading strategy.
The types of moving averages range from traditional ones like the Simple Moving Average (SMA) to advanced ones like the Double Expotential Moving Average (DEMA) or the Triple Exponential Moving Average (TEMA) or the Recursive Moving Average (RMA) or the Weigthend Moving Average (WMA) or the Volume Weigthend Moving Average (VWMA) or Hull Moving Average (HMA).
Very Special ones are the Triple Weigthend Moving Average (TWMA) wich created RedKTrader .
I created the Multi Weigthend Moving Average (MWMA) wich is a simple signal line to the TWMA.
.....
Trend Visualization
The indicator uses color-coding to visually represent whether the price is in an uptrend or downtrend. Bullish trends are highlighted in one color, while bearish trends appear in another, making it easy to interpret.
.....
Trend Strength Table
One of the unique features of the Ultra Moving Average is the trend strength table at the bottom of the chart. This table breaks down the strength of the fast, mid, and slow moving averages, displaying them as percentages. It also shows the overall "trend power," which helps assess how strong or weak the current trend is.
You have the option to calculate trends using live data or the previous bar's data, offering flexibility in how the indicator reacts to market changes. This can help traders make more responsive decisions based on real-time trends.
The table displays trend strength across three timeframes Fast, Mid, and Slow by calculating the percentage difference between the price and each of the moving averages (MA1, MA3, MA4).
The Power row shows the average of these percentages, representing overall trend strength.
The percentages are calculated relative to their maximum values in history (limited by TradingView subscription), providing insight into the trend's strength for each timeframe.
.........
Overall, the Ultra Moving Average indicator is a comprehensive tool that combines multiple moving average types and advanced trend analysis, helping traders identify market direction and strength at a glance. With its intuitive visualization and flexible settings, it's suited for both beginner and experienced traders.
Special Thanks
I use the TWMA-Function created from RedKTrader to smooth the values.
Special thanks to him for creating and sharing this function!
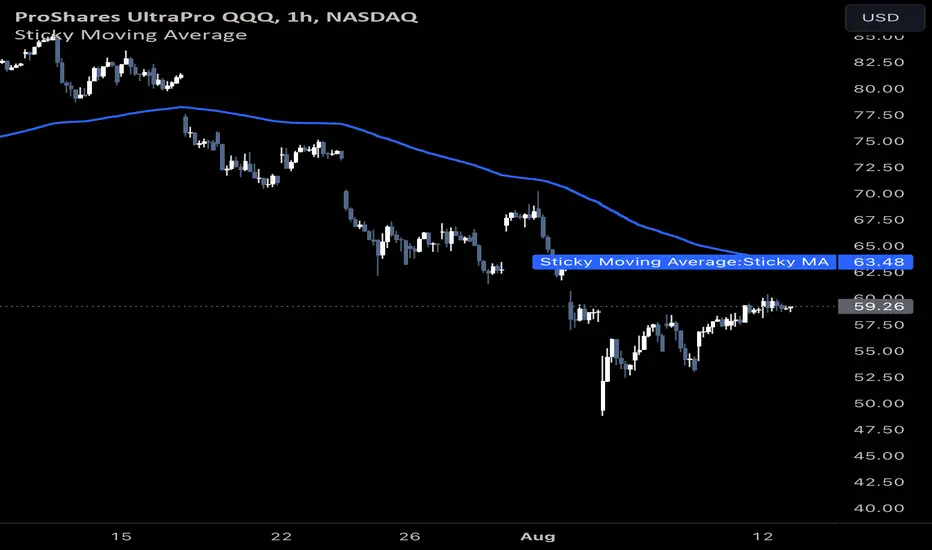
Sticky Moving AverageThe Sticky Moving Average is a custom indicator designed to provide a unique smoothing effect by combining different moving averages derived from a single base period. This indicator creates a single line on the chart, representing the average of the following three moving averages:
1. X-period Simple Moving Average (SMA): A traditional moving average that smooths the price data over the full period.
2. X/2-period Simple Moving Average (SMA): A faster-moving average that smooths the price data over half of the base period.
3. X/4-period Exponential Moving Average (EMA): An exponential moving average that gives more weight to recent prices, calculated over one-fourth of the base period.
The result is a moving average that "sticks" to price action by considering both short-term and long-term trends, offering a balanced view of market momentum.
This indicator is ideal for traders looking to gain a nuanced understanding of price movements by incorporating multiple smoothing periods into a single, easy-to-use line. Adjust the `X` value to suit your trading strategy and enjoy the clarity this composite moving average can bring to your charts.
slope-velocityDescription
This Pine Script indicator, named "slope-velocity," calculates and visualizes the slope of a moving average (MA) in degrees, allowing users to observe the rate of change of the MA over time. Here's a breakdown of its components and functionality:
Inputs:
option: A dropdown menu allowing the user to select the type of moving average (SMA, EMA, DEMA).
length: An integer input for specifying the period length of the moving average.
source: The data source for the moving average calculation, defaulting to the close price.
Variable Initialization:
ma: A variable to store the moving average value, initialized as na.
Moving Average Calculation:
Depending on the selected option, the script calculates the appropriate moving average:
ta.sma(source, length) for Simple Moving Average (SMA).
ta.ema(source, length) for Exponential Moving Average (EMA).
ta.dema(source, length) for Double Exponential Moving Average (DEMA).
Slope Calculation:
slope_ma: The script calculates the slope of the moving average by subtracting the previous period's MA value from the current period's MA value (ma - ma ).
Slope Conversion to Degrees:
slope_degrees_ma: The slope is converted to degrees using the math.atan function to compute the arctangent of the slope, followed by math.todegrees to convert the result from radians to degrees. The result is rounded to the nearest integer using math.round.
Plotting Reference Lines:
Horizontal lines are plotted at specific degree values (0, 10, 20, -10, -20) to provide reference points for the slope's visualization.
Plotting the Slope:
The slope in degrees is plotted as a histogram. The color of the histogram bars is determined by the sign of the slope: green for positive slopes and red for negative slopes.
Additional Comments
The script includes some commented-out sections related to plotting acceleration and displaying labels for slope differences, which are not active in the current implementation.
The script is designed to provide a visual representation of the moving average's rate of change, making it easier to identify periods of rapid price movement and potential trend reversals.

Normalised T3 Oscillator [BackQuant]Normalised T3 Oscillator
The Normalised T3 Oscillator is an technical indicator designed to provide traders with a refined measure of market momentum by normalizing the T3 Moving Average. This tool was developed to enhance trading decisions by smoothing price data and reducing market noise, allowing for clearer trend recognition and potential signal generation. Below is a detailed breakdown of the Normalised T3 Oscillator, its methodology, and its application in trading scenarios.
1. Conceptual Foundation and Definition of T3
The T3 Moving Average, originally proposed by Tim Tillson, is renowned for its smoothness and responsiveness, achieved through a combination of multiple Exponential Moving Averages and a volume factor. The Normalised T3 Oscillator extends this concept by normalizing these values to oscillate around a central zero line, which aids in highlighting overbought and oversold conditions.
2. Normalization Process
Normalization in this context refers to the adjustment of the T3 values to ensure that the oscillator provides a standard range of output. This is accomplished by calculating the lowest and highest values of the T3 over a user-defined period and scaling the output between -0.5 to +0.5. This process not only aids in standardizing the indicator across different securities and time frames but also enhances comparative analysis.
3. Integration of the Oscillator and Moving Average
A unique feature of the Normalised T3 Oscillator is the inclusion of a secondary smoothing mechanism via a moving average of the oscillator itself, selectable from various types such as SMA, EMA, and more. This moving average acts as a signal line, providing potential buy or sell triggers when the oscillator crosses this line, thus offering dual layers of analysis—momentum and trend confirmation.
4. Visualization and User Interaction
The indicator is designed with user interaction in mind, featuring customizable parameters such as the length of the T3, normalization period, and type of moving average used for signals. Additionally, the oscillator is plotted with a color-coded scheme that visually represents different strength levels of the market conditions, enhancing readability and quick decision-making.
5. Practical Applications and Strategy Integration
Traders can leverage the Normalised T3 Oscillator in various trading strategies, including trend following, counter-trend plays, and as a component of a broader trading system. It is particularly useful in identifying turning points in the market or confirming ongoing trends. The clear visualization and customizable nature of the oscillator facilitate its adaptation to different trading styles and market environments.
6. Advanced Features and Customization
Further enhancing its utility, the indicator includes options such as painting candles according to the trend, showing static levels for quick reference, and alerts for crossover and crossunder events, which can be integrated into automated trading systems. These features allow for a high degree of personalization, enabling traders to mold the tool according to their specific trading preferences and risk management requirements.
7. Theoretical Justification and Empirical Usage
The use of the T3 smoothing mechanism combined with normalization is theoretically sound, aiming to reduce lag and false signals often associated with traditional moving averages. The practical effectiveness of the Normalised T3 Oscillator should be validated through rigorous backtesting and adjustment of parameters to match historical market conditions and volatility.
8. Conclusion and Utility in Market Analysis
Overall, the Normalised T3 Oscillator by BackQuant stands as a sophisticated tool for market analysis, providing traders with a dynamic and adaptable approach to gauging market momentum. Its development is rooted in the understanding of technical nuances and the demand for a more stable, responsive, and customizable trading indicator.
Thus following all of the key points here are some sample backtests on the 1D Chart
Disclaimer: Backtests are based off past results, and are not indicative of the future.
INDEX:BTCUSD
INDEX:ETHUSD
BINANCE:SOLUSD

hamster-bot MRS 2 (simplified version) MRS - Mean Reversion Strategy (Countertrend) (Envelope strategy)
This script does not claim to be unique and does not mislead anyone. Even the unattractive backtest result is attached. The source code is open. The idea has been described many times in various sources. But at the same time, their collection in one place provides unique opportunities.
Published by popular demand and for ease of use. so that users can track the development of the script and can offer their ideas in the comments. Otherwise, you have to communicate in several telegram chats.
Representative of the family of counter-trend strategies. The basis of the strategy is Mean reversion . You can also read about the Envelope strategy .
Mean reversion , or reversion to the mean, is a theory used in finance that suggests that asset price volatility and historical returns eventually will revert to the long-run mean or average level of the entire dataset.
The strategy is very simple. Has very few settings. Good for beginners to get acquainted with algorithmic trading. A simple adjustment will help avoid overfitting. There are many variations of this strategy, but for understanding it is better to start with this implementation.
Principle of operation.
1)
A conventional MA is being built. (fuchsia line). A limit order is placed on this line to close the position.
2)
(green line) A limit order is placed on this line to open a long position
3)
(red line) A limit order is placed on this line to open a short position
Attention!
Please note that a limit order is used. Conclude that the strategy has a limited capacity. And the results obtained on low-liquid instruments will be too high in the tester. On real auctions there will be a different result.
Note for testing the strategy in the spot market:
When testing in the spot market, do not include both long and short at the same time. It is recommended to test only the long mode on the spot. Short mode for more advanced users.
Settings:
Available types of moving averages:
SMA
EMA
TEMA - triple exponential moving average
DEMA - Double Exponential Moving Average
ZLEMA - Zero lag exponential moving average
WMA - weighted moving average
Hma - Hull Moving Average
Thma - Triple Exponential Hull Moving Average
Ehma - Exponential Hull Moving Average
H - MA built based on highs for n candles | ta.highest(len)
L - MA built based on lows for n candles | ta.lowest(len)
DMA - Donchian Moving Average
A Kalman filter can be applied to all MA
The peculiarity of the strategy is a large selection of MA and the possibility of shifting lines. You can set up a reverse trending strategy on the Donchian channel for example.
Use Long - enable/disable opening a Long position
Use Short - enable/disable opening a Short position
Lot Long, % - % allocated from the deposit for opening a Long position. In the spot market, do not use % greater than 100%
Lot Short, % - allocated % of the deposit for opening a Short position
Start date - the beginning of the testing period
End date - the end of the testing period (Example: only August 2020 can be tested)
Mul - multiplier. Used to offset lines. Example:
Mul = 0.99 is shift -1%
Mul = 1.01 is shift +1%
Non-strict recommendations:
1) Test the SPOT market on crypto exchanges. (The countertrend strategy has liquidation risk on futures)
2) Symbols altcoin/bitcoin or altcoin/altcoin. Example: ETH/BTC or DOGE/ETH
3) Timeframe is usually 1 hour
If the script passes moderation, I will supplement it by adding separate settings for closing long and short positions according to their MA

Weighted Oscillator Convergence DivergenceThe Weighted Oscillator Convergence Divergence (WOCD) aims to help traders identify potential trend reversals or momentum shifts in financial markets by calculating and visualizing the difference between a smoothed oscillator (WMA) value and its exponential moving average (EMA) and simple moving average (SMA) counterparts. This indicator is particularly useful for traders who want an alternative perspective on price momentum and divergence.
Key Features:
Inputs:
Length: The user can specify the number of bars to consider for calculations (default is 9).
Smoothing 1: Defines the smoothing factor for the first smoothed value (default is 5).
Smoothing 2: Specifies the smoothing factor for the second smoothed value (default is 7).
Ma Type: There are three types of moving averages you can choose (Wilder, non-lag, Weighted is by default).
Color Settings: Users can customize the indicator's colors for various elements, such as length, smoothing values, and different sections of the histogram.
Calculation:
WOCD calculates the raw oscillator value by subtracting the close price from a 3-period High, Low, Close (HLC3) moving average.
It then applies smoothing to this raw oscillator value using two different methods: exponential moving average (EMA) and simple moving average (SMA) with user-defined smoothing periods.
Histogram Plot:
The indicator plots a histogram based on the difference between the smoothed oscillator and the first smoothed value.
When the histogram is above zero and rising, it is colored according to the "Above Grow" color setting. When it's above zero and falling, it uses the "Fall" color for visualization.
Similarly, when the histogram is below zero and rising, it is colored according to the "Below Grow" color setting, and when it's below zero and falling, it uses the "Fall" color.
Oscillator and Smoothed Values:
The indicator also plots the smoothed oscillator, smoothed value 1 (EMA-based), and smoothed value 2 (SMA-based) on the chart.
Zero Line:
A horizontal line at zero is drawn on the chart for reference.
How to Use the WOCD Indicator:
Trend Identification: Observe the histogram's direction and color. A rising histogram above zero may indicate bullish momentum, while a falling histogram below zero could signal bearish momentum.
Divergence: Look for divergences between price action and the histogram. When the histogram and price move in opposite directions, it can be a potential reversal signal.
Crossovers: Pay attention to crossovers between the smoothed oscillator and its smoothed counterparts (EMA and SMA). These crossovers can indicate changes in trend strength or direction.
Zero Line: The zero line can act as a reference point. Positive histogram values suggest bullish sentiment, while negative values indicate bearish sentiment.
Comparison to MACD Indicator:
The WOCD indicator shares some similarities with the Moving Average Convergence Divergence (MACD) indicator but also has distinct differences:
Similarities:
Both WOCD and MACD are momentum oscillators designed to identify potential trend reversals and divergences.
They use moving averages (EMA in the case of MACD) to smooth the raw oscillator values.
Both indicators provide histogram representations of the difference between the oscillator and its smoothed counterpart.
Differences:
WOCD uses a 3-period High, Low, Close (HLC3) moving average to calculate the raw oscillator value, whereas MACD uses the difference between two exponential moving averages (usually 12-period and 26-period EMAs).
The smoothing in WOCD employs both EMA and SMA, while MACD exclusively uses EMA.
WOCD allows users to customize colors for various elements, enhancing visual clarity.

Multiple Moving Average ToolkitFeatures Overview:
Multiple Moving Averages: The script allows you to plot up to five different Moving Averages (MAs) on your chart at the same time. You can choose the type of MA (EMA, SMA, HMA, WMA, DEMA, VWMA, VWAP) and the length of each one.
Color Ribbon: You can turn the MAs into a color ribbon by selecting the "Turn into Color Ribbon?" option. This will make the area between the MAs colored and can help you identify trends more easily.
MA Value Table: You can draw a table on your chart that displays the current values of each MA, whether the trend is bullish or bearish along with the length of the MAs. The current ATR value is also shown in the last cell of the table. You can choose the location of the table (Top Left, Top Right, Bottom Left, Bottom Right) and the transparency of the background color.
Crosses: The script can detect when two MAs cross over each other (1st MA crosses 5th MA and vice versa), indicating a potential trend reversal. It will plot crosses on the chart at the point of the crossover and give an alert if the "Bullish Cross Detected" or "Bearish Cross Detected" condition is met.
How to use:
Once the script is added to your chart, you can customize the settings to fit your preferences. You can choose the type and length of each MA, whether to turn them into a color ribbon, whether to plot crosses, and whether to draw the MA Value Table.
The MA Value Table can be moved to a different location on the chart by selecting the "Location of Table" option and choosing Top Left, Top Right, Bottom Left, or Bottom Right.
Watch for MA crossovers and alerts to identify potential trend reversals. The script can help you identify bullish and bearish trends by color-coding the area between the MAs and displaying the current values of each MA in the table.
Breakdown of the script:
User Inputs
The first section of the script defines several user inputs that allows you to customize the indicator. These include options for turning the MAs into a color ribbon, plotting crosses when there is a bullish or bearish cross of the MAs, drawing a table of the MA values, and setting the transparency of the ribbon. You can also select the location of the MA value table and customize the settings for each individual MA.
Moving Average Calculation
The script defines a function called "getMA" that calculates the moving average for a given type and length. The function uses a switch statement to determine which type of moving average to use, such as an exponential moving average (EMA), simple moving average (SMA), Hull moving average (HMA), weighted moving average (WMA), double exponential moving average (DEMA), volume-weighted moving average (VWMA), or volume-weighted average price (VWAP).
The script then calls this function to calculate the values of up to five different MAs, depending on the user input. The ATR (average true range) is also calculated using the TA library.
Color Filter and Cross Detection
The script sets a color filter based on the relationship between the MAs. If the shorter-term MAs are above the longer-term MAs, the filter is set to green to indicate a bullish trend, and if the shorter-term MAs are below the longer-term MAs, the filter is set to red to indicate a bearish trend. You can adjust the transparency of the ribbon to make it more or less visible.
The script also detects when there is a bullish or bearish cross of the MAs and can generate alerts to notify you.
MA Plotting
The script plots up to five MAs on the chart, depending on the user input. The MAs are plotted as lines with different colors and thicknesses, and you can choose to turn them into a color ribbon if desired.
Cross Plotting
The script plots crosses on the chart when there is a bullish or bearish cross of the MAs. The crosses are plotted as X shapes at the location of the cross and are color-coded to indicate the direction of the cross.
MA Value Table
Finally, the script draws a table of the MA values on the chart, displaying the values of each MA as well as the current trend and the ATR. You can customize the location of the table, and the table is colored to match the color filter of the MAs.
Feel free to message me or comment on the post with any questions or issues!
Much more to come!
Thanks for reading, enjoy!

[E5 Trading] Moving AveragesMoving Averages
Plot up to 12 moving averages and customize colors directly on the inputs tab.
Select from any of one of eight (8) moving averages types from the drop-down menu including 'EMA', 'HMA', 'LINREG', 'SWMA', 'SINE', 'SMA', 'VWMA', and 'WMA'.
Default 'SMA' for Plots 1 through 6, and default 'EMA' for plots 7 through 12.
Use this indicator to quickly transition between your favorite moving average combinations.
This indicator can also be used to create the Guppy Multiple Moving Average: www.investopedia.com
Definitions
'EMA' = Exponential Moving Average
'HMA' = Hull Moving Average
'LINREG' = Linear Regression Curve
'SWMA' = Symmetrically Weighted Moving Average
'SINE' = Sine Weighted Moving Average
'SMA' = Simple Moving Average
'VWMA' = Volume Weighted Moving Average
'WMA' = Weighted Moving Average

GT 5.1 Strategy═════════════════════════════════════════════════════════════════════════
█ OVERVIEW
People often look an indicator in their technical analysis to enter a position. We may also need to look at the signals of one or more indicators to verify the signals given by some indicators. In this context, I developed a strategy to test whether it really works by choosing some of the indicators that capture trend changes with the same characteristics. Also, since the subject is to catch the trend change, I thought it would be right to include an indicator using the heikin ashi logic. By averaging and smoothing the market noise, Heiken Ashi makes it easier to detect the direction of the trend helps to see possible reversal points on the chart. However, it should be noted that Heiken Ashi is a lagging indicator.
I picked 5 different indicators (but their purpose are similar) and combined them to produce buy and sell signals based on your choice(not repaint). First of all let's get some information about our indicators. So you will understand me why i picked these indicators and what is the meaning of their signals.
1 — Coral Trend Indicator by LazyBear
Coral Trend Indicator is a linear combination of moving averages, all obtained by a triple or higher order exponential smoothing. The indicator comes with a trend indication which is based on the normalized slope of the plot. the usage of this indicator is simple. When the color of the line is green that means the market is in uptrend. But when the color is red that means the market is in downtrend.
As you see the original indicator it is simple to find is it in uptrend or downtrend.
So i added a code to find when the color of the line change. When it turns green to red my script giving sell signals, when it turns red to green it gives buy signals.
I hide the candles to show you more clearly what is happening when you choose only Coral Strategy. But sometimes it is not enough only using itself. Even if green dots turn to red it continues in uptrend. So we need a to look another indicator to approve our signal.
2 — SSL channel by ErwinBeckers
Known as the SSL , the Semaphore Signal Level channel is an indicator that combines moving averages to provide you with a clear visual signal of price movement dynamics. In short, it's designed to show you when a price trend is forming. This indicator creates a band by calculating the high and low values according to the determined period. Simply if you decide 10 as period, it calculates a 10-period moving average on the latest 10 highs. Calculate a 10-period moving average on the latest 10 lows. If the price falls below the low band, the downtrend begins, if the price closes above the high band, the uptrend begins. Lets look the original form of indicator and learn how it using.
If the red line is below and the green band is above, it means that we are in uptrend, and if it is on the opposite side, it means that we are in downtrend. Therefore, it would be logical to enter a position where the trend has changed. So i added a code to find when the crossover has occured.
As you see in my strategy, it gives you signals when the trend has changed. But sometimes it is not enough only using this indicator itself. So lets look 2 indicator together in one chart.
Look circle SSL is saying it is in downtrend but Coral is saying it has entered in uptrend. if we just look to coral signal it can misleads us. So it can be better to look another indicator for validating our signals.
3 — Heikin Ashi RSI Oscillator by JayRogers
The Heikin-Ashi technique is used by technical traders to identify a given trend more easily. Heikin-Ashi has a smoother look because it is essentially taking an average of the movement. There is a tendency with Heikin-Ashi for the candles to stay red during a downtrend and green during an uptrend, whereas normal candlesticks alternate color even if the price is moving dominantly in one direction. This indicator actually recalculates the RSI indicator with the logic of heikin ashi. Due to smoothing, the bars are formed with a slight lag, reflecting the trend rather than the exact price movement. So lets look the original version to understand more clearly. If red bars turn to green bars it means uptrend may begin, if green bars turn to red it means downtrend may begin.
As you see HARSI giving lots of signal some of them is really good but some of them are not very well. Because it gives so much signals Now i will change time period and lets look same chart again.
Now results are better because of heikin ashi's logic. it is not suitable for day traders, it gives more accurate result when using the time period is longer. But it can be useful to use this indicator in short time periods using with other indicators. So you may catch the trend changes more accurately.
4 — MACD DEMA by ToFFF
This indicator uses a double EMA and MACD algorithm to analyze the direction of the trend. Though it might seem a tough task to manage the trades with the help of MACD DEMA once you know how the proper way to interpret the signal lines, it will be an easy task.
This indicator also smoothens the signal lines with the time series algorithm which eventually makes the higher time frame important. So, expecting better results in the lower time frame can result in big losses as the data reading from the MACD DEMA will not be accurate. In order to understand the function of this indicator, you have to know the functions of the EMA also.
The exponential moving average tends to give more priority to the recent price changes. So, expecting better results when the volatility is very high is a very risky approach to trade the market. Moreover, the MACD has some lagging issues compared to the EMA, so it is super important to use a trading method that focuses on the higher time frame only. What does MACD 12 26 Close 9 mean? When the DEMA-9 crosses above the MACD(12,26), this is considered a bearish signal. It means the trend in the stock – its magnitude and/or momentum – is starting to shift course. When the MACD(12,26) crosses above the DEMA-9, this is considered a bullish signal. Lets see this indicator on Chart.
When the blue line crossover red line it is good time to buy. As you see from the chart i put arrows where the crossover are appeared.
When the red line crossover blue line it is good time to sell or exit from position.
5 — WaveTrend Oscillator by LazyBear
This is a technical indicator that creates high and low bands between two values. It then creates a trend indicator that draws waves with highs and lows within these boundaries. WaveTrend is a widely used indicator for finding direction of an asset.
Calculation period: number of candles used to calculate WaveTrend, defaults to 10. Averaging period: number of candles used to average WaveTrend, defaults to 21.
As you see in chart when the lines crossover occured my strategy gives buy or sell signals.
═════════════════════════════════════════════════════════════════════════
█ HOW TO USE
I hope you understand how the indicators I mentioned above work and what they are used for. Now, I will explain in detail how to use the strategy I have created.
When you enter the settings section, you will see 5 types of indicators. If you want to use the signals of the indicators, simply tick the box next to the indicators. Also, under each option there is an area where you can set the "lookback". This setting is a field that will make the signals overlap when you select more than one option. If you are going to trade with only one option, you should make sure that this field is 0. Otherwise, it may continue to generate as many signals as you choose.
Lets see in chart for easy understanding.
As you see chart, if i chose only HARSI with lookback 0 (HARSI and CORAL should be 1 minumum because of algorithm-we looking 1 bar before, others 0 because we are looking crossovers), it will give signals only when harsı bar's color changed. But when i changed Lookback as 7 it will be like this in chart.
Now i will choose 2 indicator with settings of their lookback 0.
As you see it will give signals when both of them occurs same time. But HARSI is an indicator giving very early signal so we can enter position 5-6 bars after the first bar color change. So i will change HARSI Lookback settings as 7. Lets look what happens when we use lookback option.
So it wil be useful to change lookback settings to find best signals in each time period and in each symbol. But it shouldnt be too high. Because you can be late to catch trend's starting.
this is an image of MACD and WAVE trend used and lookback option are both 6.
Now lets see an example with 3 options are chosen with lookback option 11-1-5
Now lets talk about indicators settings. After strategy options you will see each indicators settings, you can change their settings as you desired. So each indicators signal will be changed according to your adjustment.
I left strategy options with default settings. You can change it manually as if you want.
═════════════════════════════════════════════════════════════════════════
█ LIMITATIONS: Don't rely on non-standard charts results. For example Heikin Ashi is a technical analysis method used with the traditional candlestick chart.Heikin Ashi vs. Candlestick Chart: The decisive visual difference between Heikin Ashi and the traditional chart is that Heikin Ashi flattens the traditional candlestick chart using a modified formula.
The primary advantage of Heikin Ashi is that it makes the chart more reader-friendly and helps users identify and analyze trends .
Because Heikin Ashi provides averaged price information rather than real-time price and reacts slowly to volatility — not suitable for scalpers and high-frequency traders. I added HARSI indicator as a supportive signal because it is useful with using CORAL and SSL channel indicators. If you change your candle types to Heikin Ashi , your profit will change in good way but dont rely on it.
═════════════════════════════════════════════════════════════════════════
█ THANKS:
Special thanks to authors of the scripts that i used.
@LazyBear and @ErwinBeckers and @JayRogers and @ToFFF
═════════════════════════════════════════════════════════════════════════
█ DISCLAIMER
Any trade decisions you make are entirely your own responsibility.

Combo 2/20 EMA & Bill Williams Averages. 3Lines This is combo strategies for get a cumulative signal.
First strategy
This indicator plots 2/20 exponential moving average. For the Mov
Avg X 2/20 Indicator, the EMA bar will be painted when the Alert criteria is met.
Second strategy
This indicator calculates 3 Moving Averages for default values of
13, 8 and 5 days, with displacement 8, 5 and 3 days: Median Price (High+Low/2).
The most popular method of interpreting a moving average is to compare
the relationship between a moving average of the security's price with
the security's price itself (or between several moving averages).
WARNING:
- For purpose educate only
- This script to change bars colors.
