Moving Average Directional IndexMADX is ADX-inspired indicator with moving averages that determines strength of a trend, as well as its direction. Indicator works following:
As the value of MADX increases, so does the strength of a trend
If MADX+ ( green line - bullish MADX ) crosses above MADX- ( red line - bearish MADX ) we consider trend as bullish and vice versa..
There will be situations where MADX- and MADX+ cross multiple times in a short period of time -> that will mean that market indecision is happening and big move will most likely happen after it.
For the calculation of MADX+ and MADX- we need Moving Averages or Exponential Moving Averages with three specific sources ( high, close, low ).
Now, the calculation of each MADX will differ
=> for MADX+: Moving Average (high) / Moving Average (close)
=> for MADX-: Moving Average (close) / Moving Average (low)
Length of Moving Average is editable.
Cerca negli script per "Exponential Moving Average"

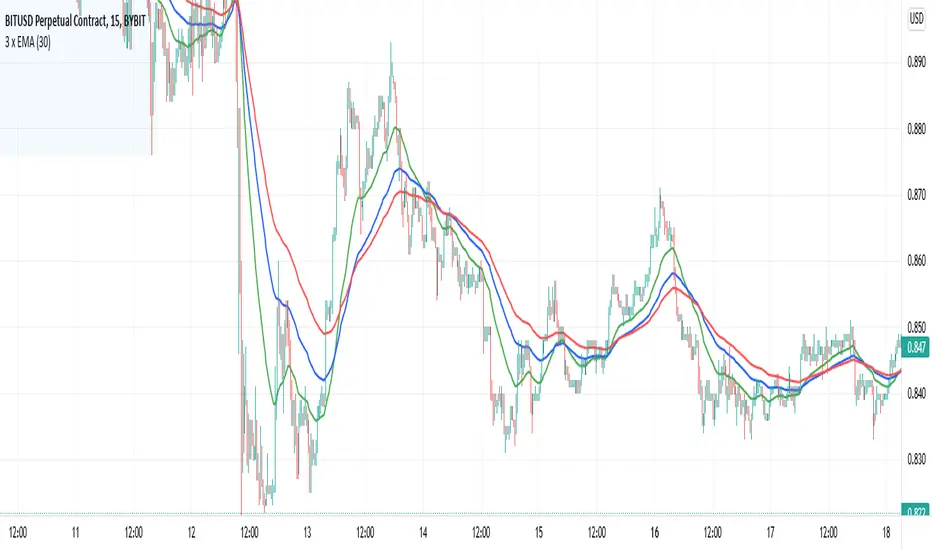
3 x EMAExponential Moving Averages
The indicator plots three moving averages.
The settings specify the period for the first moving average.
The period for the second moving average is considered as the period for the first one multiplied by 2.
The period for the third moving average is considered as the period for the first one multiplied by 3.
MA with a short period - green
MA with an average period - blue
MA with a long period - red
Экспоненциальные скользящие средние
Индикатор строит три скользящие средние.
В настройках указывается период для первой скользящей средней.
Период для второй скользящей считается как период для первой умноженной на 2.
Период для третьей скользящей считается как период для первой умноженной на 3.
Скользящая с коротким периодом - зеленая
Скользящая со средним периодом - синяя
Скользящая с длинным периодом - красная
Stop Loss With Average True Range (ATR)Stop Loss With Average True Range (ATR)
It simplifies the calculation of stop loss price for stop loss method using the average true range (ATR).
For example;
You want to stop loss below 3 ATR. Let's assume the price is 100, the average true range is 5. You will multiply the average true range by 3 and subtract from the price and enter a stop loss order at the 85 price you have reached. Instead of doing this calculation every time, you just need to use this script and set the multiplier to 3. A stop loss line will be drawn below the price candles.
You can set the method to be used when averaging the true range. Methods you can use to average: EMA (exponentially moving average), HMA (hull moving average), RMA (moving average used in RSI), SMA (simple moving average), SWMA (symmetrically weighted moving average), VWMA (volume-weighted moving average), WMA (weighted moving average).
You can set the length to be used when averaging the true range.
You can set the multiplier to be used when determining the stop loss price.
Turkish
Ortalama Gerçek Aralıkla (ATR) Zarar Durdurma
Gerçek aralığın ortalamasını kullanarak zarar durdurma yöntemi için zarar durdurma fiyatının hesaplanmasını kolaylaştırır.
Örneğin;
3 ATR kadar aşağıda zarar durdurmak istiyorsunuz. Fiyatın 100, ortalama gerçek aralığın 5 olduğunu varsayalım. Ortalama gerçek aralığı 3 ile çarparak fiyattan çıkaracaksınız ve ulaştığınız 85 fiyatına zarar durdurma emri gireceksiniz. Bu hesabı her seferinde yapmak yerine bu betiği kullanmanız ve çarpanı 3 olarak ayarlamanız yeterli. Bu sayede fiyat mumlarının altına zarar durdurma çizgisi çizilecektir.
Gerçek aralığın ortalaması alınırken kullanılacak yöntemi ayarlayabilirsiniz. Ortalama almak için seçebileceğiniz yöntemler: EMA (üstel hareketli ortalama), HMA (gövde hareketli ortalama), RMA (göreceli hareketli ortalama), SMA (basit hareketli ortalama), SWMA (simetrik ağırlıklı hareketli ortalama), VWMA (hacim ağırıklı hareketli ortalama), WMA (ağırlıklı hareketli ortalama).
Gerçek aralığın ortalaması alınırken kullanılacak periyot uzunluğunu ayarlayabilirsiniz.
Zarar durdurma fiyatını belirlerken kullanılacak çarpanı ayarlayabilirsiniz.

MACD ReLoaded STRATEGYSTRATEGY version of MACD ReLOADED Indicator:
A different approach to Gerald Appel's classical Moving Average Convergence Divergence.
Appel originaly set MACD with exponential moving averages.
In this version users can apply 11 different types of moving averages which they can benefit from their smoothness and vice versa sharpnesses...
Built in Moving Average type defaultly set as VAR but users can choose from 11 different Moving Average types like:
SMA : Simple Moving Average
EMA : Exponential Moving Average
WMA : Weighted Moving Average
DEMA : Double Exponential Moving Average
TMA : Triangular Moving Average
VAR : Variable Index Dynamic Moving Average a.k.a. VIDYA
WWMA : Welles Wilder's Moving Average
ZLEMA : Zero Lag Exponential Moving Average
TSF : True Strength Force
HULL : Hull Moving Average
TILL : Tillson T3 Moving Average
In shorter time frames backtest results shows us TILL, WWMA, VIDYA (VAR) could be used to overcome whipsaws because they have less numbers of signals.
In longer time frames like daily charts WMA, Volume Weighted MACD V2, and MACDAS and SMA are more accurate according to backtest results.
My interpretation of Buff Dormeier's Volume Weighted MACD V2:
Thomas Aspray's MACD: (MACDAS)

MACD ReLoadedA different approach to Gerald Appel's classical Moving Average Convergence Divergence.
Appel originaly set MACD with exponential moving averages.
In this version users can apply 11 different types of moving averages which they can benefit from their smoothness and vice versa sharpnesses...
Built in Moving Average type defaultly set as VAR but users can choose from 11 different Moving Average types like:
SMA : Simple Moving Average
EMA : Exponential Moving Average
WMA : Weighted Moving Average
DEMA : Double Exponential Moving Average
TMA : Triangular Moving Average
VAR : Variable Index Dynamic Moving Average a.k.a. VIDYA
WWMA : Welles Wilder's Moving Average
ZLEMA : Zero Lag Exponential Moving Average
TSF : True Strength Force
HULL : Hull Moving Average
TILL : Tillson T3 Moving Average
In shorter time frames backtest results shows us TILL, WWMA, VIDYA (VAR) could be used to overcome whipsaws because they have less numbers of signals.
In longer time frames like daily charts WMA, Volume Weighted MACD V2, and MACDAS and SMA are more accurate according to backtest results.
My interpretation of Buff Dormeier's Volume Weighted MACD V2:
Thomas Aspray's MACD: (MACDAS)

[blackcat] L1 Tim Tillson T3Level: 1
Background
T3 Moving Average is the responsive form of traditional moving averages. Presented in 1998 by Tim Tillson, T3 is also known as the Tillson Moving Averages. The thought behind the development of this technical indicator was to improve lag and false signals, which can be present in moving averages.
Function
The T3 indicator performs better than the ordinary moving averages. The reason for this is T3 Moving Average is built with the EMA (exponential moving average).
Its calculation is based on the sum of single EMA, double EMA, Triple EMA, and so on.
This gives the following equation:
T3 = c1*e6 + c2*e5 + c3*e4 + c4*e3…
Where
e3 = EMA (e2, Period)
e4 = EMA (e3, Period)
e5 = EMA (e4, Period)
e6 = EMA (e5, Period)
a is the volume factor, with a default value of 0.7 but you can also use 0.618
c1 = a^3
c2 = 3*a^2 + 3*a^3
c3 =6*a^2 – 3*a – 3*a^3
c4 = 1 + 3*a + a^3 + 3*a^2
When a trend appears, the price action stays above or below the trend line and doesn’t get disturbed from the price swing. The moving of the T3 and the lack of reversals can indicate the end of the trend. The T3 Moving Average produces signals just like moving averages, and similar trading conditions can be applied. If the price is above the T3 Moving Average and the indicator moves upward, this is a sign of a bullish trend. Here we may look to enter long. Conversely, if the price action is below the T3 Moving Average and the indicator moves downwards, a bearish trend appears. Here we may want to look for a short entry.
Key Signal
Price --> Price Input.
T3 --> T3 Ouput.
Remarks
This is a Level 1 free and open source indicator.
Feedbacks are appreciated.

Daily and Weekly Moving Averages on Daily ChartFor the long term trend I use the 200 and 150 daily moving averages. The 200-day MA will be plotted as a black line. It is a no-go zone to buy anything trading below that.
The 150-day, or 30-week like Stan Weinstein uses, is plotted in orange.
Than I use the 50 day moving average but also the 10 week moving average. While those look similar there is a small difference which sometimes impacts the choice for selling a stock or holding on to it.
That slight difference is useful in different situations that’s why I want to have them both on my chart.
Both the 50-day and the 10-week are plotted as red lines on the chart. Since there’s only a small difference the same color gives a nicer view.
For shorter term trend I like to use the 20 and 10 day exponential moving averages. I tested these but also the commonly used 21, 9 and some other variations. But came to the conclusion that for me the 20EMA and 10EMA works best.
Both EMA’s are plotted in blue, where the 20EMA has a thicker line to easily see the difference.
Crypto EMA+MA+MACS by hobbeLeThis is an indicator that includes several EMAs and MAs (Used in Cryptotrading).
In addition, the Golden and Death Cross are also displayed.
Used MAs
MA 7 - Orange Line
MA 21 - Yellow Line
MA 25 - Grey Line
MA 99 - Blue Line
MA 200 - Green Line
Used EMAs
EMA 200 - Grey Dotted Line
EMA 222 - Pink Dotted Line
Golden Cross
Crossover MA25 + MA200
Death Cross
Crossunder MA25 + MA200
What is a Moving Average (MA) ?
A moving average (MA) is a widely used indicator in technical analysis that helps smooth out price action by filtering out the “noise” from random short-term price fluctuations.
Moving average is a trend-following, or lagging, indicator because it is based on past prices. The most common applications of moving averages are:
to identify the trend direction
to determine support and resistance levels
The two basic and commonly used moving averages are the simple moving average ( SMA ), which is the arithmetic average of a security over a defined number of time periods, and the exponential moving average ( EMA ), which gives greater weight to more recent prices.
What is a Golden Cross?
The golden cross is a candlestick pattern that is a bullish signal in which a relatively short-term moving average crosses above a long-term moving average. The golden cross is a bullish breakout pattern formed from a crossover involving a security's short-term moving average (such as the 15-day moving average) breaking above its long-term moving average (such as the 50-day moving average) or resistance level. As long-term indicators carry more weight, the golden cross indicates a bull market on the horizon and is reinforced by high trading volumes.
What Is a Death Cross?
The death cross is a technical chart pattern indicating the potential for a major selloff. The death cross appears on a chart when a stock’s short-term moving average crosses below its long-term moving average.
Source; Investopedia

CM_Ultimate_MA_MTF_v7 IndicatorUpgraded CM_Ultimate_MA_MTF_V2 - Added Tilson T3
Defaults to Current Timeframe on Chart.
Ability to Plot 2nd Moving Average.
Ability to set Moving Averages to Custom Chart TimeFrame. Example Daily Ma on 60 Minute chart. Many Different Options from Weekly to 1 Minute.
Ability to Plot Cross where Moving Averages Cross (If using 2nd Moving Average).
Ability to Plot Highlight Bars when Price Crosses 1st Moving Average, or 2nd MA.
Moving Averages Supported in Inputs Tab
SMA - Simple Moving Average
EMA - Exponential Moving Average
WMA - Weighted Moving Average
HullMA - Hull Moving Average
VWMA - Volume Weighted Moving Average
RMA - Moving Average used in RSI - Similar to EMA
TEMA - Triple Exponential Moving Average
Tilson T3 - Tilson T3 Moving Average

CM_Ultimate_MA_MTF_V2 strategyUpgraded CM_Ultimate_MA_MTF_V2 - Added Tilson T3
Defaults to Current Timeframe on Chart.
Ability to Plot 2nd Moving Average.
Ability to set Moving Averages to Custom Chart TimeFrame. Example Daily Ma on 60 Minute chart. Many Different Options from Weekly to 1 Minute.
Ability to Plot Cross where Moving Averages Cross (If using 2nd Moving Average).
Ability to Plot Highlight Bars when Price Crosses 1st Moving Average, or 2nd MA.
Moving Averages Supported in Inputs Tab
SMA - Simple Moving Average
EMA - Exponential Moving Average
WMA - Weighted Moving Average
HullMA - Hull Moving Average
VWMA - Volume Weighted Moving Average
RMA - Moving Average used in RSI - Similar to EMA
TEMA - Triple Exponential Moving Average
Tilson T3 - Tilson T3 Moving Average

Acc/Dist. Cloud with Fractal Deviation Bands by @XeL_ArjonaACCUMULATION / DISTRIBUTION CLOUD with MORPHIC DEVIATION BANDS
Ver. 2.0.beta.23:08:2015
by Ricardo M. Arjona @XeL_Arjona
DISCLAIMER
The Following indicator/code IS NOT intended to be a formal investment advice or recommendation by the author, nor should be construed as such. Users will be fully responsible by their use regarding their own trading vehicles/assets.
The embedded code and ideas within this work are FREELY AND PUBLICLY available on the Web for NON LUCRATIVE ACTIVITIES and must remain as is.
Pine Script code MOD's and adaptations by @XeL_Arjona with special mention in regard of:
Buy (Bull) and Sell (Bear) "Power Balance Algorithm by Vadim Gimelfarb published at Stocks & Commodities V. 21:10 (68-72).
Custom Weighting Coefficient for Exponential Moving Average (nEMA) adaptation work by @XeL_Arjona with contribution help from @RicardoSantos at TradingView @pinescript chat room.
Morphic Numbers (PHI & Plastic) Pine Script adaptation from it's algebraic generation formulas by @XeL_Arjona
Fractal Deviation Bands idea by @XeL_Arjona
CHANGE LOG:
ACCUMULATION / DISTRIBUTION CLOUD: I decided to change it's name from the Buy to Sell Pressure. The code is essentially the same as older versions and they are the center core (VORTEX?) of all derived New stuff which are:
MORPHIC NUMBERS: The "Golden Ratio" expressed by the result of the constant "PHI" and the newer and same in characteristics "Plastic Number" expressed as "PN". For more information about this regard take a look at: HERE!
CUSTOM(K) EXPONENTIAL MOVING AVERAGE: Some code has cleaned from last version to include as custom function the nEMA , which use an additional input (K) to customise the way the "exponentially" is weighted from the custom array. For the purpose of this indicator, I implement a volatility algorithm using the Average True Range of last 9 periods multiplied by the morphic number used in the fractal study. (Golden Ratio as default) The result is very similar in response to classic EMA but tend to accelerate or decelerate much more responsive with wider bars presented in trending average.
FRACTAL DEVIATION BANDS: The main idea is based on the so useful Standard Deviation process to create Bands in favor of a multiplier (As John Bollinger used in it's own bands) from a custom array, in which for this case is the "Volume Pressure Moving Average" as the main Vortex for the "Fractallitly", so then apply as many "Child bands" using the older one as the new calculation array using the same morphic constant as multiplier (Like Fibonacci but with other approach rather than %ratios). Results are AWSOME! Market tend to accelerate or decelerate their Trend in favor of a Fractal approach. This bands try to catch them, so please experiment and feedback me your own observations.
EXTERNAL TICKER FOR VOLUME DATA: I Added a way to input volume data for this kind of study from external tickers. This is just a quicky-hack given that currently TradingView is not adding Volume to their Indexes so; maybe this is temporary by now. It seems that this part of the code is conflicting with intraday timeframes, so You are advised.
This CODE is versioned as BETA FOR TESTING PROPOSES. By now TradingView Admins are changing lot's of things internally, so maybe this could conflict with correct rendering of this study with special tickers or timeframes. I will try to code by itself just the core parts of this study in order to use them at discretion in other areas. ALL NEW IDEAS OR MODIFICATIONS to these indicator(s) are Welcome in favor to deploy a better and more accurate readings. I will be very glad to be notified at Twitter or TradingView accounts at: @XeL_Arjona

CM_Ultimate_MA_MTF_V2CM_Ultimate_MA_MTF_V2 - Added Tilson T3
Defaults to Current Timeframe on Chart.
Ability to Plot 2nd Moving Average.
Ability to set Moving Averages to Custom Chart TimeFrame. Example Daily Ma on 60 Minute chart. Many Different Options from Weekly to 1 Minute.
Ability to Plot Cross where Moving Averages Cross (If using 2nd Moving Average).
Ability to Plot Highlight Bars when Price Crosses 1st Moving Average, or 2nd MA.
Moving Averages Supported in Inputs Tab
SMA - Simple Moving Average
EMA - Exponential Moving Average
WMA - Weighted Moving Average
HullMA - Hull Moving Average
VWMA - Volume Weighted Moving Average
RMA - Moving Average used in RSI - Similar to EMA
TEMA - Triple Exponential Moving Average
Tilson T3 - Tilson T3 Moving Average

ATR ZLEMA [QuantAlgo]🟢 Overview
The ATR ZLEMA indicator identifies trend direction and reversal points using a Zero Lag Exponential Moving Average (ZLEMA) combined with volatility-adjusted dynamic trailing stops. It eliminates the inherent lag of traditional moving averages while incorporating Average True Range (ATR) volatility measurement to create adaptive support and resistance levels that automatically adjust to market conditions, with optional noise filtering to reduce whipsaws in choppy markets, helping traders and investors identify trend changes, maintain positions during trending markets, and exit when momentum shifts across multiple timeframes and asset classes.
🟢 How It Works
The indicator's core methodology lies in its zero-lag trend detection system combined with volatility-adaptive trailing stops, where the ZLEMA eliminates moving average lag while ATR-based bands provide dynamic support and resistance levels:
lag = math.floor((zlemaLength - 1) / 2)
rawZlema = ta.ema(source + (source - source ), zlemaLength)
The Zero Lag EMA calculation uses lag reduction through data compensation, adding the difference between current price and lagged price to eliminate the delay inherent in traditional exponential moving averages, providing faster response to trend changes while maintaining smoothness.
The script incorporates an optional ATR-based noise filter that prevents the ZLEMA from updating during insignificant price movements, helping to reduce false signals in choppy, range-bound markets:
if enableNoiseFilter
noiseThreshold = atr * noiseFilter
priceChange = math.abs(rawZlema - zlema)
if priceChange > noiseThreshold
zlema := rawZlema
First, the indicator calculates the Average True Range to measure current market volatility, then applies a user-defined multiplier to determine the distance of the trailing stop from the ZLEMA:
atr = ta.rma(ta.tr(true), atrLength)
atrBand = atr * atrMultiplier
Next, dynamic trend detection occurs through a state-based system where the indicator tracks whether the ZLEMA is above or below the ATR trailing line, automatically adjusting the trailing stop position:
if trend == 1
if zlema < zlemaATR
trend := -1
zlemaATR := zlema + atrBand
else
zlemaATR := math.max(zlemaATR, zlema - atrBand)
The ATR trailing line acts as a volatility-adjusted stop that follows the ZLEMA during trends but never moves against the trend direction. It ratchets upward with the ZLEMA in uptrends and ratchets downward in downtrends, creating a protective barrier that adapts to market volatility.
Finally, trend reversal signals are generated when the ZLEMA crosses the ATR trailing line, indicating a shift in market momentum:
bullSignal = trend == 1 and trend == -1
bearSignal = trend == -1 and trend == 1
This creates a volatility-adaptive trend-following system that combines ZLEMA with dynamic support/resistance levels and optional noise filtering, providing traders with responsive directional signals and automatic stop-loss levels that adjust to both price momentum and market volatility conditions.
🟢 Signal Interpretation
▶ Bullish Trend (Green): ZLEMA trading above ATR trailing line with indicator showing bullish color, indicating established upward momentum with zero-lag confirmation = Long/Buy opportunities
▶ Bearish Trend (Red): ZLEMA trading below ATR trailing line with indicator showing bearish color, indicating established downward momentum with zero-lag confirmation = Short/Sell opportunities
▶ ATR Trailing Line as Dynamic Support: In uptrends, the trailing line acts as volatility-adjusted support level that rises with ZLEMA, never declining = Use as potential stop-loss reference for long positions = ZLEMA holding above indicates trend strength and momentum continuation
▶ ATR Trailing Line as Dynamic Resistance: In downtrends, the trailing line acts as volatility-adjusted resistance level that falls with ZLEMA, never rising = Use as potential stop-loss reference for short positions = ZLEMA holding below indicates trend weakness and momentum continuation
🟢 Features
▶ Preconfigured Presets: Three optimized parameter sets for different trading styles and market conditions. "Default" provides balanced configuration suitable for swing trading on daily and 4-hour charts with standard ZLEMA and ATR periods, moderate multiplier, and moderate noise filtering that works across most market conditions. "Fast Response" delivers aggressive configuration designed for intraday trading and scalping on 5-minute to 1-hour charts with shorter ZLEMA period for quick trend detection, reduced ATR period for rapid volatility adaptation, tighter multiplier for early entries/exits, and minimal noise filtering for maximum responsiveness. This is ideal for active traders monitoring positions closely but expect more frequent signals and potential whipsaws in choppy conditions. "Smooth Trend" focuses on conservative configuration for position trading and long-term trend following on daily to weekly charts with extended ZLEMA period for smoother trend identification, longer ATR period for stable volatility measurement, wide multiplier to filter minor corrections, and aggressive noise filtering to ensure only strong sustained trends trigger signals. This is best for patient traders focused on major trend moves with fewer reversals.
▶ Built-in Alerts: Three alert conditions enable comprehensive automated monitoring of trend changes and zero-lag momentum shifts. "Bullish Trend" triggers when the ZLEMA crosses above the ATR trailing line and trend state changes from bearish to bullish, signaling potential long entry opportunities with lag-eliminated confirmation. "Bearish Trend" activates when the ZLEMA crosses below the ATR trailing line and trend state changes from bullish to bearish, signaling potential short entry or long exit points with immediate momentum detection. "Any Trend Change" provides a combined alert for any trend reversal regardless of direction, allowing traders to be notified of all zero-lag momentum shifts without setting up separate alerts. These notifications enable traders to capitalize on trend changes and protect positions without continuous chart monitoring, leveraging the indicator's zero-lag technology for faster trend change alerts.
▶ Color Customization: Six visual themes (Classic, Aqua, Cosmic, Ember, Neon, plus Custom) accommodate different chart backgrounds and visual preferences, ensuring optimal contrast for identifying bullish versus bearish trends across various trading environments. The adjustable cloud fill transparency control (0-100%) allows fine-tuning of the gradient area prominence between the ATR trailing line and ZLEMA, with higher transparency values (70-95) creating subtle background context without overwhelming the chart while lower values (20-40) produce bold, prominent trend zone emphasis for instant recognition. Optional bar coloring with adjustable transparency (0-100%) extends the trend color directly to the price bars themselves based on ZLEMA trend state, providing immediate visual reinforcement of current trend direction without requiring reference to the indicator lines.

Ultimate MACD [captainua]Ultimate MACD - Comprehensive MACD Trading System
Overview
This indicator combines traditional MACD calculations with advanced features including divergence detection, volume analysis, histogram analysis tools, regression forecasting, strong top/bottom detection, and multi-timeframe confirmation to provide a comprehensive MACD-based trading system. The script calculates MACD using configurable moving average types (EMA, SMA, RMA, WMA) and applies various smoothing methods to reduce noise while maintaining responsiveness. The combination of these features creates a multi-layered confirmation system that reduces false signals by requiring alignment across multiple indicators and timeframes.
Core Calculations
MACD Calculation:
The script calculates MACD using the standard formula: MACD Line = Fast MA - Slow MA, Signal Line = Moving Average of MACD Line, Histogram = MACD Line - Signal Line. The default parameters are Fast=12, Slow=26, Signal=9, matching the traditional MACD settings. The script supports four moving average types:
- EMA (Exponential Moving Average): Standard and most responsive, default choice
- SMA (Simple Moving Average): Equal weight to all periods
- RMA (Wilder's Moving Average): Smoother, less responsive
- WMA (Weighted Moving Average): Recent prices weighted more heavily
The price source can be configured as Close (standard), Open, High, Low, HL2, HLC3, or OHLC4. Alternative sources provide different sensitivity characteristics for various trading strategies.
Configuration Presets:
The script includes trading style presets that automatically configure MACD parameters:
- Scalping: Fast/Responsive settings (8,18,6 with minimal smoothing)
- Day Trading: Balanced settings (10,22,7 with minimal smoothing)
- Swing Trading: Standard settings (12,26,9 with moderate smoothing)
- Position Trading: Smooth/Conservative settings (15,35,12 with higher smoothing)
- Custom: Full manual control over all parameters
Histogram Smoothing:
The histogram can be smoothed using EMA to reduce noise and filter minor fluctuations. Smoothing length of 1 = raw histogram (no smoothing), higher values (3-5) = smoother histogram. Increased smoothing reduces noise but may delay signals slightly.
Percentage Mode:
MACD values can be converted to percentage of price (MACD/Close*100) for cross-instrument comparison. This is useful when comparing MACD signals across instruments with different price levels (e.g., BTC vs ETH). The percentage mode normalizes MACD values, making them comparable regardless of instrument price.
MACD Scale Factor:
A scale factor multiplier (default 1.0) allows adjusting MACD display size for better visibility. Use 0.3-0.5 if MACD appears too compressed, or 2.0-3.0 if too small.
Dynamic Overbought/Oversold Levels:
Overbought and oversold levels are calculated dynamically based on MACD's mean and standard deviation over a lookback period. The formula: OB = MACD Mean + (StdDev × OB Multiplier), OS = MACD Mean - (StdDev × OS Multiplier). This adapts to current market conditions, widening in volatile markets and narrowing in calm markets. The lookback period (default 20) controls how quickly the levels adapt: longer periods (30-50) = more stable levels, shorter (10-15) = more responsive.
OB/OS Background Coloring:
Optional background coloring can highlight the entire panel when MACD enters overbought or oversold territory, providing prominent visual indication of extreme conditions. The background colors are drawn on top of the main background to ensure visibility.
Divergence Detection
Regular Divergence:
The script uses the MACD line (not histogram) for divergence detection, which provides more reliable signals. Bullish divergence: Price makes a lower low while MACD line makes a higher low. Bearish divergence: Price makes a higher high while MACD line makes a lower high. Divergences often precede reversals and are powerful reversal signals.
Pivot-Based Divergence:
The divergence detection uses actual pivot points (pivotlow/pivothigh) instead of simple lowest/highest comparisons. This provides more accurate divergence detection by identifying significant pivot lows/highs in both price and MACD line. The pivot-based method compares two recent pivot points: for bullish divergence, price makes a lower low while MACD makes a higher low at the pivot points. This method reduces false divergences by requiring actual pivot points rather than just any low/high within a period.
The pivot lookback parameters (left and right) control how many bars on each side of a pivot are required for confirmation. Higher values = more conservative pivot detection.
Hidden Divergence:
Continuation patterns that signal trend continuation rather than reversal. Bullish hidden divergence: Price makes a higher low but MACD makes a lower low. Bearish hidden divergence: Price makes a lower high but MACD makes a higher high. These patterns indicate the trend is likely to continue in the current direction.
Zero-Line Filter:
The "Don't Touch Zero Line" option ensures divergences occur in proper context: for bullish divergence, MACD must stay below zero; for bearish divergence, MACD must stay above zero. This filters out divergences that occur in neutral zones.
Range Filtering:
Minimum and maximum lookback ranges control the time window between pivots to consider for divergence. This helps filter out divergences that are too close together (noise) or too far apart (less relevant).
Volume Confirmation System
Volume threshold filtering requires current volume to exceed the volume SMA multiplied by the threshold factor. The formula: Volume Confirmed = Volume > (Volume SMA × Threshold). If the threshold is set to 1.0 or lower, volume confirmation is effectively disabled (always returns true). This allows you to use the indicator without volume filtering if desired. Volume confirmation significantly increases divergence and signal reliability.
Volume Climax and Dry-Up Detection:
The script can mark bars with extremely high volume (volume climax) or extremely low volume (volume dry-up). Volume climax indicates potential reversal points or strong momentum continuation. Volume dry-up indicates low participation and may produce unreliable signals. These markers use standard deviation multipliers to identify extreme volume conditions.
Zero-Line Cross Detection
MACD zero-line crosses indicate momentum shifts: above zero = bullish momentum, below zero = bearish momentum. The script includes alert conditions for zero-line crosses with cooldown protection to prevent alert spam. Zero-line crosses can provide early warning signals before MACD crosses the signal line.
Histogram Analysis Tools
Histogram Moving Average:
A moving average applied to the histogram itself helps identify histogram trend direction and acts as a signal line for histogram movements. Supports EMA, SMA, RMA, and WMA types. Useful for identifying when histogram momentum is strengthening or weakening.
Histogram Bollinger Bands:
Bollinger Bands are applied to the MACD histogram instead of price. The calculation: Basis = SMA(Histogram, Period), StdDev = stdev(Histogram, Period), Upper = Basis + (StdDev × Deviation Multiplier), Lower = Basis - (StdDev × Deviation Multiplier). This creates dynamic zones around the histogram that adapt to histogram volatility. When the histogram touches or exceeds the bands, it indicates extreme conditions relative to recent histogram behavior.
Stochastic MACD (StochMACD):
Stochastic MACD applies the Stochastic oscillator formula to the MACD histogram instead of price. This normalizes the histogram to a 0-100 scale, making it easier to identify overbought/oversold conditions on the histogram itself. The calculation: %K = ((Histogram - Lowest Histogram) / (Highest Histogram - Lowest Histogram)) × 100. %K is smoothed, and %D is calculated as the moving average of smoothed %K. Standard thresholds are 80 (overbought) and 20 (oversold).
Regression Forecasting
The script includes advanced regression forecasting that predicts future MACD values using mathematical models. This helps anticipate potential MACD movements and provides forward-looking context for trading decisions.
Regression Types:
- Linear: Simple trend line (y = mx + b) - fastest, works well for steady trends
- Polynomial: Quadratic curve (y = ax² + bx + c) - captures curvature in MACD movement
- Exponential Smoothing: Weighted average with more weight on recent values - responsive to recent changes
- Moving Average: Uses difference between short and long MA to estimate trend - stable and smooth
Forecast Horizon:
Number of bars to forecast ahead (default 5, max 50 for linear/MA, max 20 for polynomial due to performance). Longer horizons predict further ahead but may be less accurate.
Confidence Bands:
Optional upper/lower bands around forecast show prediction uncertainty based on forecast error (standard deviation of prediction vs actual). Wider bands = higher uncertainty. The confidence level multiplier (default 1.5) controls band width.
Forecast Display:
Forecast appears as dotted lines extending forward from current bar, with optional confidence bands. All forecast values respect percentage mode and scale factor settings.
Strong Top/Bottom Signals
The script detects strong recovery from extreme MACD levels, generating "sBottom" and "sTop" signals. These identify significant reversal potential when MACD recovers substantially from overbought/oversold extremes.
Strong Bottom (sBottom):
Triggered when:
1. MACD was at or near its lowest point in the bottom period (default 10 bars)
2. MACD was in or near the oversold zone
3. MACD has recovered by at least the threshold amount (default 0.5) from the lowest point
4. Recovery persists for confirmation bars (default 2 consecutive bars)
5. MACD has moved out of the oversold zone
6. Volume is above average
7. All enabled filters pass
8. Minimum bars have passed since last signal (reset period, default 5 bars)
Strong Top (sTop):
Triggered when:
1. MACD was at or near its highest point in the top period (default 7 bars)
2. MACD was in or near the overbought zone
3. MACD has declined by at least the threshold amount (default 0.5) from the highest point
4. Decline persists for confirmation bars (default 2 consecutive bars)
5. MACD has moved out of the overbought zone
6. Volume is above average
7. All enabled filters pass
8. Minimum bars have passed since last signal (reset period, default 5 bars)
Label Placement:
sTop/sBottom labels appear on the historical bar where the actual extreme occurred (not on current bar), showing the exact MACD value at that extreme. Labels respect the unified distance checking system to prevent overlaps with Buy/Sell Strength labels.
Signal Strength Calculation
The script calculates a composite signal strength score (0-100) based on multiple factors:
- MACD distance from signal line (0-50 points): Larger separation indicates stronger signal
- Volume confirmation (0-15 points): Volume above average adds points
- Secondary timeframe alignment (0-15 points): Higher timeframe agreement adds points
- Distance from zero line (0-20 points): Closer to zero can indicate stronger reversal potential
Higher scores (70+) indicate stronger, more reliable signals. The signal strength is displayed in the statistics table and can be used as a filter to only accept signals above a threshold.
Smart Label Placement System
The script includes an advanced label placement system that tracks MACD extremes and places Buy/Sell Strength labels at optimal locations:
Label Placement Algorithm:
- Labels appear on the current bar at confirmation (not on historical extreme bars), ensuring they're visible when the signal is confirmed
- The system tracks pending signals when MACD enters OB/OS zones or crosses the signal line
- During tracking, the system continuously searches for the true extreme (lowest MACD for buys, highest MACD for sells) within a configurable historical lookback period
- Labels are only finalized when: (1) MACD exits the OB/OS zone, (2) sufficient bars have passed (2x minimum distance), (3) MACD has recovered/declined by a configurable percentage from the extreme (default 15%), and (4) tracking has stopped (no better extreme found)
Label Spacing and Overlap Prevention:
- Minimum Bars Between Labels: Base distance requirement (default 5 bars)
- Label Spacing Multiplier: Scales the base distance (default 1.5x) for better distribution. Higher values = more spacing between labels
- Effective distance = Base Distance × Spacing Multiplier (e.g., 5 × 1.5 = 7.5 bars minimum)
- Unified distance checking prevents overlaps between all label types (Buy Strength, Sell Strength, sTop, sBottom)
Strength-Based Filtering:
- Label Strength Minimum (%): Only labels with strength at or above this threshold are displayed (default 75%)
- When multiple potential labels are close together, the system automatically compares strengths and keeps only the strongest one
- This ensures only the most significant signals are displayed, reducing chart clutter
Zero Line Polarity Enforcement:
- Enforce Zero Line Polarity (default enabled): Ensures labels follow traditional MACD interpretation
- Buy Strength labels only appear when the tracked extreme MACD value was below zero (negative territory)
- Sell Strength labels only appear when the tracked extreme MACD value was above zero (positive territory)
- This prevents counter-intuitive labels (e.g., Buy labels above zero line) and aligns with standard MACD trading principles
Recovery/Decline Confirmation:
- Recovery/Decline Confirm (%): Percent move away from the extreme required before finalizing (default 15%)
- For Buy labels: MACD must recover by at least this percentage from the tracked bottom
- For Sell labels: MACD must decline by at least this percentage from the tracked top
- Higher values = more confirmation required, fewer but more reliable labels
Historical Lookback:
- Historical Lookback for Label Placement: Number of bars to search for true extremes (default 20)
- The system searches within this period to find the actual lowest/highest MACD value
- Higher values analyze more history but may be slower; lower values are faster but may miss some extremes
Cross Quality Score
The script calculates a MACD cross quality score (0-100) that rates crossover quality based on:
- Cross angle (0-50 points): Steeper crosses = stronger signals
- Volume confirmation (0-25 points): Volume above average adds points
- Distance from zero line (0-25 points): Crosses near zero line are stronger
This score helps identify high-quality crossovers and can be used as a filter to only accept signals meeting minimum quality threshold.
Filtering System
Histogram Filter:
Requires histogram to be above zero for buy signals, below zero for sell signals. Ensures momentum alignment before generating signals.
Signal Strength Filter:
Requires minimum signal strength score for signals. Higher threshold = only strongest signals pass. This combines multiple confirmation factors into a single filter.
Cross Quality Filter:
Requires minimum cross quality score for signals. Rates crossover quality based on angle, volume, momentum, and distance from zero. Only signals meeting minimum quality threshold will be generated.
All filters use the pattern: filterResult = not filterEnabled OR conditionMet. This means if a filter is disabled, it always passes (returns true). Filters can be combined, and all must pass for a signal to fire.
Multi-Timeframe Analysis
The script can display MACD from a secondary (higher) timeframe and use it for confirmation. When secondary timeframe confirmation is enabled, signals require the higher timeframe MACD to align (bullish/bearish) with the signal direction. This ensures signals align with the larger trend context, reducing counter-trend trades.
Secondary Timeframe MACD:
The secondary timeframe MACD uses the same calculation parameters (fast, slow, signal, MA type) as the main MACD but from a higher timeframe. This provides context for the current timeframe's MACD position relative to the larger trend. The secondary MACD lines are displayed on the chart when enabled.
Noise Filtering
Noise filtering hides small histogram movements below a threshold. This helps focus on significant moves and reduces chart clutter. When enabled, only histogram movements above the threshold are displayed. Typical threshold values are 0.1-0.5 for most instruments, depending on the instrument's price range and volatility.
Signal Debounce
Signal debounce prevents duplicate MACD cross signals within a short time period. Useful when MACD crosses back and forth quickly, creating multiple signals. Debounce ensures only one signal per period, reducing signal spam during choppy markets. This is separate from alert cooldown, which applies to all alert types.
Background Color Modes
The script offers three background color modes:
- Dynamic: Full MACD heatmap based on OB/OS conditions, confidence, and momentum. Provides rich visual feedback.
- Monotone: Soft neutral background but still allows overlays (OB/OS zones). Keeps the chart clean without overpowering candles.
- Off: No MACD background (only overlays and plots). Maximum chart cleanliness.
When OB/OS background colors are enabled, they are drawn on top of the main background to ensure visibility.
Statistics Table
A real-time statistics table displays current MACD values, signal strength, distance from zero line, secondary timeframe alignment, volume confirmation status, and all active filter statuses. The table dynamically adjusts to show only enabled features, keeping it clean and relevant. The table position can be configured (Top Left, Top Right, Bottom Left, Bottom Right).
Performance Statistics Table
An optional performance statistics table shows comprehensive filter diagnostics:
- Total buy/sell signals (raw crossover count before filters)
- Filtered buy/sell signals (signals that passed all filters)
- Overall pass rates (percentage of signals that passed filters)
- Rejected signals count
- Filter-by-filter rejection diagnostics showing which filters rejected how many signals
This table helps optimize filter settings by showing which filters are most restrictive and how they impact signal frequency. The diagnostics format shows rejections as "X B / Y S" (X buy signals rejected, Y sell signals rejected) or "Disabled" if the filter is not active.
Alert System
The script includes separate alert conditions for each signal type:
- MACD Cross: MACD line crosses above/below Signal line (with or without secondary confirmation)
- Zero-Line Cross: MACD crosses above/below zero
- Divergence: Regular and hidden divergence detections
- Secondary Timeframe: Higher timeframe MACD crosses
- Histogram MA Cross: Histogram crosses above/below its moving average
- Histogram Zero Cross: Histogram crosses above/below zero
- StochMACD: StochMACD overbought/oversold entries and %K/%D crosses
- Histogram BB: Histogram touches/breaks Bollinger Bands
- Volume Events: Volume climax and dry-up detections
- OB/OS: MACD entry/exit from overbought/oversold zones
- Strong Top/Bottom: sTop and sBottom signal detections
Each alert type has its own cooldown system to prevent alert spam. The cooldown requires a minimum number of bars between alerts of the same type, reducing duplicate alerts during volatile periods. Alert types can be filtered to only evaluate specific alert types (All, MACD Cross, Zero Line, Divergence, Secondary Timeframe, Histogram MA, Histogram Zero, StochMACD, Histogram BB, Volume Events, OB/OS, Strong Top/Bottom).
How Components Work Together
MACD crossovers provide the primary signal when the MACD line crosses the Signal line. Zero-line crosses indicate momentum shifts and can provide early warning signals. Divergences identify potential reversals before they occur.
Volume confirmation ensures signals occur with sufficient market participation, filtering out low-volume false breakouts. Histogram analysis tools (MA, Bollinger Bands, StochMACD) provide additional context for signal reliability and identify significant histogram zones.
Signal strength combines multiple confirmation factors into a single score, making it easy to filter for only the strongest signals. Cross quality score rates crossover quality to identify high-quality setups. Multi-timeframe confirmation ensures signals align with higher timeframe trends, reducing counter-trend trades.
Usage Instructions
Getting Started:
The default configuration shows MACD(12,26,9) with standard EMA calculations. Start with default settings and observe behavior, then customize settings to match your trading style. You can use configuration presets for quick setup based on your trading style.
Customizing MACD Parameters:
Adjust Fast Length (default 12), Slow Length (default 26), and Signal Length (default 9) based on your trading timeframe. Shorter periods (8,17,7) for faster signals, longer (15,30,12) for smoother signals. You can change the moving average type: EMA for responsiveness, RMA for smoothness, WMA for recent price emphasis.
Price Source Selection:
Choose Close (standard), or alternative sources (HL2, HLC3, OHLC4) for different sensitivity. HL2 uses the midpoint of the high-low range, HLC3 and OHLC4 incorporate more price information.
Histogram Smoothing:
Set smoothing to 1 for raw histogram (no smoothing), or increase (3-5) for smoother histogram that reduces noise. Higher smoothing reduces false signals but may delay signals slightly.
Percentage Mode:
Enable percentage mode when comparing MACD across instruments with different price levels. This normalizes MACD values, making them directly comparable.
Dynamic OB/OS Levels:
The dynamic thresholds automatically adapt to volatility. Adjust the multipliers (default 1.5) to fine-tune sensitivity: higher values (2.0-3.0) = more extreme thresholds (fewer signals), lower (1.0-1.5) = more frequent signals. Adjust the lookback period to control how quickly levels adapt. Enable OB/OS background colors for visual indication of extreme conditions.
Volume Confirmation:
Set volume threshold to 1.0 (default, effectively disabled) or higher (1.2-1.5) for standard confirmation. Higher values require more volume for confirmation. Set to 0.1 to completely disable volume filtering.
Filters:
Enable filters gradually to find your preferred balance. Start with histogram filter for basic momentum alignment, then add signal strength filter (threshold 50+) for moderate signals, then cross quality filter (threshold 50+) for high-quality crossovers. Combine filters for highest-quality signals but expect fewer signals.
Divergence:
Enable divergence detection and adjust pivot lookback parameters. Pivot-based divergence provides more accurate detection using actual pivot points. Hidden divergence is useful for trend-following strategies. Adjust range parameters to filter divergences by time window.
Zero-Line Crosses:
Zero-line cross alerts are automatically available when alerts are enabled. These provide early warning signals for momentum shifts.
Histogram Analysis Tools:
Enable Histogram Moving Average to see histogram trend direction. Enable Histogram Bollinger Bands to identify extreme histogram zones. Enable Stochastic MACD to normalize histogram to 0-100 scale for overbought/oversold identification.
Multi-Timeframe:
Enable secondary timeframe MACD to see higher timeframe context. Enable secondary confirmation to require higher timeframe alignment for signals.
Signal Strength:
Signal strength is automatically calculated and displayed in the statistics table. Use signal strength filter to only accept signals above a threshold (e.g., 50 for moderate, 70+ for strong signals only).
Smart Label Placement:
Configure label placement settings to control label appearance and quality:
- Label Strength Minimum (%): Set threshold (default 75%) to show only strong signals. Higher = fewer, stronger labels
- Label Spacing Multiplier: Adjust spacing (default 1.5x) for better distribution. Higher = more spacing between labels
- Recovery/Decline Confirm (%): Set confirmation requirement (default 15%). Higher = more confirmation, fewer labels
- Enforce Zero Line Polarity: Enable (default) to ensure Buy labels only appear when tracked extreme was below zero, Sell labels only when above zero
- Historical Lookback: Adjust search period (default 20 bars) for finding true extremes. Higher = more history analyzed
Cross Quality:
Cross quality score is automatically calculated for crossovers. Use cross quality filter to only accept high-quality crossovers (threshold 50+ for moderate, 70+ for high quality).
Alerts:
Set up alerts for your preferred signal types. Enable alert cooldown (default enabled, 5 bars) to prevent alert spam. Use alert type filter to only evaluate specific alert types (All, MACD Cross, Zero Line, Divergence, Secondary Timeframe, Histogram MA, Histogram Zero, StochMACD, Histogram BB, Volume Events, OB/OS, Strong Top/Bottom). Each signal type has its own alert condition, so you can be selective about which signals trigger alerts.
Visual Elements and Signal Markers
The script uses various visual markers to indicate signals and conditions:
- MACD Line: Green when above signal (bullish), red when below (bearish) if dynamic colors enabled. Optional black outline for enhanced visibility
- Signal Line: Orange line with optional black outline for enhanced visibility
- Histogram: Color-coded based on direction and momentum (green for bullish rising, lime for bullish falling, red for bearish falling, orange for bearish rising)
- Zero Line: Horizontal reference line at MACD = 0
- Fill to Zero: Green/red semi-transparent fill between MACD line and zero line showing bullish/bearish territory
- Fill Between OB/OS: Blue semi-transparent fill between overbought/oversold thresholds highlighting neutral zone
- OB/OS Background Colors: Background coloring when MACD enters overbought/oversold zones
- Background Colors: Dynamic or monotone backgrounds indicating MACD state, or custom chart background
- Divergence Labels: "🐂" for bullish, "🐻" for bearish, "H Bull" for hidden bullish, "H Bear" for hidden bearish
- Divergence Lines: Colored lines connecting pivot points when divergences are detected
- Volume Climax Markers: ⚡ symbol for extremely high volume
- Volume Dry-Up Markers: 💧 symbol for extremely low volume
- Buy/Sell Strength Labels: Show signal strength percentage (e.g., "Buy Strength: 75%")
- Strong Top/Bottom Labels: "sTop" and "sBottom" for extreme level recoveries
- Secondary MACD Lines: Purple lines showing higher timeframe MACD
- Histogram MA: Orange line showing histogram moving average
- Histogram BB: Blue bands around histogram showing extreme zones
- StochMACD Lines: %K and %D lines with overbought/oversold thresholds
- Regression Forecast: Dotted blue lines extending forward with optional confidence bands
Signal Priority and Interpretation
Signals are generated independently and can occur simultaneously. Higher-priority signals generally indicate stronger setups:
1. MACD Cross with Multiple Filters - Highest priority: Requires MACD crossover plus all enabled filters (histogram, signal strength, cross quality) and secondary timeframe confirmation if enabled. These are the most reliable signals.
2. Zero-Line Cross - High priority: Indicates momentum shift. Can provide early warning signals before MACD crosses the signal line.
3. Divergence Signals - Medium-High priority: Pivot-based divergence is more reliable than simple divergence. Hidden divergence indicates continuation rather than reversal.
4. MACD Cross with Basic Filters - Medium priority: MACD crosses signal line with basic histogram filter. Less reliable alone but useful when combined with other confirmations.
Best practice: Wait for multiple confirmations. For example, a MACD crossover combined with divergence, volume confirmation, and secondary timeframe alignment provides the strongest setup.
Chart Requirements
For proper script functionality and compliance with TradingView requirements, ensure your chart displays:
- Symbol name: The trading pair or instrument name should be visible
- Timeframe: The chart timeframe should be clearly displayed
- Script name: "Ultimate MACD " should be visible in the indicator title
These elements help traders understand what they're viewing and ensure proper script identification. The script automatically includes this information in the indicator title and chart labels.
Performance Considerations
The script is optimized for performance:
- Calculations use efficient Pine Script functions (ta.ema, ta.sma, etc.) which are optimized by TradingView
- Conditional execution: Features only calculate when enabled
- Label management: Old labels are automatically deleted to prevent accumulation
- Array management: Divergence label arrays are limited to prevent memory accumulation
The script should perform well on all timeframes. On very long historical data with many enabled features, performance may be slightly slower, but it remains usable.
Known Limitations and Considerations
- Dynamic OB/OS levels can vary significantly based on recent MACD volatility. In very volatile markets, levels may be wider; in calm markets, they may be narrower.
- Volume confirmation requires sufficient historical volume data. On new instruments or very short timeframes, volume calculations may be less reliable.
- Higher timeframe MACD uses request.security() which may have slight delays on some data feeds.
- Stochastic MACD requires the histogram to have sufficient history. Very short periods on new charts may produce less reliable StochMACD values initially.
- Divergence detection requires sufficient historical data to identify pivot points. Very short lookback periods may produce false positives.
Practical Use Cases
The indicator can be configured for different trading styles and timeframes:
Swing Trading:
Use MACD(12,26,9) with secondary timeframe confirmation. Enable divergence detection. Use signal strength filter (threshold 50+) and cross quality filter (threshold 50+) for higher-quality signals. Enable histogram analysis tools for additional context.
Day Trading:
Use MACD(8,17,7) or use "Day Trading" preset with minimal histogram smoothing for faster signals. Enable zero-line cross alerts for early signals. Use volume confirmation with threshold 1.2-1.5. Enable histogram MA for momentum tracking.
Trend Following:
Use MACD(12,26,9) or longer periods (15,30,12) for smoother signals. Enable secondary timeframe confirmation for trend alignment. Hidden divergence signals are useful for trend continuation entries. Use cross quality filter to identify high-quality crossovers.
Reversal Trading:
Focus on divergence detection (pivot-based for accuracy) combined with zero-line crosses. Enable volume confirmation. Use histogram Bollinger Bands to identify extreme histogram zones. Enable StochMACD for overbought/oversold identification.
Multi-Timeframe Analysis:
Enable secondary timeframe MACD to see context from larger timeframes. For example, use daily MACD on hourly charts to understand the larger trend context. Enable secondary confirmation to require higher timeframe alignment for signals.
Practical Tips and Best Practices
Getting Started:
Start with default settings and observe MACD behavior. The default configuration (MACD 12,26,9 with EMA) is balanced and works well across different markets. After observing behavior, customize settings to match your trading style. Consider using configuration presets for quick setup.
Reducing Repainting:
All signals are based on confirmed bars, minimizing repainting. The script uses confirmed bar data for all calculations to ensure backtesting accuracy.
Signal Quality:
MACD crosses with multiple filters provide the highest-quality signals because they require alignment across multiple indicators. These signals have lower frequency but higher reliability. Use signal strength scores to identify the strongest signals (70+). Use cross quality scores to identify high-quality crossovers (70+).
Filter Combinations:
Start with histogram filter for basic momentum alignment, then add signal strength filter for moderate signals, then cross quality filter for high-quality crossovers. Combining all filters significantly reduces false signals but also reduces signal frequency. Find your balance based on your risk tolerance.
Volume Filtering:
Set volume threshold to 1.0 (default, effectively disabled) or lower to effectively disable volume filtering if you trade instruments with unreliable volume data or want to test without volume confirmation. Standard confirmation uses 1.2-1.5 threshold.
MACD Period Selection:
Standard MACD(12,26,9) provides balanced signals suitable for most trading. Shorter periods (8,17,7) for faster signals, longer (15,30,12) for smoother signals. Adjust based on your timeframe and trading style. Consider using configuration presets for optimized settings.
Moving Average Type:
EMA provides balanced responsiveness with smoothness. RMA is smoother and less responsive. WMA gives more weight to recent prices. SMA gives equal weight to all periods. Choose based on your preference for responsiveness vs. smoothness.
Divergence:
Pivot-based divergence is more reliable than simple divergence because it uses actual pivot points. Hidden divergence indicates continuation rather than reversal, useful for trend-following strategies. Adjust pivot lookback parameters to control sensitivity.
Dynamic Thresholds:
Dynamic OB/OS thresholds automatically adapt to volatility. In volatile markets, thresholds widen; in calm markets, they narrow. Adjust the multipliers to fine-tune sensitivity. Enable OB/OS background colors for visual indication.
Zero-Line Crosses:
Zero-line crosses indicate momentum shifts and can provide early warning signals before MACD crosses the signal line. Enable alerts for zero-line crosses to catch these early signals.
Alert Management:
Enable alert cooldown (default enabled, 5 bars) to prevent alert spam. Use alert type filter to only evaluate specific alert types. Signal debounce (default enabled, 3 bars) prevents duplicate MACD cross signals during choppy markets.
Technical Specifications
- Pine Script Version: v6
- Indicator Type: Non-overlay (displays in separate panel below price chart)
- Repainting Behavior: Minimal - all signals are based on confirmed bars, ensuring accurate backtesting results
- Performance: Optimized with conditional execution. Features only calculate when enabled.
- Compatibility: Works on all timeframes (1 minute to 1 month) and all instruments (stocks, forex, crypto, futures, etc.)
- Edge Case Handling: All calculations include safety checks for division by zero, NA values, and boundary conditions. Alert cooldowns and signal debounce handle edge cases where conditions never occurred or values are NA.
Technical Notes
- All MACD values respect percentage mode conversion when enabled
- Volume confirmation uses cached volume SMA for performance
- Label arrays (divergence) are automatically limited to prevent memory accumulation
- Background coloring: OB/OS backgrounds are drawn on top of main background to ensure visibility
- All calculations are optimized with conditional execution - features only calculate when enabled (performance optimization)
- Signal strength calculation combines multiple factors into a single score for easy filtering
- Cross quality calculation rates crossover quality based on angle, volume, and distance from zero
- Secondary timeframe MACD uses request.security() for higher timeframe data access
- Histogram analysis features (Bollinger Bands, MA, StochMACD) provide additional context beyond basic MACD signals
- Statistics table dynamically adjusts to show only enabled features, keeping it clean and relevant
- Divergence detection uses MACD line (not histogram) for more reliable signals
- Configuration presets automatically optimize MACD parameters for different trading styles
- Smart label placement: Labels appear on current bar at confirmation, using strength from tracked extreme point
- Label spacing uses effective distance (base distance × spacing multiplier) for better distribution
- Zero line polarity enforcement ensures Buy labels only appear when tracked extreme MACD < 0, Sell labels only when tracked extreme MACD > 0
- Label finalization requires MACD exit from OB/OS zone, sufficient bars passed, and recovery/decline percentage confirmation
- Strength-based filtering automatically compares and keeps only the strongest label when multiple signals are close together
- Enhanced visualization: Line outlines drawn behind main lines for superior visibility (black default, configurable)
- Enhanced visualization: Fill between MACD and zero line provides instant visual feedback (green above, red below)
- Enhanced visualization: Fill between OB/OS thresholds highlights neutral zone when dynamic levels are active
- Custom chart background overrides background mode when enabled, allowing theme-consistent indicator panels

Advanced custom multi MA signals (EMA/SMA/VWMA/VWAP) Features of Multi Moving Averages
The biggest enemy in trading is "Noise." If you get swayed by minute fluctuations on the chart, you end up missing the forest for the trees.
This indicator (Advanced Custom Multi MA Signals) is not just a simple line. By combining the three core elements of Price, Time, and Volume, it acts as a navigation system that visualizes the market's "true trend." In particular, the ability to analyze 5 moving averages simultaneously across various timeframes is akin to viewing a 3D map of the battlefield.
Understanding Core Concepts
This indicator supports 4 types of moving averages. It is crucial to clearly understand the nature of each tool.
SMA (Simple Moving Average): The most basic average value. Since it produces fewer whipsaws (false signals), it is used as a baseline to judge the "long-term trend."
EMA (Exponential Moving Average): Places more weight on recent prices. It reacts sensitively to market changes, making it advantageous for identifying "entry points."
VWMA (Volume Weighted Moving Average): Incorporates "volume" into the price calculation. It acts as a "false signal filter," weeding out price moves that aren't backed by trading volume.
VWAP (Volume Weighted Average Price): The benchmark price used by institutional investors for daily trading. It is calculated based on the session, regardless of the period settings. It is considered the "lifeline" of day trading.
Indicator Settings Guide
Open the settings window and tune it to fit your trading style.
MA 01 ~ 05 (Moving Average Settings)
MA Type: Select according to your purpose. (Generally, EMA is recommended for short-term analysis, SMA/VWMA for long-term).
Length: Enter the period you wish to analyze (e.g., 20, 60, 120, 200).
Timeframe: This is the core feature. It allows you to overlay moving averages from a higher timeframe (e.g., 4-hour, Daily) onto the chart you are currently viewing (e.g., 15-minute).
Signal Option (Trading Signals)
Golden Cross (GC) / Death Cross (DC): Captures the moment the short-term line breaks through the long-term line. You can run up to 3 strategies simultaneously.
Ribbon Gradient (Trend Visualization)
Represents the gap between two moving averages with color. As the color deepens and the width expands, it indicates a powerful trend; if the width narrows, it suggests a high probability of a trend reversal.
5 Usage Strategies
The highlight of this indicator is the cross strategy utilizing the "Multi-Timeframe (MTF)" feature. Familiarize yourself with the 5 example strategies below and set up your own strategy based on your expertise.
💡 Tip 1. Do not go against the "Major Trend" (The Authority of the Weekly Candle)
Settings: Set MA5 to .
Interpretation: The Weekly 50 line is the "major trend line" managed by institutions and market makers. If the current price is above this line, maintain only a "Buy (Long)" bias; if below, maintain only a "Sell (Short)" bias. Adhering to this rule alone can help you avoid massive losses.
💡 Tip 2. Highly Reliable "Swing Signal" (Daily Golden Cross)
Settings: In Signal 1, configure the Short MA to and the Long MA to .
Interpretation: A Golden Cross where the 4-Hour 50 EMA breaks above the Daily 50 EMA often signifies a major "trend reversal" rather than a temporary rebound. This provides an ideal entry signal for office workers or swing traders who need high reliability.
💡 Tip 3. 4-Hour Candle as the Standard for "Precision Entry"
Situation: When the Daily trend is rising (Bullish alignment).
Strategy: While watching the 15-minute or 1-hour chart, set the indicator's Signal 2 to the cross of and .
Interpretation: When the Daily chart is in an uptrend, a Golden Cross occurring on the 4-Hour chart marks "the point where a correction (pullback) ends and the rise resumes." This is the entry point with the best risk-to-reward ratio.
💡 Tip 4. Filtering Out "Fake Signals" (The Secret of Volume)
Strategy: When creating a cross signal, try using VWMA (Volume Weighted) for the Long MA, even if you use EMA for the Short MA.
Reason: A Golden Cross caused simply by a rise in price can be a trap. However, if it breaks through the heavy VWMA line accompanied by volume, it is strong evidence that "genuine liquidity" has entered.
💡 Tip 5. Remember the "Hierarchy" (Higher Timeframe Priority Rule)
Principle: If a Golden Cross (Buy Signal) appears on the 4-Hour chart, but the Daily chart is in a Death Cross (Sell Signal) state, do not enter.
Interpretation: A signal from a lower timeframe cannot overcome the power of a higher timeframe. The professional approach is to trade with significant volume only when signals align (Sync) in the order of Weekly > Daily > 4-Hour. Keep this indicator's dashboard feature on and always check the status of higher timeframes.
Signal Generation Principle (Operating Mechanism)
Signals are generated when the set short-term moving average and long-term moving average cross each other.
📈 1. Golden Cross (BUY = Buy Signal)
Situation: The moment the short-term MA crosses upward from below the long-term MA.
Principle: It implies that recent buying pressure has broken through the resistance level accumulated over a long period.
📉 2. Death Cross (SELL = Sell Signal)
Situation: The moment the short-term MA crosses downward from above the long-term MA.
Principle: It implies that recent selling pressure has collapsed the long-term support line.
※ If the candles are not displaying correctly or are flickering, please set the indicator's 'Visual order' to 'Bring to front' as shown in the image below.
Investment Caution and Disclaimer
Before using this indicator for actual trading, please strictly read the contents below.
① Auxiliary indicators are a "Compass," not a "Book of Prophecy."
This indicator is merely a tool that mathematically calculates and visualizes past price data. A "magic indicator" that predicts future price fluctuations 100% accurately or guarantees profit does not exist. The signals provided are for reference only and must never be the sole basis for entry/exit decisions.
② The responsibility for all investments lies with "Yourself."
Financial investment (Cryptocurrencies, Stocks, Futures, etc.) involves high volatility and is a risky activity that can result in the loss of some or all of the principal. The final responsibility for all trading results (profits and losses) incurred by utilizing this indicator lies entirely with the investor. The distributor and developer accept no legal responsibility for investment results under any circumstances.
③ Past data does not guarantee the future.
Even a Golden Cross that fit perfectly in backtesting or past charts may operate differently in tomorrow's market situation (News, Macroeconomics, Unexpected Variables, etc.). Do not rely solely on technical analysis; you must conduct fundamental analysis and risk management in parallel.
④ Risk management is the top priority.
No matter how promising a signal appears, "all-in trading" (investing all assets in a single trade) is a shortcut to bankruptcy. More important than the indicator itself is adhering to the principles of strict scaling in (split buying) and Stop-Loss.

HTF BIAS FILTER🧭HTF Bias Filter Indicator: 5 in 1 indicator
Technical Overview
The Bias Filter is a comprehensive multi-timeframe tool designed to confirm directional bias using five key indicators before entering a trade. It plots higher-timeframe Moving Averages directly on the chart and provides an immediate status summary via a static dashboard.
The more confluence on the dashboard, the greater the probability of the direction of the trade.
1. 📊 Display Components
A. Plotted Lines
The indicator uses the request.security function to draw Moving Averages from higher timeframes onto your current chart:
1H EMA 21 (Purple): The 21-period Exponential Moving Average calculated on the 1-Hour (60 min) chart. Plotted using a step-line style.
4H EMA 50 (Red): The 50-period Exponential Moving Average calculated on the 4-Hour (240 min) chart. Plotted using a step-line style.
B. Directional Dashboard
A fixed-position summary table is anchored to the bottom-right corner of the chart, providing a quick glance at the current status of all five filters.
2. 🎨 Colour Logic
Each of the five indicators is assigned a colour based on its current directional signal. The more indicators that show the same colour (confluence), the stronger the signal and the higher the likelihood of a high-probability trade.
🟢 Green indicators are signaling UP/BUY (Bullish momentum or trend).
🔴 Red indicators are signaling DOWN/SELL (Bearish momentum or trend).
⚫ Gray indicators are signaling Mixed or flat directions (neutral or undecided).
Note: The dashboard's main header color is determined by a strict confluence logic (All four 4H filters must align for Green/Red), while individual indicator colors follow the simple rules above.
3. 📋 Indicator Breakdown and Logic
The dashboard provides the direction of five different filters.
3.1. Higher-Timeframe (HTF) Trend Indicators
These two signals determine the immediate slope and direction of the primary Moving Averages:
4H EMA 50:
Timeframe: 4-Hour (240 min)
Logic: Compares the current EMA value to the value two bars ago on the 4H chart.
Output: UP ↑, DOWN ↓, or FLAT ⏸
1H EMA 21:
Timeframe: 1-Hour (60 min)
Logic: Compares the current EMA value to the value two bars ago on the 1H chart.
Output: UP ↑, DOWN ↓, or FLAT ⏸
3.2. 4-Hour Confluence Filters
These three indicators provide supplementary confirmation on Volume, Price Position, and Momentum, all calculated on the 4-Hour (240 min) chart:
4H OBV (Smoothed):
Timeframe: 4-Hour (240 min)
Logic: Direction is based on the current value of the 21-bar smoothed On-Balance Volume (OBV) compared to its value nine bars ago.
Output: UP ↑, DOWN ↓, or FLAT ⏸
4H ATR DIR (EMA Proxy):
Timeframe: 4-Hour (240 min)
Logic: Determines the price position by comparing the current Close price against the 4H EMA 50.
Output: BUY 🟢 (Close > EMA 50), SELL 🔴 (Close < EMA 50), or FLAT ⏸️ (Close = EMA 50).
4H RSI (14):
Timeframe: 4-Hour (240 min)
Logic: Momentum check comparing the 14-period Relative Strength Index (RSI) value against the 50 level.
Output: BUY 🟢 (RSI > 50), SELL 🔴 (RSI < 50), or FLAT ⏸️ (RSI = 50).

VWAP D/W/M + MA100 & EMA100 albanThis TradingView indicator displays three independent VWAPs (Volume Weighted Average Prices) along with MA100 (Simple Moving Average) and EMA100 (Exponential Moving Average) on the chart.
Key Features:
VWAP #1, VWAP #2, VWAP #3: Each VWAP can be configured independently with:
Source (hlc3, close, etc.)
Anchor period (Session, Week, Month, Quarter, Year, Decade, Century, Earnings, Dividends, Splits)
Offset
Option to hide on daily or higher timeframes
MA100: 100-period Simple Moving Average
EMA100: 100-period Exponential Moving Average
Purpose:
This script is ideal for traders who want to track multiple VWAP levels simultaneously while also monitoring the 100-period moving averages for trend analysis. It provides a clean setup without bands or fills, focusing solely on price averages.
Use Cases:
Identify intraday or multi-timeframe VWAP levels
Combine VWAP levels with MA100/EMA100 for support/resistance analysis
Analyze trend direction and momentum using moving averages

Turtle Strategy - Triple EMA Trend with ADX and ATRDescription
The Triple EMA Trend strategy is a directional momentum system built on the alignment of three exponential moving averages and a strong ADX confirmation filter. It is designed to capture established trends while maintaining disciplined risk management through ATR-based stops and targets.
Core Logic
The system activates only under high-trend conditions, defined by the Average Directional Index (ADX) exceeding a configurable threshold (default: 43).
A bullish setup occurs when the short-term EMA is above the mid-term EMA, which in turn is above the long-term EMA, and price trades above the fastest EMA.
A bearish setup is the mirror condition.
Execution Rules
Entry:
• Long when ADX confirms trend strength and EMA alignment is bullish.
• Short when ADX confirms trend strength and EMA alignment is bearish.
Exit:
• Stop Loss: 1.8 × ATR below (for longs) or above (for shorts) the entry price.
• Take Profit: 3.3 × ATR in the direction of the trade.
Both parameters are configurable.
Additional Features
• Start/end date inputs for controlled backtesting.
• Selective activation of long or short trades.
• Built-in commission and position sizing (percent of equity).
• Full visual representation of EMAs, ADX, stop-loss, and target levels.
This strategy emphasizes clean trend participation, strict entry qualification, and consistent reward-to-risk structure. Ideal for swing or medium-term testing across trending assets.

RSI-GringoRSI-Gringo — Stochastic RSI with Advanced Smoothing Averages
Overview:
RSI-Gringo is an advanced technical indicator that combines the concept of the Stochastic RSI with multiple smoothing options using various moving averages. It is designed for traders seeking greater precision in momentum analysis, while offering the flexibility to select the type of moving average that best suits their trading style.
Disclaimer: This script is not investment advice. Its use is entirely at your own risk. My responsibility is to provide a fully functional indicator, but it is not my role to guide how to trade, adjust, or use this tool in any specific strategy.
The JMA (Jurik Moving Average) version used in this script is a custom implementation based on publicly shared code by TradingView users, and it is not the original licensed version from Jurik Research.
What This Indicator Does
RSI-Gringo applies the Stochastic Oscillator logic to the RSI itself (rather than price), helping to identify overbought and oversold conditions within the RSI. This often leads to more responsive and accurate momentum signals.
This indicator displays:
%K: the main Stochastic RSI line
%D: smoothed signal line of %K
Upper/Lower horizontal reference lines at 80 and 20
Features and Settings
Available smoothing methods (selectable from dropdown):
SMA — Simple Moving Average
SMMA — Smoothed Moving Average (equivalent to RMA)
EMA — Exponential Moving Average
WMA — Weighted Moving Average
HMA — Hull Moving Average (manually implemented)
JMA — Jurik Moving Average (custom approximation)
KAMA — Kaufman Adaptive Moving Average
T3 — Triple Smoothed Moving Average with adjustable hot factor
How to Adjust Advanced Averages
T3 – Triple Smoothed MA
Parameter: T3 Hot Factor
Valid range: 0.1 to 2.0
Tuning:
Lower values (e.g., 0.1) make it faster but noisier
Higher values (e.g., 2.0) make it smoother but slower
Balanced range: 0.7 to 1.0 (recommended)
JMA – Jurik Moving Average (Custom)
Parameters:
Phase: adjusts responsiveness and smoothness (-100 to 100)
Power: controls smoothing intensity (default: 1)
Tuning:
Phase = 0: neutral behavior
Phase > 0: more reactive
Phase < 0: smoother, more delayed
Power = 1: recommended default for most uses
Note: The JMA used here is not the proprietary version by Jurik Research, but an educational approximation available in the public domain on TradingView.
How to Use
Crossover Signals
Buy signal: %K crosses above %D from below the 20 line
Sell signal: %K crosses below %D from above the 80 line
Momentum Strength
%K and %D above 80: strong bullish momentum
%K and %D below 20: strong bearish momentum
With Trend Filters
Combine this indicator with trend-following tools (like moving averages on price)
Fast smoothing types (like EMA or HMA) are better for scalping and day trading
Slower types (like T3 or KAMA) are better for swing and long-term trading
Final Tips
Tweak RSI and smoothing periods depending on the time frame you're trading.
Try different combinations of moving averages to find what works best for your strategy.
This indicator is intended as a supporting tool for technical analysis — not a standalone decision-making system.

RSI + MA + Divergence + SnR + Price levelOverview
This indicator combines several technical analysis tools to give traders a comprehensive view based on the RSI indicator. Its main features include:
RSI & Moving Averages on RSI:
RSI: Calculates the RSI based on the closing price (or a user-selected source) with a configurable period (default is 14).
EMA and WMA: Computes and plots an Exponential Moving Average (EMA with a period of 9) and a Weighted Moving Average (WMA with a period of 45) on the RSI, helping to smooth out signals and better identify trends.
Price Ladder Based on RSI:
Draws horizontal lines at specified target RSI levels (from targetRSI1 to targetRSI7, default levels ranging from 20 to 80).
Calculates a target price based on the price change relative to the averaged gains and losses, providing an estimated price level when the RSI reaches those critical levels.
Divergence Detection:
Identifies divergence between price and RSI:
Bullish Divergence: Detected when the price forms a lower low but RSI fails to confirm with a corresponding lower low, with the RSI falling under a configurable threshold (d_below).
Bearish Divergence: Detected when the price forms a higher high while the RSI does not, with the RSI exceeding a configurable upper threshold (d_upper).
Optionally displays labels on the chart to alert the trader when divergence signals are detected.
Auto Support & Resistance on RSI:
Automatically calculates and plots support and resistance lines based on the RSI over different lookback periods (e.g., 34, 89, 200 bars).
Helps traders identify key RSI levels where price reversals or breakouts might occur.
Benefits for the Trader
This indicator is designed to assist traders in their decision-making process by integrating multiple technical analysis elements:
Identifying Market Trends:
By combining the RSI with its moving averages (EMA, WMA), traders can better assess market trends and the strength of these trends, thereby improving trade entry accuracy.
Early Reversal Signals via Divergence:
Divergence signals (both bullish and bearish) can help forecast potential reversals in the market, allowing traders to adjust their strategies timely.
Determining RSI-Based Support/Resistance Levels:
Automatic identification of support and resistance levels on the RSI provides key areas where a price reversal or breakout may occur, assisting traders in setting stop-loss and take-profit levels strategically.
Price Target Forecasting with the Price Ladder:
The target price labels calculated at important RSI levels provide insights into potential price objectives, aiding in risk management and profit planning.
Flexible Configuration:
Traders can customize key parameters such as the RSI period, lengths for EMA and WMA, target RSI levels, divergence conditions, and support/resistance settings. This flexibility allows the indicator to adapt to different trading styles and strategies.
How to read data
Some use-cases
Used to estimate price according to the RSI level.
When you trade using RSI, you want to set your stop-loss or take-profit levels based on RSI. By looking at the price ladder, you know the corresponding price level to enter a trade.
Used to determine the entry zone.
RSI often reacts to its own previously established support/resistance levels. Use the Auto SnR feature to identify those zones.
Used to determine the trend.
RSI and its moving averages help identify the price trend:
Uptrend: 3 lines separate and point upward.
Downtrend: 3 lines separate and point downward.
Use WMA45 to determine the trend:
Uptrend: WMA45 is moving upward or trading above the 50 level.
Downtrend: WMA45 is moving downward or trading below the 50 level.
Sideways: WMA45 is trading around the 50 level.
Use EMA9 to confirm the trend: A crossover of EMA9 through WMA45 confirms the formation of a new trend.
Configuration
The script allows users to configure a number of important parameters to suit their analytical preferences:
RSI Settings:
RSI Length (rsiLengthInput): The number of periods used to compute the RSI (default is 14, adjustable as needed).
RSI Source (rsiSourceInput): Select the price source (default is the closing price).
RSI Color (rsiClr): The color used to display the RSI line.
Moving Averages on RSI:
EMA Length (emaLength): The period for calculating the EMA on RSI (default is 9).
WMA Length (wmaLength): The period for calculating the WMA on RSI (default is 45).
EMA Color (emaClr) and WMA Color (wmaClr): Customize the colors of the EMA and WMA lines.
Price Ladder Settings:
Toggle Price Ladder (showPrice): Enable or disable the display of the price ladder.
Target RSI Levels: targetRSI1 through targetRSI7: RSI values at which target prices are calculated (default values range from 20, 30, 40, 50, 60, 70 to 80).
Price Label Color (priceColor): The text color for displaying the target price labels.
Divergence Settings:
Divergence Toggle (calculateDivergence): Option to enable or disable divergence calculation and display.
Divergence Conditions:
d_below: RSI level below which bullish divergence is considered.
d_upper: RSI level above which bearish divergence is considered.
Display Divergence Labels (showDivergenceLabel): Option to display labels on the chart when divergence is detected.
Auto Support & Resistance on RSI:
Toggle Auto S&R (enableAutoSnR): Enable or disable automatic plotting of support and resistance levels.
Lookback Periods for Support/Resistance:
L1_lookback: Lookback period for level 1 (e.g., 34 bars).
L2_lookback: Lookback period for level 2 (e.g., 89 bars).
L3_lookback: Lookback period for level 3 (e.g., 200 bars).
Support and Resistance Colors:
rsiSupportClr: Color for the support line.
rsiResistanceClr: Color for the resistance line.
Alerts:
Divergence Alerts: Alert conditions are set up to notify the trader when bullish or bearish divergence is detected, aiding in timely decision-making.

AO/AC Trading Zones Strategy [Skyrexio] Overview
AO/AC Trading Zones Strategy leverages the combination of Awesome Oscillator (AO), Acceleration/Deceleration Indicator (AC), Williams Fractals, Williams Alligator and Exponential Moving Average (EMA) to obtain the high probability long setups. Moreover, strategy uses multi trades system, adding funds to long position if it considered that current trend has likely became stronger. Combination of AO and AC is used for creating so-called trading zones to create the signals, while Alligator and Fractal are used in conjunction as an approximation of short-term trend to filter them. At the same time EMA (default EMA's period = 100) is used as high probability long-term trend filter to open long trades only if it considers current price action as an uptrend. More information in "Methodology" and "Justification of Methodology" paragraphs. The strategy opens only long trades.
Unique Features
No fixed stop-loss and take profit: Instead of fixed stop-loss level strategy utilizes technical condition obtained by Fractals and Alligator to identify when current uptrend is likely to be over. In some special cases strategy uses AO and AC combination to trail profit (more information in "Methodology" and "Justification of Methodology" paragraphs)
Configurable Trading Periods: Users can tailor the strategy to specific market windows, adapting to different market conditions.
Multilayer trades opening system: strategy uses only 10% of capital in every trade and open up to 5 trades at the same time if script consider current trend as strong one.
Short and long term trend trade filters: strategy uses EMA as high probability long-term trend filter and Alligator and Fractal combination as a short-term one.
Methodology
The strategy opens long trade when the following price met the conditions:
1. Price closed above EMA (by default, period = 100). Crossover is not obligatory.
2. Combination of Alligator and Williams Fractals shall consider current trend as an upward (all details in "Justification of Methodology" paragraph)
3. Both AC and AO shall print two consecutive increasing values. At the price candle close which corresponds to this condition algorithm opens the first long trade with 10% of capital.
4. If combination of Alligator and Williams Fractals shall consider current trend has been changed from up to downtrend, all long trades will be closed, no matter how many trades has been opened.
5. If AO and AC both continue printing the rising values strategy opens the long trade on each candle close with 10% of capital while number of opened trades reaches 5.
6. If AO and AC both has printed 5 rising values in a row algorithm close all trades if candle's low below the low of the 5-th candle with rising AO and AC values in a row.
Script also has additional visuals. If second long trade has been opened simultaneously the Alligator's teeth line is plotted with the green color. Also for every trade in a row from 2 to 5 the label "Buy More" is also plotted just below the teeth line. With every next simultaneously opened trade the green color of the space between teeth and price became less transparent.
Strategy settings
In the inputs window user can setup strategy setting:
EMA Length (by default = 100, period of EMA, used for long-term trend filtering EMA calculation).
User can choose the optimal parameters during backtesting on certain price chart.
Justification of Methodology
Let's explore the key concepts of this strategy and understand how they work together. We'll begin with the simplest: the EMA.
The Exponential Moving Average (EMA) is a type of moving average that assigns greater weight to recent price data, making it more responsive to current market changes compared to the Simple Moving Average (SMA). This tool is widely used in technical analysis to identify trends and generate buy or sell signals. The EMA is calculated as follows:
1.Calculate the Smoothing Multiplier:
Multiplier = 2 / (n + 1), Where n is the number of periods.
2. EMA Calculation
EMA = (Current Price) × Multiplier + (Previous EMA) × (1 − Multiplier)
In this strategy, the EMA acts as a long-term trend filter. For instance, long trades are considered only when the price closes above the EMA (default: 100-period). This increases the likelihood of entering trades aligned with the prevailing trend.
Next, let’s discuss the short-term trend filter, which combines the Williams Alligator and Williams Fractals. Williams Alligator
Developed by Bill Williams, the Alligator is a technical indicator that identifies trends and potential market reversals. It consists of three smoothed moving averages:
Jaw (Blue Line): The slowest of the three, based on a 13-period smoothed moving average shifted 8 bars ahead.
Teeth (Red Line): The medium-speed line, derived from an 8-period smoothed moving average shifted 5 bars forward.
Lips (Green Line): The fastest line, calculated using a 5-period smoothed moving average shifted 3 bars forward.
When the lines diverge and align in order, the "Alligator" is "awake," signaling a strong trend. When the lines overlap or intertwine, the "Alligator" is "asleep," indicating a range-bound or sideways market. This indicator helps traders determine when to enter or avoid trades.
Fractals, another tool by Bill Williams, help identify potential reversal points on a price chart. A fractal forms over at least five consecutive bars, with the middle bar showing either:
Up Fractal: Occurs when the middle bar has a higher high than the two preceding and two following bars, suggesting a potential downward reversal.
Down Fractal: Happens when the middle bar shows a lower low than the surrounding two bars, hinting at a possible upward reversal.
Traders often use fractals alongside other indicators to confirm trends or reversals, enhancing decision-making accuracy.
How do these tools work together in this strategy? Let’s consider an example of an uptrend.
When the price breaks above an up fractal, it signals a potential bullish trend. This occurs because the up fractal represents a shift in market behavior, where a temporary high was formed due to selling pressure. If the price revisits this level and breaks through, it suggests the market sentiment has turned bullish.
The breakout must occur above the Alligator’s teeth line to confirm the trend. A breakout below the teeth is considered invalid, and the downtrend might still persist. Conversely, in a downtrend, the same logic applies with down fractals.
In this strategy if the most recent up fractal breakout occurs above the Alligator's teeth and follows the last down fractal breakout below the teeth, the algorithm identifies an uptrend. Long trades can be opened during this phase if a signal aligns. If the price breaks a down fractal below the teeth line during an uptrend, the strategy assumes the uptrend has ended and closes all open long trades.
By combining the EMA as a long-term trend filter with the Alligator and fractals as short-term filters, this approach increases the likelihood of opening profitable trades while staying aligned with market dynamics.
Now let's talk about the trading zones concept and its signals. To understand this we need to briefly introduce what is AO and AC. The Awesome Oscillator (AO), developed by Bill Williams, is a momentum indicator designed to measure market momentum by contrasting recent price movements with a longer-term historical perspective. It helps traders detect potential trend reversals and assess the strength of ongoing trends.
The formula for AO is as follows:
AO = SMA5(Median Price) − SMA34(Median Price)
where:
Median Price = (High + Low) / 2
SMA5 = 5-period Simple Moving Average of the Median Price
SMA 34 = 34-period Simple Moving Average of the Median Price
The Acceleration/Deceleration (AC) Indicator, introduced by Bill Williams, measures the rate of change in market momentum. It highlights shifts in the driving force of price movements and helps traders spot early signs of trend changes. The AC Indicator is particularly useful for identifying whether the current momentum is accelerating or decelerating, which can indicate potential reversals or continuations. For AC calculation we shall use the AO calculated above is the following formula:
AC = AO − SMA5(AO) , where SMA5(AO)is the 5-period Simple Moving Average of the Awesome Oscillator
When the AC is above the zero line and rising, it suggests accelerating upward momentum.
When the AC is below the zero line and falling, it indicates accelerating downward momentum.
When the AC is below zero line and rising it suggests the decelerating the downtrend momentum. When AC is above the zero line and falling, it suggests the decelerating the uptrend momentum.
Now let's discuss the trading zones concept and how it can create the signal. Zones are created by the combination of AO and AC. We can divide three zone types:
Greed zone: when the AO and AC both are rising
Red zone: when the AO and AC both are decreasing
Gray zone: when one of AO or AC is rising, the other is falling
Gray zone is considered as uncertainty. AC and AO are moving in the opposite direction. Strategy skip such price action to decrease the chance to stuck in the losing trade during potential sideways. Red zone is also not interesting for the algorithm because both indicators consider the trend as bearish, but strategy opens only long trades. It is waiting for the green zone to increase the chance to open trade in the direction of the potential uptrend. When we have 2 candles in a row in the green zone script executes a long trade with 10% of capital.
Two green zone candles in a row is considered by algorithm as a bullish trend, but now so strong, that's the reason why trade is going to be closed when the combination of Alligator and Fractals will consider the the trend change from bullish to bearish. If id did not happens, algorithm starts to count the green zone candles in a row. When we have 5 in a row script change the trade closing condition. Such situation is considered is a high probability strong bull market and all trades will be closed if candle's low will be lower than fifth green zone candle's low. This is used to increase probability to secure the profit. If long trades are initiated, the strategy continues utilizing subsequent signals until the total number of trades reaches a maximum of 5. Each trade uses 10% of capital.
Why we use trading zones signals? If currently strategy algorithm considers the high probability of the short-term uptrend with the Alligator and Fractals combination pointed out above and the long-term trend is also suggested by the EMA filter as bullish. Rising AC and AO values in the direction of the most likely main trend signaling that we have the high probability of the fastest bullish phase on the market. The main idea is to take part in such rapid moves and add trades if this move continues its acceleration according to indicators.
Backtest Results
Operating window: Date range of backtests is 2023.01.01 - 2024.12.31. It is chosen to let the strategy to close all opened positions.
Commission and Slippage: Includes a standard Binance commission of 0.1% and accounts for possible slippage over 5 ticks.
Initial capital: 10000 USDT
Percent of capital used in every trade: 10%
Maximum Single Position Loss: -9.49%
Maximum Single Profit: +24.33%
Net Profit: +4374.70 USDT (+43.75%)
Total Trades: 278 (39.57% win rate)
Profit Factor: 2.203
Maximum Accumulated Loss: 668.16 USDT (-5.43%)
Average Profit per Trade: 15.74 USDT (+1.37%)
Average Trade Duration: 60 hours
How to Use
Add the script to favorites for easy access.
Apply to the desired timeframe and chart (optimal performance observed on 4h BTC/USDT).
Configure settings using the dropdown choice list in the built-in menu.
Set up alerts to automate strategy positions through web hook with the text: {{strategy.order.alert_message}}
Disclaimer:
Educational and informational tool reflecting Skyrex commitment to informed trading. Past performance does not guarantee future results. Test strategies in a simulated environment before live implementation
These results are obtained with realistic parameters representing trading conditions observed at major exchanges such as Binance and with realistic trading portfolio usage parameters.

On Balance Volume with Cross DetectionThis indicator enhances the On Balance Volume (OBV) indicator by detecting and visually highlighting crossovers and crossunders between the OBV and its smoothed moving average. The script colors the background of the chart to make these key events more noticeable: red highlights a bearish crossunder when the OBV crosses below the smoothed OBV, while green marks a bullish crossover when the OBV crosses above the smoothed OBV. By focusing on these significant interactions, the script provides traders with a clear visual cue to help identify potential buying and selling opportunities based on the relationship between OBV and its smoothed trend.
This script offers several customizable features to suit different trading preferences. The main editable parameter is the type of moving average used to smooth the OBV: you can choose from options such as Simple Moving Average (SMA), Exponential Moving Average (EMA), Smoothed Moving Average (RMA), Weighted Moving Average (WMA), or Volume Weighted Moving Average (VWMA). The length of the moving average can also be adjusted to better match the trader’s desired sensitivity, with the default set to 14 periods. These options allow traders to tailor the script to their preferred smoothing method and time frame, making it a flexible tool for a variety of strategies. The ability to switch between different moving averages and adjust their lengths ensures that the script can be adapted to various market conditions and trading styles.
This indicator enhances the analysis of the On Balance Volume (OBV) indicator by visually highlighting key crossovers and crossunders with its smoothed moving average. With customizable settings for different moving averages and lengths, traders can tailor the script to their specific strategies. By offering clear visual cues through background coloring, it helps quickly identify potential buy and sell signals. When combined with other technical analysis tools, this script can further improve trading decisions by providing additional context and confirmation, allowing traders to create a more robust and comprehensive trading strategy.

Arrow-SimplyTrade vol1.5-FinalTitle: Arrow-SimplyTrade vol1.5-Final
Description:
This advanced trading indicator is designed to assist traders in analyzing market trends and identifying optimal entry signals. It combines several popular technical analysis tools and strategies, including EMA (Exponential Moving Average), MA (Simple Moving Averages), Bollinger Bands, and candlestick patterns. This indicator provides both trend-following and counter-trend signals, making it suitable for various trading styles, such as scalping and swing trading.
Main Features:
EMA (Exponential Moving Average):
EMA200 is the main trend line that helps determine the overall market direction. When the price is above EMA200, the trend is considered bullish, and when the price is below EMA200, the trend is considered bearish.
It helps filter out signals that go against the prevailing market trend.
Simple Moving Averages (MA5 and MA15):
This indicator uses two Simple Moving Averages: MA5 (Fast) and MA15 (Slow). Their crossovers create buy or sell signals:
Buy Signal: When MA5 crosses above MA15, signaling a potential upward trend.
Sell Signal: When MA5 crosses below MA15, signaling a potential downward trend.
Bollinger Bands:
Bollinger Bands measure market volatility and can identify periods of overbought or oversold conditions. The Upper and Lower Bands help detect potential breakout points, while the Middle Line (Basis) serves as dynamic support or resistance.
This tool is particularly useful for identifying volatile conditions and potential reversals.
Arrows:
The indicator plots arrows on the chart to signal entry opportunities:
Green Arrows signal buy opportunities (when MA5 crosses above MA15 and price is above EMA200).
Red Arrows signal sell opportunities (when MA5 crosses below MA15 and price is below EMA200).
Opposite Arrows: Optionally, the indicator can also display arrows for counter-trend signals, triggered by MA5 and MA15 crossovers, regardless of the price's position relative to EMA200.
Candlestick Patterns:
The indicator detects popular candlestick patterns such as Bullish Engulfing, Bearish Engulfing, Hammer, and Doji.
These patterns are important for confirming entry points or anticipating trend reversals.
How to Use:
EMA200: The main trend line. If the price is above EMA200, consider long positions. If the price is below EMA200, consider short positions.
MA5 and MA15: Short-term trend indicators. The crossover of these averages generates buy or sell signals.
Bollinger Bands: Use these bands to spot overbought/oversold conditions. Breakouts from the bands may signal potential entry points.
Arrows: Green arrows represent buy signals, and red arrows represent sell signals. Opposite direction arrows can be used for counter-trend strategies.
Candlestick Patterns: Patterns like Bullish Engulfing or Doji can help confirm the signals.
Customizable Settings:
Fully customizable colors, line styles, and display settings for EMA, MAs, Bollinger Bands, and arrows.
The Candlestick Patterns feature can be toggled on or off based on user preference.
Important Notes:
This indicator is intended to be used in conjunction with other analysis tools.
Past performance does not guarantee future results.
Polish:
Tytuł: Arrow-SimplyTrade vol1.5-Final
Opis:
Ten zaawansowany wskaźnik handlowy jest zaprojektowany, aby pomóc traderom w analizie trendów rynkowych oraz identyfikowaniu optymalnych sygnałów wejścia. Łączy w sobie kilka popularnych narzędzi analizy technicznej i strategii, w tym EMA (Wykładnicza Średnia Ruchoma), MA (Prosta Średnia Ruchoma), Bollinger Bands oraz formacje świecowe. Wskaźnik generuje zarówno sygnały podążające za trendem, jak i przeciwnym trendowi, co sprawia, że jest odpowiedni do różnych stylów handlu, takich jak scalping oraz swing trading.
Główne Funkcje:
EMA (Wykładnicza Średnia Ruchoma):
EMA200 to główna linia trendu, która pomaga określić ogólny kierunek rynku. Gdy cena znajduje się powyżej EMA200, trend jest uznawany za wzrostowy, a gdy poniżej EMA200, za spadkowy.
Pomaga to filtrować sygnały, które są niezgodne z głównym trendem rynkowym.
Proste Średnie Ruchome (MA5 i MA15):
Wskaźnik używa dwóch Prostych Średnich Ruchomych: MA5 (szybka) oraz MA15 (wolna). Ich przecięcia generują sygnały kupna lub sprzedaży:
Sygnał Kupna: Kiedy MA5 przecina MA15 od dołu, sygnalizując potencjalny wzrost.
Sygnał Sprzedaży: Kiedy MA5 przecina MA15 od góry, sygnalizując potencjalny spadek.
Bollinger Bands:
Bollinger Bands mierzą zmienność rynku i mogą pomóc w identyfikowaniu okresów wykupienia lub wyprzedania rynku. Górna i dolna linia pomagają wykrywać punkty wybicia, a Środkowa Linia (Basis) działa jako dynamiczny poziom wsparcia lub oporu.
Narzędzie to jest szczególnie przydatne w wykrywaniu warunków zmienności i potencjalnych odwróceń trendu.
Strzałki:
Wskaźnik wyświetla strzałki na wykresie, które wskazują sygnały kupna i sprzedaży:
Zielona strzałka wskazuje sygnał kupna (gdy MA5 przecina MA15 i cena jest powyżej EMA200).
Czerwona strzałka wskazuje sygnał sprzedaży (gdy MA5 przecina MA15 i cena jest poniżej EMA200).
Strzałki w przeciwnym kierunku: Opcjonalna funkcja, która pokazuje strzałki w przeciwnym kierunku, uruchamiane przez przecięcia MA5 i MA15, niezależnie od pozycji ceny względem EMA200.
Formacje Świecowe:
Wskaźnik wykrywa popularne formacje świecowe, takie jak Bullish Engulfing, Bearish Engulfing, Hammer oraz Doji.
Formacje te pomagają traderom potwierdzić punkty wejścia i przewidzieć możliwe odwrócenia trendu.
Jak Używać:
EMA200: Główna linia trendu. Jeśli cena jest powyżej EMA200, rozważaj pozycje długie. Jeśli cena jest poniżej EMA200, rozważaj pozycje krótkie.
MA5 i MA15: Śledzą krótkoterminowe zmiany trendu. Przecięcia tych średnich generują sygnały kupna lub sprzedaży.
Bollinger Bands: Używaj tych pasm do wykrywania wykupionych lub wyprzedanych warunków. Wybicia z pasm mogą wskazywać potencjalne punkty wejścia.
Strzałki: Zielona strzałka wskazuje sygnał kupna, a czerwona strzałka sygnał sprzedaży. Strzałki w przeciwnym kierunku mogą być używane do strategii przeciwtrendowych.
Formacje Świecowe: Formacje takie jak Bullish Engulfing czy Doji mogą pomóc w potwierdzaniu sygnałów.
Ustawienia Personalizacji:
W pełni personalizowalne kolory, style linii i ustawienia wyświetlania dla EMA, MAs, Bollinger Bands oraz strzałek.
Funkcja Formacji Świecowych może być włączana lub wyłączana według preferencji użytkownika.
Ważne Uwagi:
Ten wskaźnik powinien być używany w połączeniu z innymi narzędziami analizy rynku.
Wyniki z przeszłości nie gwarantują wyników w przyszłości.
