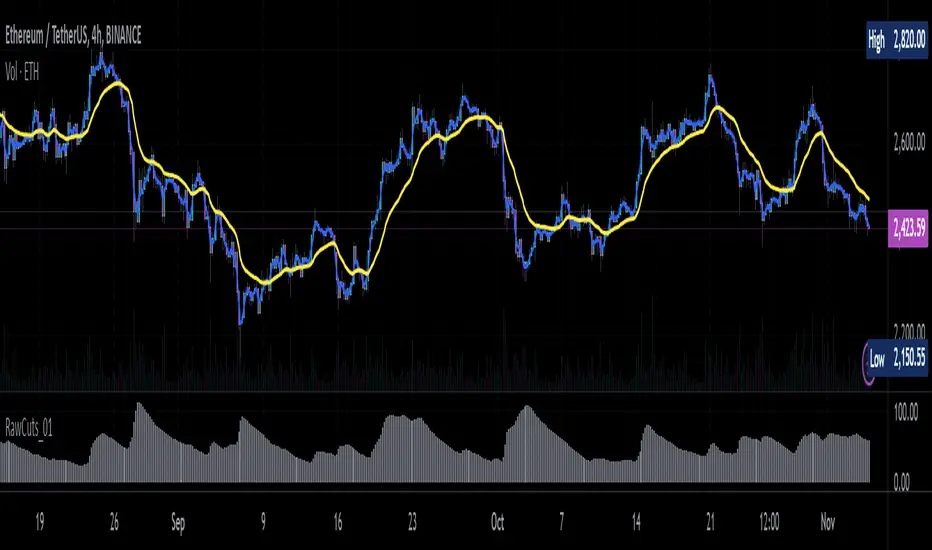
RawCuts_01Library "RawCuts_01"
A collection of functions by:
mutantdog
The majority of these are used within published projects, some useful variants have been included here aswell.
This is volume one consisting mainly of smaller functions, predominantly the filters and standard deviations from Weight Gain 4000.
Also included at the bottom are various snippets of related code for demonstration. These can be copied and adjusted according to your needs.
A full up-to-date table of contents is located at the top of the main script.
WEIGHT GAIN FILTERS
A collection of moving average type filters with adjustable volume weighting.
Based upon the two most common methods of volume weighting.
'Simple' uses the standard method in which a basic VWMA is analogous to SMA.
'Elastic' uses exponential method found in EVWMA which is analogous to RMA.
Volume weighting is applied according to an exponent multiplier of input volume.
0 >> volume^0 (unweighted), 1 >> volume^1 (fully weighted), use float values for intermediate weighting.
Additional volume filter switch for smoothing of outlier events.
DIVA MODULAR DEVIATIONS
A small collection of standard and absolute deviations.
Includes the weightgain functionality as above.
Basic modular functionality for more creative uses.
Optional input (ct) for external central tendency (aka: estimator).
Can be assigned to alternative filter or any float value. Will default to internal filter when no ct input is received.
Some other useful or related functions included at the bottom along with basic demonstration use.
weightgain_sma(src, len, xVol, fVol)
Simple Moving Average (SMA): Weight Gain (Simple Volume).
Parameters:
src (float) : Source input.
len (int) : Length (number of bars).
xVol (float) : Volume exponent multiplier (0 = unweighted, 1 = fully weighted).
fVol (bool) : Volume smoothing filter.
Returns: Standard Simple Moving Average with Simple Weight Gain applied.
weightgain_hsma(src, len, xVol, fVol)
Harmonic Simple Moving Average (hSMA): Weight Gain (Simple Volume).
Parameters:
src (float) : Source input.
len (int) : Length (number of bars).
xVol (float) : Volume exponent multiplier (0 = unweighted, 1 = fully weighted).
fVol (bool) : Volume smoothing filter.
Returns: Harmonic Simple Moving Average with Simple Weight Gain applied.
weightgain_gsma(src, len, xVol, fVol)
Geometric Simple Moving Average (gSMA): Weight Gain (Simple Volume).
Parameters:
src (float) : Source input.
len (int) : Length (number of bars).
xVol (float) : Volume exponent multiplier (0 = unweighted, 1 = fully weighted).
fVol (bool) : Volume smoothing filter.
Returns: Geometric Simple Moving Average with Simple Weight Gain applied.
weightgain_wma(src, len, xVol, fVol)
Linear Weighted Moving Average (WMA): Weight Gain (Simple Volume).
Parameters:
src (float) : Source input.
len (int) : Length (number of bars).
xVol (float) : Volume exponent multiplier (0 = unweighted, 1 = fully weighted).
fVol (bool) : Volume smoothing filter.
Returns: Basic Linear Weighted Moving Average with Simple Weight Gain applied.
weightgain_hma(src, len, xVol, fVol)
Hull Moving Average (HMA): Weight Gain (Simple Volume).
Parameters:
src (float) : Source input.
len (int) : Length (number of bars).
xVol (float) : Volume exponent multiplier (0 = unweighted, 1 = fully weighted).
fVol (bool) : Volume smoothing filter.
Returns: Basic Hull Moving Average with Simple Weight Gain applied.
diva_sd_sma(src, len, xVol, fVol, ct)
Standard Deviation (SD SMA): Diva / Weight Gain (Simple Volume)
Parameters:
src (float) : Source input.
len (int) : Length (number of bars).
xVol (float) : Volume exponent multiplier (0 = unweighted, 1 = fully weighted).
fVol (bool) : Volume smoothing filter.
ct (float) : Central tendency (optional, na = bypass). Internal: weightgain_sma().
Returns:
diva_sd_wma(src, len, xVol, fVol, ct)
Standard Deviation (SD WMA): Diva / Weight Gain (Simple Volume).
Parameters:
src (float) : Source input.
len (int) : Length (number of bars).
xVol (float) : Volume exponent multiplier (0 = unweighted, 1 = fully weighted).
fVol (bool) : Volume smoothing filter.
ct (float) : Central tendency (optional, na = bypass). Internal: weightgain_wma().
Returns:
diva_aad_sma(src, len, xVol, fVol, ct)
Average Absolute Deviation (AAD SMA): Diva / Weight Gain (Simple Volume).
Parameters:
src (float) : Source input.
len (int) : Length (number of bars).
xVol (float) : Volume exponent multiplier (0 = unweighted, 1 = fully weighted).
fVol (bool) : Volume smoothing filter.
ct (float) : Central tendency (optional, na = bypass). Internal: weightgain_sma().
Returns:
diva_aad_wma(src, len, xVol, fVol, ct)
Average Absolute Deviation (AAD WMA): Diva / Weight Gain (Simple Volume) .
Parameters:
src (float) : Source input.
len (int) : Length (number of bars).
xVol (float) : Volume exponent multiplier (0 = unweighted, 1 = fully weighted).
fVol (bool) : Volume smoothing filter.
ct (float) : Central tendency (optional, na = bypass). Internal: weightgain_wma().
Returns:
weightgain_ema(src, len, xVol, fVol)
Exponential Moving Average (EMA): Weight Gain (Elastic Volume).
Parameters:
src (float) : Source input.
len (int) : Length (number of bars).
xVol (float) : Volume exponent multiplier (0 = unweighted, 1 = fully weighted).
fVol (bool) : Volume smoothing filter.
Returns: Exponential Moving Average with Elastic Weight Gain applied.
weightgain_dema(src, len, xVol, fVol)
Double Exponential Moving Average (DEMA): Weight Gain (Elastic Volume).
Parameters:
src (float) : Source input.
len (int) : Length (number of bars).
xVol (float) : Volume exponent multiplier (0 = unweighted, 1 = fully weighted).
fVol (bool) : Volume smoothing filter.
Returns: Double Exponential Moving Average with Elastic Weight Gain applied.
weightgain_tema(src, len, xVol, fVol)
Triple Exponential Moving Average (TEMA): Weight Gain (Elastic Volume).
Parameters:
src (float) : Source input.
len (int) : Length (number of bars).
xVol (float) : Volume exponent multiplier (0 = unweighted, 1 = fully weighted).
fVol (bool) : Volume smoothing filter.
Returns: Triple Exponential Moving Average with Elastic Weight Gain applied.
weightgain_rma(src, len, xVol, fVol)
Rolling Moving Average (RMA): Weight Gain (Elastic Volume).
Parameters:
src (float) : Source input.
len (int) : Length (number of bars).
xVol (float) : Volume exponent multiplier (0 = unweighted, 1 = fully weighted).
fVol (bool) : Volume smoothing filter.
Returns: Rolling Moving Average with Elastic Weight Gain applied.
weightgain_drma(src, len, xVol, fVol)
Double Rolling Moving Average (DRMA): Weight Gain (Elastic Volume).
Parameters:
src (float) : Source input.
len (int) : Length (number of bars).
xVol (float) : Volume exponent multiplier (0 = unweighted, 1 = fully weighted).
fVol (bool) : Volume smoothing filter.
Returns: Double Rolling Moving Average with Elastic Weight Gain applied.
weightgain_trma(src, len, xVol, fVol)
Triple Rolling Moving Average (TRMA): Weight Gain (Elastic Volume).
Parameters:
src (float) : Source input.
len (int) : Length (number of bars).
xVol (float) : Volume exponent multiplier (0 = unweighted, 1 = fully weighted).
fVol (bool) : Volume smoothing filter.
Returns: Triple Rolling Moving Average with Elastic Weight Gain applied.
diva_sd_ema(src, len, xVol, fVol, ct)
Standard Deviation (SD EMA): Diva / Weight Gain: (Elastic Volume).
Parameters:
src (float) : Source input.
len (int) : Length (number of bars).
xVol (float) : Volume exponent multiplier (0 = unweighted, 1 = fully weighted).
fVol (bool) : Volume smoothing filter.
ct (float) : Central tendency (optional, na = bypass). Internal: weightgain_ema().
Returns:
diva_sd_rma(src, len, xVol, fVol, ct)
Standard Deviation (SD RMA): Diva / Weight Gain: (Elastic Volume).
Parameters:
src (float) : Source input.
len (int) : Length (number of bars).
xVol (float) : Volume exponent multiplier (0 = unweighted, 1 = fully weighted).
fVol (bool) : Volume smoothing filter.
ct (float) : Central tendency (optional, na = bypass). Internal: weightgain_rma().
Returns:
weightgain_vidya_rma(src, len, xVol, fVol)
VIDYA v1 RMA base (VIDYA-RMA): Weight Gain (Elastic Volume).
Parameters:
src (float) : Source input.
len (int) : Length (number of bars).
xVol (float) : Volume exponent multiplier (0 = unweighted, 1 = fully weighted).
fVol (bool) : Volume smoothing filter.
Returns: VIDYA v1, RMA base with Elastic Weight Gain applied.
weightgain_vidya_ema(src, len, xVol, fVol)
VIDYA v1 EMA base (VIDYA-EMA): Weight Gain (Elastic Volume).
Parameters:
src (float) : Source input.
len (int) : Length (number of bars).
xVol (float) : Volume exponent multiplier (0 = unweighted, 1 = fully weighted).
fVol (bool) : Volume smoothing filter.
Returns: VIDYA v1, EMA base with Elastic Weight Gain applied.
diva_sd_vidya_rma(src, len, xVol, fVol, ct)
Standard Deviation (SD VIDYA-RMA): Diva / Weight Gain: (Elastic Volume).
Parameters:
src (float) : Source input.
len (int) : Length (number of bars).
xVol (float) : Volume exponent multiplier (0 = unweighted, 1 = fully weighted).
fVol (bool) : Volume smoothing filter.
ct (float) : Central tendency (optional, na = bypass). Internal: weightgain_vidya_rma().
Returns:
diva_sd_vidya_ema(src, len, xVol, fVol, ct)
Standard Deviation (SD VIDYA-EMA): Diva / Weight Gain: (Elastic Volume).
Parameters:
src (float) : Source input.
len (int) : Length (number of bars).
xVol (float) : Volume exponent multiplier (0 = unweighted, 1 = fully weighted).
fVol (bool) : Volume smoothing filter.
ct (float) : Central tendency (optional, na = bypass). Internal: weightgain_vidya_ema().
Returns:
weightgain_sema(src, len, xVol, fVol)
Parameters:
src (float)
len (simple int)
xVol (float)
fVol (bool)
diva_sd_sema(src, len, xVol, fVol)
Parameters:
src (float)
len (simple int)
xVol (float)
fVol (bool)
diva_mad_mm(src, len, ct)
Median Absolute Deviation (MAD MM): Diva (no volume weighting).
Parameters:
src (float) : Source input.
len (int) : Length (number of bars).
ct (float) : Central tendency (optional, na = bypass). Internal: ta.median()
Returns:
source_switch(slct, aux1, aux2, aux3, aux4)
Custom Source Selector/Switch function. Features standard & custom 'weighted' sources with additional aux inputs.
Parameters:
slct (string) : Choose from custom set of string values.
aux1 (float) : Additional input for user-defined source, eg: standard input.source(). Optional, use na to bypass.
aux2 (float) : Additional input for user-defined source, eg: standard input.source(). Optional, use na to bypass.
aux3 (float) : Additional input for user-defined source, eg: standard input.source(). Optional, use na to bypass.
aux4 (float) : Additional input for user-defined source, eg: standard input.source(). Optional, use na to bypass.
Returns: Float value, to be used as src input for other functions.
colour_gradient_ma_div(ma1, ma2, div, bull, bear, mid, mult)
Colour Gradient for plot fill between two moving averages etc, with seperate bull/bear and divergence strength.
Parameters:
ma1 (float) : Input for fast moving average (eg: bullish when above ma2).
ma2 (float) : Input for slow moving average (eg: bullish when below ma1).
div (float) : Input deviation/divergence value used to calculate strength of colour.
bull (color) : Colour when ma1 above ma2.
bear (color) : Colour when ma1 below ma2.
mid (color) : Neutral colour when ma1 = ma2.
mult (int) : Opacity multiplier. 100 = maximum, 0 = transparent.
Returns: Colour with transparency (according to specified inputs)
Cerca negli script per "Exponential"
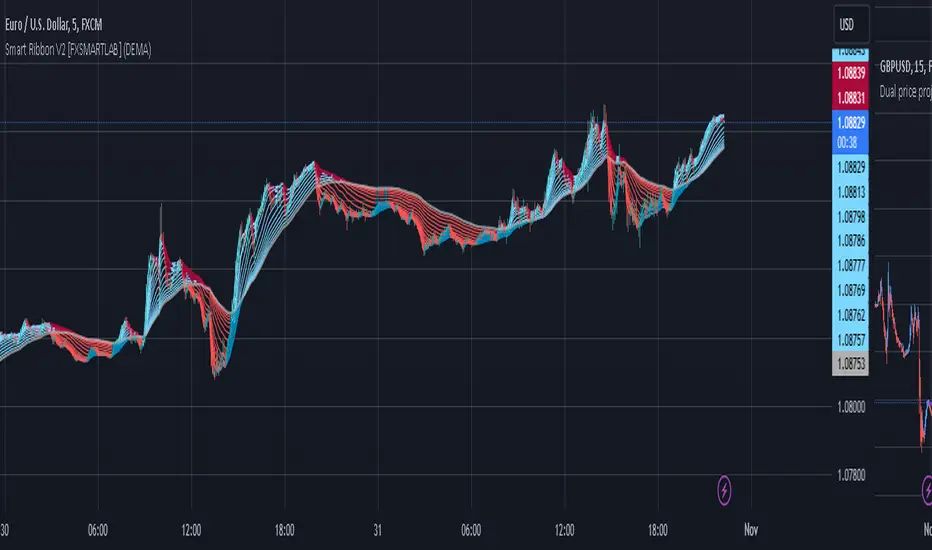
Smart Ribbon V2 [FXSMARTLAB]The Smart Ribbon V2 indicator is designed to analyze market trends and momentum by plotting a series of moving averages with varying periods, all within a single overlay on the price chart. This approach creates a "ribbon" effect, enabling traders to visualize trend strength, reversals, and potential entry or exit points. The indicator provides flexibility through different moving average types, including some advanced ones like QUEMA (Quadruple Exponential Moving Average) and QuintEMA (Quintuple Exponential Moving Average). Each moving average is color-coded to indicate trend direction and momentum, making it visually intuitive and effective for quick decision-making in trend-following strategies.
The Smart Ribbon V2 helps traders:
Identify Trend Direction
Gauge Momentum
Spot Trend Reversals
Determine Entry and Exit Points
Detailed Explanation of QUEMA and QuintEMA
The QUEMA (Quadruple Exponential Moving Average) and QuintEMA (Quintuple Exponential Moving Average) are advanced smoothing techniques that build on traditional exponential moving averages (EMAs). Both offer higher sensitivity to recent price changes than standard EMAs by adding layers of exponential smoothing. These moving averages are particularly useful for traders looking for a more responsive indicator without the noise often present in shorter-period EMAs.
QUEMA (Quadruple Exponential Moving Average)
The QUEMA is calculated by applying the EMA calculation four times in succession. This method smooths out fluctuations in the price data, creating a balance between sensitivity to recent data and resistance to short-term noise.
The mathematical formula for QUEMA is:
QUEMA=4×EMA1−6×EMA2+4×EMA3−EMA4
This formula results in a moving average that is smoother than a triple EMA (TEMA) and provides a better response to price trends without excessive lag.
QuintEMA (Quintuple Exponential Moving Average)
The QuintEMA goes one step further by applying the EMA calculation five times in a row. This level of exponential smoothing is useful for identifying strong, persistent trends while remaining adaptive to recent price shifts.
The QuintEMA is calculated as :
QuintEMA=5×EMA1−10×EMA2+10×EMA3−5×EMA4+EMA5
The additional layer in QuintEMA further reduces the impact of short-term price fluctuations, making it especially useful in strongly trending markets.
The Smart Ribbon V2 combines the benefits of several moving average types to deliver a versatile tool for analyzing market trends, momentum, and potential reversals. With QUEMA and QuintEMA as advanced options, it allows traders to tailor the indicator to match their preferred trading style, whether it involves higher responsiveness or smoother trend visualization. This adaptability makes Smart Ribbon V2 a powerful choice for both novice and experienced traders seeking to improve their trend-following and market analysis strategies.
Adaptive Fisherized Z-scoreHello Fellas,
It's time for a new adaptive fisherized indicator of me, where I apply adaptive length and more on a classic indicator.
Today, I chose the Z-score, also called standard score, as indicator of interest.
Special Features
Advanced Smoothing: JMA, T3, Hann Window and Super Smoother
Adaptive Length Algorithms: In-Phase Quadrature, Homodyne Discriminator, Median and Hilbert Transform
Inverse Fisher Transform (IFT)
Signals: Enter Long, Enter Short, Exit Long and Exit Short
Bar Coloring: Presents the trade state as bar colors
Band Levels: Changes the band levels
Decision Making
When you create such a mod you need to think about which concepts are the best to conclude. I decided to take Inverse Fisher Transform instead of normalization to make a version which fits to a fixed scale to avoid the usual distortion created by normalization.
Moreover, I chose JMA, T3, Hann Window and Super Smoother, because JMA and T3 are the bleeding-edge MA's at the moment with the best balance of lag and responsiveness. Additionally, I chose Hann Window and Super Smoother because of their extraordinary smoothing capabilities and because Ehlers favours them.
Furthermore, I decided to choose the half length of the dominant cycle instead of the full dominant cycle to make the indicator more responsive which is very important for a signal emitter like Z-score. Signal emitters always need to be faster or have the same speed as the filters they are combined with.
Usage
The Z-score is a low timeframe scalper which works best during choppy/ranging phases. The direction you should trade is determined by the last trend change. E.g. when the last trend change was from bearish market to bullish market and you are now in a choppy/ranging phase confirmed by e.g. Chop Zone or KAMA slope you want to do long trades.
Interpretation
The Z-score indicator is a momentum indicator which shows the number of standard deviations by which the value of a raw score (price/source) is above or below the mean value of what is being observed or measured. Easily explained, it is almost the same as Bollinger Bands with another visual representation form.
Signals
B -> Buy -> Z-score crosses above lower band
S -> Short -> Z-score crosses below upper band
BE -> Buy Exit -> Z-score crosses above 0
SE -> Sell Exit -> Z-score crosses below 0
If you were reading till here, thank you already. Now, follows a bunch of knowledge for people who don't know the concepts I talk about.
T3
The T3 moving average, short for "Tim Tillson's Triple Exponential Moving Average," is a technical indicator used in financial markets and technical analysis to smooth out price data over a specific period. It was developed by Tim Tillson, a software project manager at Hewlett-Packard, with expertise in Mathematics and Computer Science.
The T3 moving average is an enhancement of the traditional Exponential Moving Average (EMA) and aims to overcome some of its limitations. The primary goal of the T3 moving average is to provide a smoother representation of price trends while minimizing lag compared to other moving averages like Simple Moving Average (SMA), Weighted Moving Average (WMA), or EMA.
To compute the T3 moving average, it involves a triple smoothing process using exponential moving averages. Here's how it works:
Calculate the first exponential moving average (EMA1) of the price data over a specific period 'n.'
Calculate the second exponential moving average (EMA2) of EMA1 using the same period 'n.'
Calculate the third exponential moving average (EMA3) of EMA2 using the same period 'n.'
The formula for the T3 moving average is as follows:
T3 = 3 * (EMA1) - 3 * (EMA2) + (EMA3)
By applying this triple smoothing process, the T3 moving average is intended to offer reduced noise and improved responsiveness to price trends. It achieves this by incorporating multiple time frames of the exponential moving averages, resulting in a more accurate representation of the underlying price action.
JMA
The Jurik Moving Average (JMA) is a technical indicator used in trading to predict price direction. Developed by Mark Jurik, it’s a type of weighted moving average that gives more weight to recent market data rather than past historical data.
JMA is known for its superior noise elimination. It’s a causal, nonlinear, and adaptive filter, meaning it responds to changes in price action without introducing unnecessary lag. This makes JMA a world-class moving average that tracks and smooths price charts or any market-related time series with surprising agility.
In comparison to other moving averages, such as the Exponential Moving Average (EMA), JMA is known to track fast price movement more accurately. This allows traders to apply their strategies to a more accurate picture of price action.
Inverse Fisher Transform
The Inverse Fisher Transform is a transform used in DSP to alter the Probability Distribution Function (PDF) of a signal or in our case of indicators.
The result of using the Inverse Fisher Transform is that the output has a very high probability of being either +1 or –1. This bipolar probability distribution makes the Inverse Fisher Transform ideal for generating an indicator that provides clear buy and sell signals.
Hann Window
The Hann function (aka Hann Window) is named after the Austrian meteorologist Julius von Hann. It is a window function used to perform Hann smoothing.
Super Smoother
The Super Smoother uses a special mathematical process for the smoothing of data points.
The Super Smoother is a technical analysis indicator designed to be smoother and with less lag than a traditional moving average.
Adaptive Length
Length based on the dominant cycle length measured by a "dominant cycle measurement" algorithm.
Happy Trading!
Best regards,
simwai
---
Credits to
@cheatcountry
@everget
@loxx
@DasanC
@blackcat1402

Goertzel Adaptive JMA T3Hello Fellas,
The Goertzel Adaptive JMA T3 is a powerful indicator that combines my own created Goertzel adaptive length with Jurik and T3 Moving Averages. The primary intention of the indicator is to demonstrate the new adaptive length algorithm by applying it on bleeding-edge MAs.
It is useable like any moving average, and the new Goertzel adaptive length algorithm can be used to make own indicators Goertzel adaptive.
Used Adaptive Length Algorithms
Normalized Goertzel Power: This uses the normalized power of the Goertzel algorithm to compute an adaptive length without the special operations, like detrending, Ehlers uses for his DFT adaptive length.
Ehlers Mod: This uses the Goertzel algorithm instead of the DFT, originally used by Ehlers, to compute a modified version of his original approach, which sticks as close as possible to the original approach.
Scoring System
The scoring system determines if bars are red or green and collects them.
Then, it goes through all collected red and green bars and checks how big they are and if they are above or below the selected MA. It is positive when green bars are under MA or when red bars are above MA.
Then, it accumulates the size for all positive green bars and for all positive red bars. The same happens for negative green and red bars.
Finally, it calculates the score by ((positiveGreenBars + positiveRedBars) / (negativeGreenBars + negativeRedBars)) * 100 with the scale 0–100.
Signals
Is the price above MA? -> bullish market
Is the price below MA? -> bearish market
Usage
Adjust the settings to reach the highest score, and enjoy an outstanding adaptive MA.
It should be useable on all timeframes. It is recommended to use the indicator on the timeframe where you can get the highest score.
Now, follows a bunch of knowledge for people who don't know about the concepts used here.
T3
The T3 moving average, short for "Tim Tillson's Triple Exponential Moving Average," is a technical indicator used in financial markets and technical analysis to smooth out price data over a specific period. It was developed by Tim Tillson, a software project manager at Hewlett-Packard, with expertise in Mathematics and Computer Science.
The T3 moving average is an enhancement of the traditional Exponential Moving Average (EMA) and aims to overcome some of its limitations. The primary goal of the T3 moving average is to provide a smoother representation of price trends while minimizing lag compared to other moving averages like Simple Moving Average (SMA), Weighted Moving Average (WMA), or EMA.
To compute the T3 moving average, it involves a triple smoothing process using exponential moving averages. Here's how it works:
Calculate the first exponential moving average (EMA1) of the price data over a specific period 'n.'
Calculate the second exponential moving average (EMA2) of EMA1 using the same period 'n.'
Calculate the third exponential moving average (EMA3) of EMA2 using the same period 'n.'
The formula for the T3 moving average is as follows:
T3 = 3 * (EMA1) - 3 * (EMA2) + (EMA3)
By applying this triple smoothing process, the T3 moving average is intended to offer reduced noise and improved responsiveness to price trends. It achieves this by incorporating multiple time frames of the exponential moving averages, resulting in a more accurate representation of the underlying price action.
JMA
The Jurik Moving Average (JMA) is a technical indicator used in trading to predict price direction. Developed by Mark Jurik, it’s a type of weighted moving average that gives more weight to recent market data rather than past historical data.
JMA is known for its superior noise elimination. It’s a causal, nonlinear, and adaptive filter, meaning it responds to changes in price action without introducing unnecessary lag. This makes JMA a world-class moving average that tracks and smooths price charts or any market-related time series with surprising agility.
In comparison to other moving averages, such as the Exponential Moving Average (EMA), JMA is known to track fast price movement more accurately. This allows traders to apply their strategies to a more accurate picture of price action.
Goertzel Algorithm
The Goertzel algorithm is a technique in digital signal processing (DSP) for efficient evaluation of individual terms of the Discrete Fourier Transform (DFT). It's particularly useful when you need to compute a small number of selected frequency components. Unlike direct DFT calculations, the Goertzel algorithm applies a single real-valued coefficient at each iteration, using real-valued arithmetic for real-valued input sequences. This makes it more numerically efficient when computing a small number of selected frequency components¹.
Discrete Fourier Transform
The Discrete Fourier Transform (DFT) is a mathematical technique used in signal processing to convert a finite sequence of equally-spaced samples of a function into a same-length sequence of equally-spaced samples of the discrete-time Fourier transform (DTFT), which is a complex-valued function of frequency . The DFT provides a frequency domain representation of the original input sequence .
Usage of DFT/Goertzel In Adaptive Length Algorithms
Adaptive length algorithms are automated trading systems that can dynamically adjust their parameters in response to real-time market data. This adaptability enables them to optimize their trading strategies as market conditions fluctuate. Both the Goertzel algorithm and DFT can be used in these algorithms to analyze market data and detect cycles or patterns, which can then be used to adjust the parameters of the trading strategy.
The Goertzel algorithm is more efficient than the DFT when you need to compute a small number of selected frequency components. However, for covering a full spectrum, the Goertzel algorithm has a higher order of complexity than fast Fourier transform (FFT) algorithms.
I hope this can help you somehow.
Thanks for reading, and keep it up.
Best regards,
simwai
---
Credits to:
@ClassicScott
@yatrader2
@cheatcountry
@loxx

Goldmine Wealth Builder - DKK/SKKGoldmine Wealth Builder
Version 1.0
Introduction to Long-Term Investment Strategies: DKK, SKK1 and SKK2
In the dynamic realm of long-term investing, the DKK, SKK1, and SKK2 strategies stand as valuable pillars. These strategies, meticulously designed to assist investors in building robust portfolios, combine the power of Super Trend, RSI (Relative Strength Index), Exponential Moving Averages (EMAs), and their crossovers. By providing clear alerts and buy signals on a daily time frame, they equip users with the tools needed to make well-informed investment decisions and navigate the complexities of the financial markets. These strategies offer a versatile and structured approach to both conservative and aggressive investment, catering to the diverse preferences and objectives of investors.
Each part of this strategy provides a unique perspective and approach to the accumulation of assets, making it a versatile and comprehensive method for investors seeking to optimize their portfolio performance. By diligently applying this multi-faceted approach, investors can make informed decisions and effectively capitalize on potential market opportunities.
DKK Strategy for ETFs and Funds:
The DKK system is a strategy designed for accumulating ETFs and Funds as long-term investments in your portfolio. It simplifies the process of identifying trend reversals and opportune moments to invest in listed ETFs and Funds, particularly during bull markets. Here's a detailed explanation of the DKK system:
Objective: The primary aim of the DKK system is to build a long-term investment portfolio by focusing on ETFs and Funds. It facilitates the identification of stocks that are in the process of reversing their trends, allowing investors to benefit from upward price movements in these financial instruments.
Stock Selection Criteria: The DKK system employs specific criteria for selecting ETFs and Funds:
• 200EMA (Exponential Moving Average): The system monitors whether the prices of ETFs and Funds are consistently below the 200-day Exponential Moving Average. This is considered an indicator of weakness, especially on a daily time frame.
• RSI (Relative Strength Index): The system looks for an RSI value of less than 40. An RSI below 40 is often seen as an indication of a weak or oversold condition in a financial instrument.
Alert Signal: Once the DKK system identifies ETFs and Funds meeting these criteria, it provides an alert signal:
• Red Upside Triangle Sign: This signal is automatically generated on the daily chart of ETFs and Funds. It serves as a clear indicator to investors that it's an opportune time to accumulate these financial instruments for long-term investment.
It's important to note that the DKK system is specifically designed for ETFs and Funds, so it should be applied to these types of investments. Additionally, it's recommended to track index ETFs and specific types of funds, such as REITs (Real Estate Investment Trusts) and INVITs (Infrastructure Investment Trusts), in line with the DKK system's approach. This strategy simplifies the process of identifying investment opportunities within this asset class, particularly during periods of market weakness.
SKK1 Strategy for Conservative Stock Investment:
The SKK 1 system is a stock investment strategy tailored for conservative investors seeking long-term portfolio growth with a focus on stability and prudent decision-making. This strategy is meticulously designed to identify pivotal market trends and stock price movements, allowing investors to make informed choices and capitalize on upward market trends while minimizing risk. Here's a comprehensive overview of the SKK 1 system, emphasizing its suitability for conservative investors:
Objective: The primary objective of the SKK 1 system is to accumulate stocks as long-term investments in your portfolio while prioritizing capital preservation. It offers a disciplined approach to pinpointing potential entry points for stocks, particularly during market corrections and trend reversals, thereby enabling you to actively participate in bullish market phases while adopting a conservative risk management stance.
Stock Selection Criteria: The SKK 1 system employs a stringent set of criteria to select stocks for investment:
• Correction Mode: It identifies stocks that have undergone a correction, signifying a decline in stock prices from their recent highs. This conservative approach emphasizes the importance of seeking stocks with a history of stability.
• 200EMA (Exponential Moving Average): The system diligently analyses daily stock price movements, specifically looking for stocks that have fallen to or below the 200-day Exponential Moving Average. This indicator suggests potential overselling and aligns with a conservative strategy of buying low.
Trend Reversal Confirmation: The SKK 1 system doesn't merely pinpoint stocks in correction mode; it takes an extra step to confirm a trend reversal. It employs the following indicators:
• Short-term Downtrends Reversal: This aspect focuses on identifying the reversal of short-term downtrends in stock prices, observed through the transition of the super trend indicator from the red zone to the green zone. This cautious approach ensures that the trend is genuinely shifting.
• Super Trend Zones: These zones are crucial for assessing whether a stock is in a bullish or bearish trend. The system consistently monitors these zones to confirm a potential trend reversal.
Alert & Buy Signals: When the SKK 1 system identifies stocks that have reached a potential bottom and are on the verge of a trend reversal, it issues vital alert signals, aiding conservative investors in prudent decision-making:
• Orange Upside Triangle Sign: This signal serves as a cautious heads-up, indicating that a stock may be poised for a trend reversal. It advises investors to prepare funds for potential investment without taking undue risks.
• Green Upside Triangle Sign: This is the confirmation of a trend reversal, signifying a robust buy signal. Conservative investors can confidently enter the market at this point, accumulating stocks for a long-term investment, secure in the knowledge that the trend is in their favor.
In summary, the SKK 1 system is a systematic and conservative approach to stock investing. It excels in identifying stocks experiencing corrections and ensures that investors act when there's a strong indication of a trend reversal, all while prioritizing capital preservation and risk management. This strategy empowers conservative investors to navigate the intricacies of the stock market with confidence, providing a calculated and stable path toward long-term portfolio growth.
Note: The SKK1 strategy, known for its conservative approach to stock investment, also provides an option to extend its methodology to ETFs and Funds for those investors who wish to accumulate assets more aggressively. By enabling this feature in the settings, you can harness the SKK1 strategy's careful criteria and signal indicators to accumulate aggressive investments in ETFs and Funds.
This flexible approach acknowledges that even within a conservative strategy, there may be opportunities for more assertive investments in assets like ETFs and Funds. By making use of this option, you can strike a balance between a conservative stance in your stock portfolio while exploring an aggressive approach in other asset classes. It offers the versatility to cater to a variety of investment preferences, ensuring that you can adapt your strategy to suit your financial goals and risk tolerance.
SKK 2 Strategy for Aggressive Stock Investment:
The SKK 2 strategy is designed for those who are determined not to miss significant opportunities within a continuous uptrend and seek a way to enter a trend that doesn't present entry signals through the SKK 1 strategy. While it offers a more aggressive entry approach, it is ideal for individuals willing to take calculated risks to potentially reap substantial long-term rewards. This strategy is particularly suitable for accumulating stocks for aggressive long-term investment. Here's a detailed description of the SKK 2 strategy:
Objective: The primary aim of the SKK 2 strategy is to provide an avenue for investors to identify short-term trend reversals and seize the opportunity to enter stocks during an uptrend, thereby capitalizing on a sustained bull run. It acknowledges that there may not always be clear entry signals through the SKK 1 strategy and offers a more aggressive alternative.
Stock Selection Criteria: The SKK 2 strategy utilizes a specific set of criteria for stock selection:
1. 50EMA (Exponential Moving Average): It targets stocks that are trading below the 50-day Exponential Moving Average. This signals a short-term reversal from the top and indicates that the stock is in a downtrend.
2. RSI (Relative Strength Index): The strategy considers stocks with an RSI of less than 40, which is an indicator of weakness in the stock.
Alert Signals: The SKK 2 strategy provides distinct alert signals that facilitate entry during an aggressive reversal:
• Red Downside Triangle Sign: This signal is triggered when the stock is below the 50EMA and has an RSI of less than 40. It serves as a clear warning of a short-term reversal from the top and a downtrend, displayed on the daily chart.
• Purple Upside Triangle Sign: This sign is generated when a reversal occurs through a bullish candle, and the RSI is greater than 40. It signifies the stock has bottomed out from a short-term downtrend and is now reversing. This purple upside triangle serves as an entry signal on the chart, presenting an attractive opportunity to accumulate stocks during a strong bullish phase, offering a chance to seize a potentially favorable long-term investment.
In essence, the SKK 2 strategy caters to aggressive investors who are willing to take calculated risks to enter stocks during a continuous uptrend. It focuses on identifying short-term reversals and provides well-defined signals for entry. While this strategy is more aggressive in nature, it has the potential to yield substantial rewards for those who are comfortable with a higher level of risk and are looking for opportunities to build a strong long-term portfolio.
Introduction to Strategy Signal Information Chart
This chart provides essential information on strategy signals for DKK, SKK1, and SKK2. By quickly identifying "Buy" and "Alert" signals for each strategy, investors can efficiently gauge market conditions and make informed decisions to optimize their investment portfolios.
In Conclusion
These investment strategies, whether conservative like DKK and SKK1 or more aggressive like SKK2, offer a range of options for investors to navigate the complex world of long-term investments. The combination of Super Trend, RSI, and EMAs with their crossovers provides clear signals on a daily time frame, empowering users to make well-informed decisions and potentially capitalize on market opportunities. Whether you're looking for stability or are ready to embrace more risk, these strategies have something to offer for building and growing your investment portfolio.

Alxuse Supertrend 4EMA Buy and Sell for tutorialAll abilities of Supertrend, moreover :
Drawing 4 EMA band & the ability to change values, change colors, turn on/off show.
Sends Signal Sell and Buy in multi timeframe.
The ability used in the alert section and create customized alerts.
To receive valid alerts the replay section , the timeframe of the chart must be the same as the timeframe of the indicator.
Supertrend with a simple EMA Filter can improve the performance of the signals during a strong trend.
For detecting the continuation of the downward and upward trend we can use 4 EMA colors.
In the upward trend , the EMA lines are in order of green, blue, red, yellow from bottom to top.
In the downward trend, the EMA lines are in order of yellow, red, blue, green from bottom to top.
How it works:
x1 = MA1 < MA2 and MA2 < MA3 and MA3 < MA4 and ta.crossunder(MA3, MA4)
x2 = MA1 < MA2 and MA2 < MA3 and MA3 < MA4 and ta.crossunder(MA2, MA3)
x3 = MA1 < MA2 and MA2 < MA3 and MA3 < MA4 and ta.crossunder(MA1, MA2)
y1 = MA4 < MA3 and MA3 < MA2 and MA2 < MA1 and ta.crossover(MA3, MA4)
y2 = MA4 < MA3 and MA3 < MA2 and MA2 < MA1 and ta.crossover(MA2, MA3)
y3 = MA4 < MA3 and MA3 < MA2 and MA2 < MA1 and ta.crossover(MA1, MA2)
Red triangle = x1 or x2 or x3
Green triangle = y1 or y2 or y3
Long = BUY signal and followed by a Green triangle
Exit Long = SELL signal
Short = SELL signal and followed by a Red triangle
Exit Short = BUY signal
It is also possible to get help from the Stochastic RSI and MACD indicators for confirmation.
For receiving a signal with these two conditions or more conditions, i am making a video tutorial that I will release soon.
Supertrend
Definition
Supertrend is a trend-following indicator based on Average True Range (ATR). The calculation of its single line combines trend detection and volatility. It can be used to detect changes in trend direction and to position stops.
The basics
The Supertrend is a trend-following indicator. It is overlaid on the main chart and their plots indicate the current trend. A Supertrend can be used with varying periods (daily, weekly, intraday etc.) and on varying instruments.
The Supertrend has several inputs that you can adjust to match your trading strategy. Adjusting these settings allows you to make the indicator more or less sensitive to price changes.
For the Supertrend inputs, you can adjust atrLength and multiplier:
the atrLength setting is the lookback length for the ATR calculation;
multiplier is what the ATR is multiplied by to offset the bands from price.
When the price falls below the indicator curve, it turns red and indicates a downtrend. Conversely, when the price rises above the curve, the indicator turns green and indicates an uptrend. After each close above or below Supertrend, a new trend appears.
Summary
The Supertrend helps you make the right trading decisions. However, there are times when it generates false signals. Therefore, it is best to use the right combination of several indicators. Like any other indicator, Supertrend works best when used with other indicators such as MACD, Parabolic SAR, or RSI.
Exponential Moving Average
Definition
The Exponential Moving Average (EMA) is a specific type of moving average that points towards the importance of the most recent data and information from the market. The Exponential Moving Average is just like it’s name says - it’s exponential, weighting the most recent prices more than the less recent prices. The EMA can be compared and contrasted with the simple moving average.
Similar to other moving averages, the EMA is a technical indicator that produces buy and sell signals based on data that shows evidence of divergence and crossovers from general and historical averages. Additionally, the EMA tries to amplify the importance that the most recent data points play in a calculation.
It is common to use more than one EMA length at once, to provide more in-depth and focused data. For example, by choosing 10-day and 200-day moving averages, a trader is able to determine more from the results in a long-term trade, than a trader who is only analyzing one EMA length.
It’s best to use the EMA when for trending markets, as it shows uptrends and downtrends when a market is strong and weak, respectively. An experienced trader will know to look both at the line the EMA projects, as well as the rate of change that comes from each bar as it moves to the next data point. Analyzing these points and data streams correctly will help the trader determine when they should buy, sell, or switch investments from bearish to bullish or vice versa.
Short-term averages, on the other hand, is a different story when analyzing Exponential Moving Average data. It is most common for traders to quote and utilize 12- and 26-day EMAs in the short-term. This is because they are used to create specific indicators. Look into Moving Average Convergence Divergence (MACD) for more information. Similarly, the 50- and 200-day moving averages are most common for analyzing long-term trends.
Moving averages can be very useful for traders using technical analysis for profit. It is important to identify and realize, however, their shortcomings, as all moving averages tend to suffer from recurring lag. It is difficult to modify the moving average to work in your favor at times, often having the preferred time to enter or exit the market pass before the moving average even shows changes in the trend or price movement for that matter.
All of this is true, however, the EMA strives to make this easier for traders. The EMA is unique because it places more emphasis on the most recent data. Therefore, price movement and trend reversals or changes are closely monitored, allowing for the EMA to react quicker than other moving averages.
Limitations
Although using the Exponential Moving Average has a lot of advantages when analyzing market trends, it is also uncertain whether or not the use of most recent data points truly affects technical and market analysis. In addition, the EMA relies on historical data as its basis for operating and because news, events, and other information can change rapidly the indicator can misinterpret this information by weighting the current prices higher than when the event actually occurred.
Summary
The Exponential Moving Average (EMA) is a moving average and technical indicator that reflects and projects the most recent data and information from the market to a trader and relies on a base of historical data. It is one of many different types of moving averages and has an easily calculable formula.
The added features to the indicator are made for training, it is advisable to use it with caution in tradings.

Extended Moving Average (MA) LibraryThis Extended Moving Average Library is a sophisticated and comprehensive tool for traders seeking to expand their arsenal of moving averages for more nuanced and detailed technical analysis.
The library contains various types of moving averages, each with two versions - one that accepts a simple constant length parameter and another that accepts a series or changing length parameter.
This makes the library highly versatile and suitable for a wide range of strategies and trading styles.
Moving Averages Included:
Simple Moving Average (SMA): This is the most basic type of moving average. It calculates the average of a selected range of prices, typically closing prices, by the number of periods in that range.
Exponential Moving Average (EMA): This type of moving average gives more weight to the latest data and is thus more responsive to new price information. This can help traders to react faster to recent price changes.
Double Exponential Moving Average (DEMA): This is a composite of a single exponential moving average, a double exponential moving average, and an exponential moving average of a triple exponential moving average. It aims to eliminate lag, which is a key drawback of using moving averages.
Jurik Moving Average (JMA): This is a versatile and responsive moving average that can be adjusted for market speed. It is designed to stay balanced and responsive, regardless of how long or short it is.
Kaufman's Adaptive Moving Average (KAMA): This moving average is designed to account for market noise or volatility. KAMA will closely follow prices when the price swings are relatively small and the noise is low.
Smoothed Moving Average (SMMA): This type of moving average applies equal weighting to all observations and smooths out the data.
Triangular Moving Average (TMA): This is a double smoothed simple moving average, calculated by averaging the simple moving averages of a dataset.
True Strength Force (TSF): This is a moving average of the linear regression line, a statistical tool used to predict future values from past values.
Volume Moving Average (VMA): This is a simple moving average of a volume, which can help to identify trends in volume.
Volume Adjusted Moving Average (VAMA): This moving average adjusts for volume and can be more responsive to volume changes.
Zero Lag Exponential Moving Average (ZLEMA): This type of moving average aims to eliminate the lag in traditional EMAs, making it more responsive to recent price changes.
Selector: The selector function allows users to easily select and apply any of the moving averages included in the library inside their strategy.
This library provides a broad selection of moving averages to choose from, allowing you to experiment with different types and find the one that best suits your trading strategy.
By providing both simple and series versions for each moving average, this library offers great flexibility, enabling users to pass both constant and changing length parameters as needed.
EMA-Deviation-Corrected T3 [Loxx]EMA-Deviation-Corrected T3 is a T3 moving average that uses EMA deviation correcting to produce signals. This comes via the beloved genius Mladen.
The origin of the correcting algorithm can be attributed to Dr. Alexander Uhl, who developed a method to filter the moving average and identify signals. Originally, this method utilized standard deviation as a measure to correct the average values.
However, the current indicator in question employs a modified version of the correcting method. Instead of using standard deviation for calculation, it uses EMA deviation, which stands for Exponential Moving Average deviation. The idea behind using EMA deviation is two-fold:
Efficiency: EMA deviation can be calculated faster than standard deviation, resulting in more efficient code execution.
Signal Reduction: Surprisingly, this modified "correcting" approach generates fewer signals compared to using standard deviation. This is because EMA deviation is more responsive to price changes, making the correcting process less sensitive to whipsaws or false signals.
What is T3?
The T3 moving average, short for "Tim Tillson's Triple Exponential Moving Average," is a technical indicator used in financial markets and technical analysis to smooth out price data over a specific period. It was developed by Tim Tillson, a software project manager at Hewlett-Packard, with expertise in Mathematics and Computer Science.
The T3 moving average is an enhancement of the traditional Exponential Moving Average (EMA) and aims to overcome some of its limitations. The primary goal of the T3 moving average is to provide a smoother representation of price trends while minimizing lag compared to other moving averages like Simple Moving Average (SMA), Weighted Moving Average (WMA), or EMA.
To compute the T3 moving average, it involves a triple smoothing process using exponential moving averages. Here's how it works:
Calculate the first exponential moving average (EMA1) of the price data over a specific period 'n.'
Calculate the second exponential moving average (EMA2) of EMA1 using the same period 'n.'
Calculate the third exponential moving average (EMA3) of EMA2 using the same period 'n.'
The formula for the T3 moving average is as follows:
T3 = 3 * (EMA1) - 3 * (EMA2) + (EMA3)
By applying this triple smoothing process, the T3 moving average is intended to offer reduced noise and improved responsiveness to price trends. It achieves this by incorporating multiple time frames of the exponential moving averages, resulting in a more accurate representation of the underlying price action.
Included
Bar coloring
Signals
Alerts
Loxx's Expanded Source Types

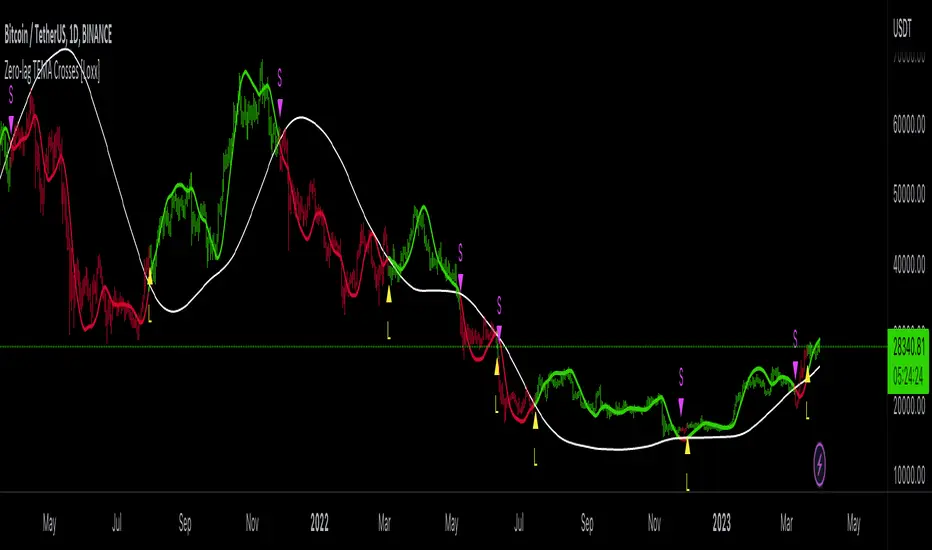
Zero-lag TEMA Crosses [Loxx]Zero-lag TEMA Crosses is a spinoff of a the Zero-lag MA as described by David Stendahl in the April 2000 issue of the journal "Technical Analysis of Stocks and Commodities". This indicator uses TEMA calculation mode in order to make the lag lesser compared to the original Zero-lag MA, and that makes this version even faster than the Zero-lag DEMA too. This indicator is the difference between a Fast and Slow Zero-lag TEMA. This indicator is very useful for lower timeframe scalping.
What is the Zero-lag MA?
The Zero-lag MA (Zero-Lag Moving Average) is a technical indicator that was introduced in the April 2000 issue of the journal "Technical Analysis of Stocks and Commodities" by David Stendahl.
The Zero-lag MA is a type of moving average (MA) that is designed to reduce or eliminate the lag that is typically associated with traditional moving averages. Moving averages are a widely used technical analysis tool that helps traders to identify trends and potential trading opportunities. They work by calculating the average price of a security over a given period of time, and then plotting that average on a chart. The most commonly used moving averages are simple moving averages (SMAs) and exponential moving averages (EMAs).
The problem with traditional moving averages is that they can be slow to respond to changes in market conditions. This lag can cause traders to miss out on potential trading opportunities, or to enter or exit trades at the wrong time. The Zero-lag MA was developed as a solution to this problem.
The Zero-lag MA is calculated using a combination of two EMAs and a subtraction formula. The first step in calculating the Zero-lag MA is to calculate two exponential moving averages: a fast EMA and a slow EMA. The fast EMA is calculated over a shorter period of time than the slow EMA. The exact period lengths will depend on the trader's preferences and the security being analyzed.
Once the two EMAs have been calculated, the next step is to take the difference between them. This difference represents the current market trend, with a positive value indicating an uptrend and a negative value indicating a downtrend. However, this difference alone is not enough to create a useful indicator, as it can still suffer from lag.
To further reduce lag, the difference between the two EMAs is multiplied by a factor derived from a third, slower EMA. This slower EMA acts as a smoothing factor, helping to reduce noise and make the indicator more accurate. The exact period length of the slower EMA will depend on the trader's preferences and the security being analyzed.
The final step in calculating the Zero-lag MA is to add the result of the multiplication to the fast EMA. This produces a final value that represents the current market trend with reduced lag. The Zero-lag MA can be plotted on a chart like any other moving average, and can be used to identify trends, potential trading opportunities, and support and resistance levels.
Overall, the Zero-lag MA is designed to provide traders with a more accurate representation of current market conditions by reducing the lag time between price changes and the moving average. By doing so, it can help traders to make more informed trading decisions and improve their overall profitability.
What is the TEMA?
The triple exponential moving average (TEMA) is a technical analysis indicator that was developed to reduce the lag of traditional moving averages, such as the simple moving average (SMA) or the exponential moving average (EMA). The TEMA was first introduced by Patrick Mulloy in the January 1994 issue of the "Technical Analysis of Stocks and Commodities" magazine.
The TEMA is a type of moving average that is calculated by applying multiple exponential smoothing techniques to price data. Unlike traditional moving averages, which apply a single smoothing factor to price data, the TEMA applies three smoothing factors to produce a more responsive and accurate indicator.
To calculate the TEMA, the following steps are taken:
Calculate the single exponential moving average (SMA) of the price data over a given period.
Calculate the double exponential moving average (DEMA) of the SMA over the same period.
Calculate the triple exponential moving average (TEMA) of the DEMA over the same period.
The formula for calculating the TEMA is:
TEMA = 3 * EMA(SMA) - 3 * EMA(EMA(SMA)) + EMA(EMA(EMA(SMA)))
where EMA is the exponential moving average and SMA is the simple moving average.
The TEMA is designed to reduce the lag associated with traditional moving averages by applying multiple smoothing factors to the price data. This helps to filter out short-term price fluctuations and provide a smoother indicator of the underlying trend. The TEMA is also less susceptible to whipsaws, which occur when a security's price moves in one direction and then quickly reverses, causing false trading signals.
The TEMA can be used in a variety of ways in technical analysis. It can be used to identify trends, determine support and resistance levels, and generate trading signals. When the TEMA is rising, it is generally interpreted as a bullish signal, indicating that the price is trending higher. When the TEMA is falling, it is generally interpreted as a bearish signal, indicating that the price is trending lower.
In summary, the TEMA is a more responsive and accurate indicator than traditional moving averages, designed to reduce lag and provide a smoother representation of the underlying trend. It is a useful tool for technical analysts and traders looking to identify trends, support and resistance levels, and potential trading opportunities.
Extras
Alerts
Bar coloring
Signals
Loxx's Expanded Source Types, see here:
Bollinger Bands With User Selectable MABollinger Bands with user selection options to calculate the moving average basis and bands from a variety of different moving averages.
The user selects their choice of moving average, and the bands automatically adjust. The user may select a MA that reacts faster to volatility or slower/smoother.
Added additional options to color the bands or basis based on the current trend and alternate candle colors for band touches. Options:
REACT SLOW/SMOOTH TO VOLATILITY
simple moving average (Regular Bollinger Bands)
REACT SMOOTH TO VOLATILITY
exponential moving average (EMA Bollinger Bands)
weighted moving average (Weighted MA Bollinger Bands)
exponential hull moving average (Hull Bollinger Bands with better smoothing)
HIGHLY ADJUSTABLE TO VOLATILITY
Arnaud Legoux Moving average (ALMA Bollinger Bands)
Note: 0.85 ALMA default for more smoothing, set offset=1 to turn off smoothing
REACT HARSH TO VOLATILITY
least squares moving average (Least Squares Bollinger Bands)
REACT VERY FAST TO VOLATILITY
hull moving average (Hull Bollinger Bands or Hullinger Bands)
VALUE ADDED: This script is unique in that no other Bollinger Bands indicator offers a user selection for moving average, and some of the options do not exist yet as Bollinger Bands indicators.
Definitions:
Bollinger Bands: A Bollinger Band® is a technical analysis tool defined by a set of trendlines plotted two standard deviations (positively and negatively) away from a simple moving average (SMA) of a security's price, but which can be adjusted to user preferences.
Exponential Bollinger Bands: The most important characteristics of the Exponential Bollinger Bands indicator are: When the market is flat, the bands will stay much closer to prices. When the volatility is high, the bands move away from prices faster.
Hull Bollinger Bands: Bollinger Bands calculated by Hull moving average, rather than simple moving average or ema. The Hull Moving Average (HMA), developed by Alan Hull, is an extremely fast and smooth moving average. In fact, the HMA almost eliminates lag altogether and manages to improve smoothing at the same time.
Exponential Hull Bollinger Bands: Bollinger Bands calculated by Exponential Hull moving average, rather than simple moving average or ema. The Exponential Hull Moving Average is similar to the standard Hull MA, but with superior smoothing. The standard Hull Moving Average is derived from the weighted moving average (WMA). As other moving average built from weighted moving averages it has a tendency to exaggerate price movement.
Weighted Moving Average Bollinger Bands: A Weighted Moving Average (WMA) is similar to the simple moving average (SMA), except the WMA adds significance to more recent data points.
Arnaud Legoux Moving Average Bollinger Bands: ALMA removes small price fluctuations and enhances the trend by applying a moving average twice, once from left to right, and once from right to left. At the end of this process the phase shift (price lag) commonly associated with moving averages is significantly reduced. Zero-phase digital filtering reduces noise in the signal. Conventional filtering reduces noise in the signal, but adds a delay.
Least Squares Bollinger Bands: The indicator is based on sum of least squares method to find a straight line that best fits data for the selected period. The end point of the line is plotted and the process is repeated on each succeeding period.

RK's 10 ∴ MA Types Ribbons (Fibonacci, Guppy and others)After some tips in my indicator
RK's 04 - Lots of MA Types Ribbon I Put some time and effort to make it better.
So, I'm sharing with you the results.
This is an up to 10 lines Moving Average Ribbon with an Auto Evaluate Length and a lots of options!!!
Type of Moving Average you can use:
SMA - Simple Moving Average
SMMA - Smoothed Moving Average
EMA - Exponential Moving Average
DEMA - Double Exponential Moving Average
TEMA - Triple Exponential Moving Average
WMA - Weighted Moving Average
HMA - Hull Moving Average
EHMA - Exponential Hull Moving Average
RMA - RSI Moving average
2PSS - Ehlers 2 Pole Super Smoother
3PSS - Ehlers 3 Pole Super Smoother
VWMA - Volume-Weighted Moving Average
ALMA - Arnaud Legoux Moving Average
STMA - Simple Triangular Moving Average
ETMA - Exponential Triangular Moving Average
LSMA - Least Squares Moving Average
ZSMA - Zero-Lag Simple Moving Average
ZEMA - Zero-Lag Exponential Moving Average
COVWMA - Coefficient of Variation Weighted Moving Average
COVWEMA - Coefficient of Variation Weighted Exponential Moving Average
FRAMA - Fractal Adaptive Moving Average
KAMA - Kaufman's Adaptive Moving Average
VIDYA - Variable Index Dynamic Average
If you want to change faster the MA type, in "Moving Average Setup:", Select "🤖 Use numbers to change MA Type", click inside the box in "🤖 Moving Average Type per Number:" and just scroll your mouse wheel. You can check what MA type you are using looking in the info panel label.
There is 4 automatic evaluate length:
Fibonacci Sequence
Arithmetic Progression
Geometric Progression
Guppy Multiple Moving Average (GMMA) without Lengths 03 and 05
And I already put a Manual Length, but I keep it inside the code, so if you want to use different lengths, just change the code, or ask me and I will put as an input.
And attending a request, this indicator can creates alerts when all the colors of the ribbons changes.
Hope you like it!
Any other good idea, just send me.
Price Action Movements by RPThis is the Indicator which will enhance finding Buying and Selling opportunity on any market.
Mostly suited for day Trading and some indicator can be used for signalling stock on longer time frame.
Indicators used to create this strategy is as follows:
- Exponential Moving Average (EMA)
- Supertrend
- Volume Weighted Average Price (VWAP)
- Exponential Moving Average of Volume Weighted Average Price (MVWAP)
- Previous Day Volume Weighted Average Price (PVWAP)
- Previous Day High, Low and Close (PDH, PDL, PDC)
- And Current Day Support and Resistance points based on Previous day Price Movement.
This will indicate where to buy and Sell with Indicator based on Following criteria,
Buy Signal given,
- When Close is above Exponential Moving Average 9
- When Close is above Exponential Moving Average 21
- RSI above 55
- Supertrend is positive
- Volume is above 300 moving Average
- Close is above Volume Weighted Average Price
Sell Signal given,
- When Close is below Exponential Moving Average 9
- When Close is below Exponential Moving Average 21
- RSI below 45
- Supertrend is negative
- Volume is above 300 moving Average
- Close is below Volume Weighted Average Price
Trades can use this Study according to their need of the Indicator.
Users can Tick the indicator which they want to add on Charts to study.
Only Exponential Moving Average indicator can be used.
Only Supertrend can be used.
Volume Weighted Average Price, Previous Day Volume Weighted Average Price, Exponential Moving Average of Volume Weighted Average Price and Previous Day High, Low and Close can be used as a particular study.
Support and Resistance can be used along with Previous Day High and Previous Day Low as a particular study.
This is multipurpose Study which will help Trading Society immensely.
Thank You.

Hyper Insight MA Strategy [Universal]Hyper Insight MA Strategy ** is a comprehensive trend-following engine designed for traders who require precision and flexibility. Unlike standard indicators that lock you into a single calculation method, this strategy serves as a "Universal Adapter," allowing you to **Mix & Match 13 different Moving Average types** for both the Fast and Slow trend lines independently.
Whether you need the smoothness of T3, the responsiveness of HMA, or the classic reliability of SMA, this script enables you to backtest thousands of combinations to find the perfect edge for your specific asset class.
---
🔬 Deep Dive: Calculation Logic of Included MAs
This strategy includes 13 distinct calculation methods. Understanding the math behind them will help you choose the right tool for your specific market conditions.
#### 1. Standard Averages
* **SMA (Simple Moving Average):** The unweighted mean of the previous $n$ data points.
* *Logic:* Treats every price point in the period with equal importance. Good for identifying long-term macro trends but reacts slowly to recent volatility.
* **WMA (Weighted Moving Average):** A linear weighted average.
* *Logic:* Assigns heavier weight to current data linearly (e.g., $1, 2, 3... n$). It reacts faster than SMA but is still relatively smooth.
* **SWMA (Symmetrically Weighted Moving Average):**
* *Logic:* Uses a fixed-length window (usually 4 bars) with symmetrical weights $ $. It prioritizes the center of the recent data window.
#### 2. Exponential & Lag-Reducing Averages
* **EMA (Exponential Moving Average):**
* *Logic:* Applies an exponential decay weighting factor. Recent prices have significantly more impact on the average than older prices, reducing lag compared to SMA.
* **RMA (Running Moving Average):** Also known as Wilder's Smoothing (used in RSI).
* *Logic:* It is essentially an EMA but with a slower alpha weight of $1/length$. It provides a very smooth, stable line that filters out noise effectively.
* **DEMA (Double Exponential Moving Average):**
* *Logic:* Calculated as $2 \times EMA - EMA(EMA)$. By subtracting the "lag" (the smoothed EMA) from the original EMA, DEMA provides a much faster reaction to price changes with less noise than a standard EMA.
* **TEMA (Triple Exponential Moving Average):**
* *Logic:* Calculated as $3 \times EMA - 3 \times EMA(EMA) + EMA(EMA(EMA))$. This effectively eliminates the lag inherent in single and double EMAs, making it an extremely fast-tracking indicator for scalping.
#### 3. Advanced & Adaptive Averages
* **HMA (Hull Moving Average):**
* *Logic:* A composite formula involving Weighted Moving Averages: ASX:WMA (2 \times Integer(n/2)) - WMA(n)$. The result is then smoothed by a $\sqrt{n}$ WMA.
* *Effect:* It eliminates lag almost entirely while managing to improve curve smoothness, solving the traditional trade-off between speed and noise.
* **ZLEMA (Zero Lag Exponential Moving Average):**
* *Logic:* This calculation attempts to remove lag by modifying the data source before smoothing. It calculates a "lag" value $(length-1)/2$ and applies an EMA to the data: $Source + (Source - Source )$. This creates a projection effect that tracks price tightly.
* **T3 (Tillson T3 Moving Average):**
* *Logic:* A complex smoothing technique that runs an EMA through a filter multiple times using a "Volume Factor" (set to 0.7 in this script).
* *Effect:* It produces a curve that is incredibly smooth and free of "overshoot," making it excellent for filtering out market chop.
* **ALMA (Arnaud Legoux Moving Average):**
* *Logic:* Uses a Gaussian distribution (bell curve) to assign weights. It allows the user to offset the moving average (moving the peak of the weight) to align it perfectly with the price, balancing smoothness and responsiveness.
* **LSMA (Least Squares Moving Average):**
* *Logic:* Calculates the endpoint of a Linear Regression line for the lookback period. It essentially guesses where the price "should" be based on the best-fit line of the recent trend.
* **VWMA (Volume Weighted Moving Average):**
* *Logic:* Weights the closing price by the volume of that bar.
* *Effect:* Prices on high volume days pull the MA harder than prices on low volume days. This is excellent for validating true trend strength (i.e., a breakout on high volume will move the VWMA significantly).
---
### 🛠 Features & Settings
* **Universal Switching:** Change the `Fast MA` and `Slow MA` types instantly via the settings menu.
* **Trend Cloud:** A dynamic background fill (Green/Red) highlights the crossover zone for immediate visual trend identification.
* **Strategy Mode:** Built-in Backtesting logic triggers `LONG` entries when Fast MA crosses over Slow MA, and `EXIT` when Fast MA crosses under.
### ⚠️ Disclaimer
This script is intended for educational and research purposes. The wide variety of MA combinations can produce vastly different results. Past performance is not indicative of future results. Please use proper risk management.

Total Returns indicator by PtahXPtahX Total Returns – True Total-Return View for Any Symbol
Most charts only show price. This script shows what your position actually did once you include dividends and, optionally, inflation.
What this indicator does
1. Builds a Total Return series
You choose how dividends are treated:
* Reinvest (default): All gross dividends are automatically reinvested into more shares on the ex-dividend bar.
* Cash: Dividends are kept as cash added on top of your initial position.
* Ignore: Price only, like a regular chart.
This answers: “If I bought once at the start and held, how much would that position be worth now, given this dividend policy?”
2. Optional inflation-adjusted (real) returns
You can also plot a real total-return line, which adjusts for inflation using a CPI series.
This answers: “How did my purchasing power change after inflation?”
3. Stats window and exponential trendline
You can pick the time window:
* Since inception (full available history)
* YTD
* Last 1 Year
* Last 5 Years
* Custom start date
For that window, the script:
* Normalizes Total Return to 1.0 at the window start.
* Fits an exponential trendline (pink) to the normalized series.
* Displays a stats table in the bottom-right showing:
• Overall Return (%) over the selected range
• CAGR (compound annual growth rate, % per year)
• Trendline growth (% per year)
• R² of the trendline (fit quality)
• A separate “Since inception” block (overall return and CAGR from the first bar on the chart)
How to use it
1. Add the indicator to your chart.
2. Open the settings:
Total Return & Dividends
* Dividend mode
• Reinvest: closest to a true total-return curve (default).
• Cash: price plus cash dividends.
• Ignore: price only.
* Plot inflation-adjusted TR line
• Turn this on if you want to see a real (CPI-adjusted) total-return line.
Inflation / Real Returns
* Inflation country code and field code
• Leave defaults if you just want a standard CPI series.
* Use real TR for stats & trendline
• On: stats and trendline use the inflation-adjusted curve.
• Off: stats use the nominal (non-adjusted) total return.
Stats Range & Trendline
* Stats range: Since inception, YTD, 1 Year, 5 Years, or Custom date.
* Custom date: set year, month, and day if you choose “Custom date”.
* Plot TR exponential trendline: show or hide the pink curve.
* Show stats table / Show Overall Return / Show Trendline stats: toggle what appears in the table.
3. Zoom and change timeframe as usual. The stats range is based on calendar time (YTD, 1Y, 5Y, etc.), not bar count, so the numbers stay meaningful as you change resolutions.
How to read the outputs
* Teal line: Nominal Total Return (using your chosen dividend mode).
* Orange line (if enabled): Real (inflation-adjusted) Total Return.
* Pink line (if enabled): Exponential trendline for the selected stats window.
On the right edge, small labels show the latest value of each active line.
In the bottom-right stats table:
* Overall Return: total percentage gain or loss over the chosen stats range.
* CAGR: the smoothed annual rate that would turn 1.0 into the current value over that range.
* Exponential Trendline: the average trendline growth per year and the R².
• R² near 1 means prices follow a clean exponential path.
• Lower R² means more noise or sideways movement around the trend.
* Range: which window those stats apply to (YTD, 1Y, 5Y, etc.).
* Since inception: overall return and CAGR from the first bar on the chart up to the latest bar, independent of the current stats range.
Use this when you want to compare true performance, not just price – especially for dividend-heavy ETFs, funds, and income strategies.

MACD Enhanced [DCAUT]█ MACD Enhanced
📊 ORIGINALITY & INNOVATION
The MACD Enhanced represents a significant improvement over traditional MACD implementations. While Gerald Appel's original MACD from the 1970s was limited to exponential moving averages (EMA), this enhanced version expands algorithmic options by supporting 21 different moving average calculations for both the main MACD line and signal line independently.
This improvement addresses an important limitation of traditional MACD: the inability to adapt the indicator's mathematical foundation to different market conditions. By allowing traders to select from algorithms ranging from simple moving averages (SMA) for stability to advanced adaptive filters like Kalman Filter for noise reduction, this implementation changes MACD from a fixed-algorithm tool into a flexible instrument that can be adjusted for specific market environments and trading strategies.
The enhanced histogram visualization system uses a four-color gradient that helps communicate momentum strength and direction more clearly than traditional single-color histograms.
📐 MATHEMATICAL FOUNDATION
The core calculation maintains the proven MACD formula: Fast MA(source, fastLength) - Slow MA(source, slowLength), but extends it with algorithmic flexibility. The signal line applies the selected smoothing algorithm to the MACD line over the specified signal period, while the histogram represents the difference between MACD and signal lines.
Available Algorithms:
The implementation supports a comprehensive spectrum of technical analysis algorithms:
Basic Averages: SMA (arithmetic mean), EMA (exponential weighting), RMA (Wilder's smoothing), WMA (linear weighting)
Advanced Averages: HMA (Hull's low-lag), VWMA (volume-weighted), ALMA (Arnaud Legoux adaptive)
Mathematical Filters: LSMA (least squares regression), DEMA (double exponential), TEMA (triple exponential), ZLEMA (zero-lag exponential)
Adaptive Systems: T3 (Tillson T3), FRAMA (fractal adaptive), KAMA (Kaufman adaptive), MCGINLEY_DYNAMIC (reactive to volatility)
Signal Processing: ULTIMATE_SMOOTHER (low-pass filter), LAGUERRE_FILTER (four-pole IIR), SUPER_SMOOTHER (two-pole Butterworth), KALMAN_FILTER (state-space estimation)
Specialized: TMA (triangular moving average), LAGUERRE_BINOMIAL_FILTER (binomial smoothing)
Each algorithm responds differently to price action, allowing traders to match the indicator's behavior to market characteristics: trending markets benefit from responsive algorithms like EMA or HMA, while ranging markets require stable algorithms like SMA or RMA.
📊 COMPREHENSIVE SIGNAL ANALYSIS
Histogram Interpretation:
Positive Values: Indicate bullish momentum when MACD line exceeds signal line, suggesting upward price pressure and potential buying opportunities
Negative Values: Reflect bearish momentum when MACD line falls below signal line, indicating downward pressure and potential selling opportunities
Zero Line Crosses: MACD crossing above zero suggests transition to bullish bias, while crossing below indicates bearish bias shift
Momentum Changes: Rising histogram (regardless of positive/negative) signals accelerating momentum in the current direction, while declining histogram warns of momentum deceleration
Advanced Signal Recognition:
Divergences: Price making new highs/lows while MACD fails to confirm often precedes trend reversals
Convergence Patterns: MACD line approaching signal line suggests impending crossover and potential trade setup
Histogram Peaks: Extreme histogram values often mark momentum exhaustion points and potential reversal zones
🎯 STRATEGIC APPLICATIONS
Comprehensive Trend Confirmation Strategies:
Primary Trend Validation Protocol:
Identify primary trend direction using higher timeframe (4H or Daily) MACD position relative to zero line
Confirm trend strength by analyzing histogram progression: consistent expansion indicates strong momentum, contraction suggests weakening
Use secondary confirmation from MACD line angle: steep angles (>45°) indicate strong trends, shallow angles suggest consolidation
Validate with price structure: trending markets show consistent higher highs/higher lows (uptrend) or lower highs/lower lows (downtrend)
Entry Timing Techniques:
Pullback Entries in Uptrends: Wait for MACD histogram to decline toward zero line without crossing, then enter on histogram expansion with MACD line still above zero
Breakout Confirmations: Use MACD line crossing above zero as confirmation of upward breakouts from consolidation patterns
Continuation Signals: Look for MACD line re-acceleration (steepening angle) after brief consolidation periods as trend continuation signals
Advanced Divergence Trading Systems:
Regular Divergence Recognition:
Bullish Regular Divergence: Price creates lower lows while MACD line forms higher lows. This pattern is traditionally considered a potential upward reversal signal, but should be combined with other confirmation signals
Bearish Regular Divergence: Price makes higher highs while MACD shows lower highs. This pattern is traditionally considered a potential downward reversal signal, but trading decisions should incorporate proper risk management
Hidden Divergence Strategies:
Bullish Hidden Divergence: Price shows higher lows while MACD displays lower lows, indicating trend continuation potential. Use for adding to existing long positions during pullbacks
Bearish Hidden Divergence: Price creates lower highs while MACD forms higher highs, suggesting downtrend continuation. Optimal for adding to short positions during bear market rallies
Multi-Timeframe Coordination Framework:
Three-Timeframe Analysis Structure:
Primary Timeframe (Daily): Determine overall market bias and major trend direction. Only trade in alignment with daily MACD direction
Secondary Timeframe (4H): Identify intermediate trend changes and major entry opportunities. Use for position sizing decisions
Execution Timeframe (1H): Precise entry and exit timing. Look for MACD line crossovers that align with higher timeframe bias
Timeframe Synchronization Rules:
Daily MACD above zero + 4H MACD rising = Strong uptrend context for long positions
Daily MACD below zero + 4H MACD declining = Strong downtrend context for short positions
Conflicting signals between timeframes = Wait for alignment or use smaller position sizes
1H MACD signals only valid when aligned with both higher timeframes
Algorithm Considerations by Market Type:
Trending Markets: Responsive algorithms like EMA, HMA may be considered, but effectiveness should be tested for specific market conditions
Volatile Markets: Noise-reducing algorithms like KALMAN_FILTER, SUPER_SMOOTHER may help reduce false signals, though results vary by market
Range-Bound Markets: Stability-focused algorithms like SMA, RMA may provide smoother signals, but individual testing is required
Short Timeframes: Low-lag algorithms like ZLEMA, T3 theoretically respond faster but may also increase noise
Important Note: All algorithm choices and parameter settings should be thoroughly backtested and validated based on specific trading strategies, market conditions, and individual risk tolerance. Different market environments and trading styles may require different configuration approaches.
📋 DETAILED PARAMETER CONFIGURATION
Comprehensive Source Selection Strategy:
Price Source Analysis and Optimization:
Close Price (Default): Most commonly used, reflects final market sentiment of each period. Best for end-of-day analysis, swing trading, daily/weekly timeframes. Advantages: widely accepted standard, good for backtesting comparisons. Disadvantages: ignores intraday price action, may miss important highs/lows
HL2 (High+Low)/2: Midpoint of the trading range, reduces impact of opening gaps and closing spikes. Best for volatile markets, gap-prone assets, forex markets. Calculation impact: smoother MACD signals, reduced noise from price spikes. Optimal when asset shows frequent gaps, high volatility during specific sessions
HLC3 (High+Low+Close)/3: Weighted average emphasizing the close while including range information. Best for balanced analysis, most asset classes, medium-term trading. Mathematical effect: 33% weight to high/low, 33% to close, provides compromise between close and HL2. Use when standard close is too noisy but HL2 is too smooth
OHLC4 (Open+High+Low+Close)/4: True average of all price points, most comprehensive view. Best for complete price representation, algorithmic trading, statistical analysis. Considerations: includes opening sentiment, smoothest of all options but potentially less responsive. Optimal for markets with significant opening moves, comprehensive trend analysis
Parameter Configuration Principles:
Important Note: Different moving average algorithms have distinct mathematical characteristics and response patterns. The same parameter settings may produce vastly different results when using different algorithms. When switching algorithms, parameter settings should be re-evaluated and tested for appropriateness.
Length Parameter Considerations:
Fast Length (Default 12): Shorter periods provide faster response but may increase noise and false signals, longer periods offer more stable signals but slower response, different algorithms respond differently to the same parameters and may require adjustment
Slow Length (Default 26): Should maintain a reasonable proportional relationship with fast length, different timeframes may require different parameter configurations, algorithm characteristics influence optimal length settings
Signal Length (Default 9): Shorter lengths produce more frequent crossovers but may increase false signals, longer lengths provide better signal confirmation but slower response, should be adjusted based on trading style and chosen algorithm characteristics
Comprehensive Algorithm Selection Framework:
MACD Line Algorithm Decision Matrix:
EMA (Standard Choice): Mathematical properties: exponential weighting, recent price emphasis. Best for general use, traditional MACD behavior, backtesting compatibility. Performance characteristics: good balance of speed and smoothness, widely understood behavior
SMA (Stability Focus): Equal weighting of all periods, maximum smoothness. Best for ranging markets, noise reduction, conservative trading. Trade-offs: slower signal generation, reduced sensitivity to recent price changes
HMA (Speed Optimized): Hull Moving Average, designed for reduced lag. Best for trending markets, quick reversals, active trading. Technical advantage: square root period weighting, faster trend detection. Caution: can be more sensitive to noise
KAMA (Adaptive): Kaufman Adaptive MA, adjusts smoothing based on market efficiency. Best for varying market conditions, algorithmic trading. Mechanism: fast smoothing in trends, slow smoothing in sideways markets. Complexity: requires understanding of efficiency ratio
Signal Line Algorithm Optimization Strategies:
Matching Strategy: Use same algorithm for both MACD and signal lines. Benefits: consistent mathematical properties, predictable behavior. Best when backtesting historical strategies, maintaining traditional MACD characteristics
Contrast Strategy: Use different algorithms for optimization. Common combinations: MACD=EMA, Signal=SMA for smoother crossovers, MACD=HMA, Signal=RMA for balanced speed/stability, Advanced: MACD=KAMA, Signal=T3 for adaptive behavior with smooth signals
Market Regime Adaptation: Trending markets: both fast algorithms (EMA/HMA), Volatile markets: MACD=KALMAN_FILTER, Signal=SUPER_SMOOTHER, Range-bound: both slow algorithms (SMA/RMA)
Parameter Sensitivity Considerations:
Impact of Parameter Changes:
Length Parameter Sensitivity: Small parameter adjustments can significantly affect signal timing, while larger adjustments may fundamentally change indicator behavior characteristics
Algorithm Sensitivity: Different algorithms produce different signal characteristics. Thoroughly test the impact on your trading strategy before switching algorithms
Combined Effects: Changing multiple parameters simultaneously can create unexpected effects. Recommendation: adjust parameters one at a time and thoroughly test each change
📈 PERFORMANCE ANALYSIS & COMPETITIVE ADVANTAGES
Response Characteristics by Algorithm:
Fastest Response: ZLEMA, HMA, T3 - minimal lag but higher noise
Balanced Performance: EMA, DEMA, TEMA - good trade-off between speed and stability
Highest Stability: SMA, RMA, TMA - reduced noise but increased lag
Adaptive Behavior: KAMA, FRAMA, MCGINLEY_DYNAMIC - automatically adjust to market conditions
Noise Filtering Capabilities:
Advanced algorithms like KALMAN_FILTER and SUPER_SMOOTHER help reduce false signals compared to traditional EMA-based MACD. Noise-reducing algorithms can provide more stable signals in volatile market conditions, though results will vary based on market conditions and parameter settings.
Market Condition Adaptability:
Unlike fixed-algorithm MACD, this enhanced version allows real-time optimization. Trending markets benefit from responsive algorithms (EMA, HMA), while ranging markets perform better with stable algorithms (SMA, RMA). The ability to switch algorithms without changing indicators provides greater flexibility.
Comparative Performance vs Traditional MACD:
Algorithm Flexibility: 21 algorithms vs 1 fixed EMA
Signal Quality: Reduced false signals through noise filtering algorithms
Market Adaptability: Optimizable for any market condition vs fixed behavior
Customization Options: Independent algorithm selection for MACD and signal lines vs forced matching
Professional Features: Advanced color coding, multiple alert conditions, comprehensive parameter control
USAGE NOTES
This indicator is designed for technical analysis and educational purposes. Like all technical indicators, it has limitations and should not be used as the sole basis for trading decisions. Algorithm performance varies with market conditions, and past characteristics do not guarantee future results. Always combine with proper risk management and thorough strategy testing.

Stochastic Enhanced [DCAUT]█ Stochastic Enhanced
📊 ORIGINALITY & INNOVATION
The Stochastic Enhanced indicator builds upon George Lane's classic momentum oscillator (developed in the late 1950s) by providing comprehensive smoothing algorithm flexibility. While traditional implementations limit users to Simple Moving Average (SMA) smoothing, this enhanced version offers 21 advanced smoothing algorithms, allowing traders to optimize the indicator's characteristics for different market conditions and trading styles.
Key Improvements:
Extended from single SMA smoothing to 21 professional-grade algorithms including adaptive filters (KAMA, FRAMA), zero-lag methods (ZLEMA, T3), and advanced digital filters (Kalman, Laguerre)
Maintains backward compatibility with traditional Stochastic calculations through SMA default setting
Unified smoothing algorithm applies to both %K and %D lines for consistent signal processing characteristics
Enhanced visual feedback with clear color distinction and background fill highlighting for intuitive signal recognition
Comprehensive alert system covering crossovers and zone entries for systematic trade management
Differentiation from Traditional Stochastic:
Traditional Stochastic indicators use fixed SMA smoothing, which introduces consistent lag regardless of market volatility. This enhanced version addresses the limitation by offering adaptive algorithms that adjust to market conditions (KAMA, FRAMA), reduce lag without sacrificing smoothness (ZLEMA, T3, HMA), or provide superior noise filtering (Kalman Filter, Laguerre filters). The flexibility helps traders balance responsiveness and stability according to their specific needs.
📐 MATHEMATICAL FOUNDATION
Core Stochastic Calculation:
The Stochastic Oscillator measures the position of the current close relative to the high-low range over a specified period:
Step 1: Raw %K Calculation
%K_raw = 100 × (Close - Lowest Low) / (Highest High - Lowest Low)
Where:
Close = Current closing price
Lowest Low = Lowest low over the %K Length period
Highest High = Highest high over the %K Length period
Result ranges from 0 (close at period low) to 100 (close at period high)
Step 2: Smoothed %K Calculation
%K = MA(%K_raw, K Smoothing Period, MA Type)
Where:
MA = Selected moving average algorithm (SMA, EMA, etc.)
K Smoothing = 1 for Fast Stochastic, 3+ for Slow Stochastic
Traditional Fast Stochastic uses %K_raw directly without smoothing
Step 3: Signal Line %D Calculation
%D = MA(%K, D Smoothing Period, MA Type)
Where:
%D acts as a signal line and moving average of %K
D Smoothing typically set to 3 periods in traditional implementations
Both %K and %D use the same MA algorithm for consistent behavior
Available Smoothing Algorithms (21 Options):
Standard Moving Averages:
SMA (Simple): Equal-weighted average, traditional default, consistent lag characteristics
EMA (Exponential): Recent price emphasis, faster response to changes, exponential decay weighting
RMA (Rolling/Wilder's): Smoothed average used in RSI, less reactive than EMA
WMA (Weighted): Linear weighting favoring recent data, moderate responsiveness
VWMA (Volume-Weighted): Incorporates volume data, reflects market participation intensity
Advanced Moving Averages:
HMA (Hull): Reduced lag with smoothness, uses weighted moving averages and square root period
ALMA (Arnaud Legoux): Gaussian distribution weighting, minimal lag with good noise reduction
LSMA (Least Squares): Linear regression based, fits trend line to data points
DEMA (Double Exponential): Reduced lag compared to EMA, uses double smoothing technique
TEMA (Triple Exponential): Further lag reduction, triple smoothing with lag compensation
ZLEMA (Zero-Lag Exponential): Lag elimination attempt using error correction, very responsive
TMA (Triangular): Double-smoothed SMA, very smooth but slower response
Adaptive & Intelligent Filters:
T3 (Tilson T3): Six-pass exponential smoothing with volume factor adjustment, excellent smoothness
FRAMA (Fractal Adaptive): Adapts to market fractal dimension, faster in trends, slower in ranges
KAMA (Kaufman Adaptive): Efficiency ratio based adaptation, responds to volatility changes
McGinley Dynamic: Self-adjusting mechanism following price more accurately, reduced whipsaws
Kalman Filter: Optimal estimation algorithm from aerospace engineering, dynamic noise filtering
Advanced Digital Filters:
Ultimate Smoother: Advanced digital filter design, superior noise rejection with minimal lag
Laguerre Filter: Time-domain filter with N-order implementation, adjustable lag characteristics
Laguerre Binomial Filter: 6-pole Laguerre filter, extremely smooth output for long-term analysis
Super Smoother: Butterworth filter implementation, removes high-frequency noise effectively
📊 COMPREHENSIVE SIGNAL ANALYSIS
Absolute Level Interpretation (%K Line):
%K Above 80: Overbought condition, price near period high, potential reversal or pullback zone, caution for new long entries
%K in 70-80 Range: Strong upward momentum, bullish trend confirmation, uptrend likely continuing
%K in 50-70 Range: Moderate bullish momentum, neutral to positive outlook, consolidation or mild uptrend
%K in 30-50 Range: Moderate bearish momentum, neutral to negative outlook, consolidation or mild downtrend
%K in 20-30 Range: Strong downward momentum, bearish trend confirmation, downtrend likely continuing
%K Below 20: Oversold condition, price near period low, potential bounce or reversal zone, caution for new short entries
Crossover Signal Analysis:
%K Crosses Above %D (Bullish Cross): Momentum shifting bullish, faster line overtakes slower signal, consider long entry especially in oversold zone, strongest when occurring below 20 level
%K Crosses Below %D (Bearish Cross): Momentum shifting bearish, faster line falls below slower signal, consider short entry especially in overbought zone, strongest when occurring above 80 level
Crossover in Midrange (40-60): Less reliable signals, often in choppy sideways markets, require additional confirmation from trend or volume analysis
Multiple Failed Crosses: Indicates ranging market or choppy conditions, reduce position sizes or avoid trading until clear directional move
Advanced Divergence Patterns (%K Line vs Price):
Bullish Divergence: Price makes lower low while %K makes higher low, indicates weakening bearish momentum, potential trend reversal upward, more reliable when %K in oversold zone
Bearish Divergence: Price makes higher high while %K makes lower high, indicates weakening bullish momentum, potential trend reversal downward, more reliable when %K in overbought zone
Hidden Bullish Divergence: Price makes higher low while %K makes lower low, indicates trend continuation in uptrend, bullish trend strength confirmation
Hidden Bearish Divergence: Price makes lower high while %K makes higher high, indicates trend continuation in downtrend, bearish trend strength confirmation
Momentum Strength Analysis (%K Line Slope):
Steep %K Slope: Rapid momentum change, strong directional conviction, potential for extended moves but also increased reversal risk
Gradual %K Slope: Steady momentum development, sustainable trends more likely, lower probability of sharp reversals
Flat or Horizontal %K: Momentum stalling, potential reversal or consolidation ahead, wait for directional break before committing
%K Oscillation Within Range: Indicates ranging market, sideways price action, better suited for range-trading strategies than trend following
🎯 STRATEGIC APPLICATIONS
Mean Reversion Strategy (Range-Bound Markets):
Identify ranging market conditions using price action or Bollinger Bands
Wait for Stochastic to reach extreme zones (above 80 for overbought, below 20 for oversold)
Enter counter-trend position when %K crosses %D in extreme zone (sell on bearish cross above 80, buy on bullish cross below 20)
Set profit targets near opposite extreme or midline (50 level)
Use tight stop-loss above recent swing high/low to protect against breakout scenarios
Exit when Stochastic reaches opposite extreme or %K crosses %D in opposite direction
Trend Following with Momentum Confirmation:
Identify primary trend direction using higher timeframe analysis or moving averages
Wait for Stochastic pullback to oversold zone (<20) in uptrend or overbought zone (>80) in downtrend
Enter in trend direction when %K crosses %D confirming momentum shift (bullish cross in uptrend, bearish cross in downtrend)
Use wider stops to accommodate normal trend volatility
Add to position on subsequent pullbacks showing similar Stochastic pattern
Exit when Stochastic shows opposite extreme with failed cross or bearish/bullish divergence
Divergence-Based Reversal Strategy:
Scan for divergence between price and Stochastic at swing highs/lows
Confirm divergence with at least two price pivots showing divergent Stochastic readings
Wait for %K to cross %D in direction of anticipated reversal as entry trigger
Enter position in divergence direction with stop beyond recent swing extreme
Target profit at key support/resistance levels or Fibonacci retracements
Scale out as Stochastic reaches opposite extreme zone
Multi-Timeframe Momentum Alignment:
Analyze Stochastic on higher timeframe (4H or Daily) for primary trend bias
Switch to lower timeframe (1H or 15M) for precise entry timing
Only take trades where lower timeframe Stochastic signal aligns with higher timeframe momentum direction
Higher timeframe Stochastic in bullish zone (>50) = only take long entries on lower timeframe
Higher timeframe Stochastic in bearish zone (<50) = only take short entries on lower timeframe
Exit when lower timeframe shows counter-signal or higher timeframe momentum reverses
Zone Transition Strategy:
Monitor Stochastic for transitions between zones (oversold to neutral, neutral to overbought, etc.)
Enter long when Stochastic crosses above 20 (exiting oversold), signaling momentum shift from bearish to neutral/bullish
Enter short when Stochastic crosses below 80 (exiting overbought), signaling momentum shift from bullish to neutral/bearish
Use zone midpoint (50) as dynamic support/resistance for position management
Trail stops as Stochastic advances through favorable zones
Exit when Stochastic fails to maintain momentum and reverses back into prior zone
📋 DETAILED PARAMETER CONFIGURATION
%K Length (Default: 14):
Lower Values (5-9): Highly sensitive to price changes, generates more frequent signals, increased false signals in choppy markets, suitable for very short-term trading and scalping
Standard Values (10-14): Balanced sensitivity and reliability, traditional default (14) widely used,适合 swing trading and intraday strategies
Higher Values (15-21): Reduced sensitivity, smoother oscillations, fewer but potentially more reliable signals, better for position trading and lower timeframe noise reduction
Very High Values (21+): Slow response, long-term momentum measurement, fewer trading signals, suitable for weekly or monthly analysis
%K Smoothing (Default: 3):
Value 1: Fast Stochastic, uses raw %K calculation without additional smoothing, most responsive to price changes, generates earliest signals with higher noise
Value 3: Slow Stochastic (default), traditional smoothing level, reduces false signals while maintaining good responsiveness, widely accepted standard
Values 5-7: Very slow response, extremely smooth oscillations, significantly reduced whipsaws but delayed entry/exit timing
Recommendation: Default value 3 suits most trading scenarios, active short-term traders may use 1, conservative long-term positions use 5+
%D Smoothing (Default: 3):
Lower Values (1-2): Signal line closely follows %K, frequent crossover signals, useful for active trading but requires strict filtering
Standard Value (3): Traditional setting providing balanced signal line behavior, optimal for most trading applications
Higher Values (4-7): Smoother signal line, fewer crossover signals, reduced whipsaws but slower confirmation, better for trend trading
Very High Values (8+): Signal line becomes slow-moving reference, crossovers rare and highly significant, suitable for long-term position changes only
Smoothing Type Algorithm Selection:
For Trending Markets:
ZLEMA, DEMA, TEMA: Reduced lag for faster trend entry, quick response to momentum shifts, suitable for strong directional moves
HMA, ALMA: Good balance of smoothness and responsiveness, effective for clean trend following without excessive noise
EMA: Classic choice for trending markets, faster than SMA while maintaining reasonable stability
For Ranging/Choppy Markets:
Kalman Filter, Super Smoother: Superior noise filtering, reduces false signals in sideways action, helps identify genuine reversal points
Laguerre Filters: Smooth oscillations with adjustable lag, excellent for mean reversion strategies in ranges
T3, TMA: Very smooth output, filters out market noise effectively, clearer extreme zone identification
For Adaptive Market Conditions:
KAMA: Automatically adjusts to market efficiency, fast in trends and slow in congestion, reduces whipsaws during transitions
FRAMA: Adapts to fractal market structure, responsive during directional moves, conservative during uncertainty
McGinley Dynamic: Self-adjusting smoothing, follows price naturally, minimizes lag in trending markets while filtering noise in ranges
For Conservative Long-Term Analysis:
SMA: Traditional choice, predictable behavior, widely understood characteristics
RMA (Wilder's): Smooth oscillations, reduced sensitivity to outliers, consistent behavior across market conditions
Laguerre Binomial Filter: Extremely smooth output, ideal for weekly/monthly timeframe analysis, eliminates short-term noise completely
Source Selection:
Close (Default): Standard choice using closing prices, most common and widely tested
HLC3 or OHLC4: Incorporates more price information, reduces impact of sudden spikes or gaps, smoother oscillator behavior
HL2: Midpoint of high-low range, emphasizes intrabar volatility, useful for markets with wide intraday ranges
Custom Source: Can use other indicators as input (e.g., Heikin Ashi close, smoothed price), creates derivative momentum indicators
📈 PERFORMANCE ANALYSIS & COMPETITIVE ADVANTAGES
Responsiveness Characteristics:
Traditional SMA-Based Stochastic:
Fixed lag regardless of market conditions, consistent delay of approximately (K Smoothing + D Smoothing) / 2 periods
Equal treatment of trending and ranging markets, no adaptation to volatility changes
Predictable behavior but suboptimal in varying market regimes
Enhanced Version with Adaptive Algorithms:
KAMA and FRAMA reduce lag by up to 40-60% in strong trends compared to SMA while maintaining similar smoothness in ranges
ZLEMA and T3 provide near-zero lag characteristics for early entry signals with acceptable noise levels
Kalman Filter and Super Smoother offer superior noise rejection, reducing false signals in choppy conditions by estimations of 30-50% compared to SMA
Performance improvements vary by algorithm selection and market conditions
Signal Quality Improvements:
Adaptive algorithms help reduce whipsaw trades in ranging markets by adjusting sensitivity dynamically
Advanced filters (Kalman, Laguerre, Super Smoother) provide clearer extreme zone readings for mean reversion strategies
Zero-lag methods (ZLEMA, DEMA, TEMA) generate earlier crossover signals in trending markets for improved entry timing
Smoother algorithms (T3, Laguerre Binomial) reduce false extreme zone touches for more reliable overbought/oversold signals
Comparison with Standard Implementations:
Versus Basic Stochastic: Enhanced version offers 21 smoothing options versus single SMA, allowing optimization for specific market characteristics and trading styles
Versus RSI: Stochastic provides range-bound measurement (0-100) with clear extreme zones, RSI measures momentum speed, Stochastic offers clearer visual overbought/oversold identification
Versus MACD: Stochastic bounded oscillator suitable for mean reversion, MACD unbounded indicator better for trend strength, Stochastic excels in range-bound and oscillating markets
Versus CCI: Stochastic has fixed bounds (0-100) for consistent interpretation, CCI unbounded with variable extremes, Stochastic provides more standardized extreme readings across different instruments
Flexibility Advantages:
Single indicator adaptable to multiple strategies through algorithm selection rather than requiring different indicator variants
Ability to optimize smoothing characteristics for specific instruments (e.g., smoother for crypto volatility, faster for forex trends)
Multi-timeframe analysis with consistent algorithm across timeframes for coherent momentum picture
Backtesting capability with algorithm as optimization parameter for strategy development
Limitations and Considerations:
Increased complexity from multiple algorithm choices may lead to over-optimization if parameters are curve-fitted to historical data
Adaptive algorithms (KAMA, FRAMA) have adjustment periods during market regime changes where signals may be less reliable
Zero-lag algorithms sacrifice some smoothness for responsiveness, potentially increasing noise sensitivity in very choppy conditions
Performance characteristics vary significantly across algorithms, requiring understanding and testing before live implementation
Like all oscillators, Stochastic can remain in extreme zones for extended periods during strong trends, generating premature reversal signals
USAGE NOTES
This indicator is designed for technical analysis and educational purposes to provide traders with enhanced flexibility in momentum analysis. The Stochastic Oscillator has limitations and should not be used as the sole basis for trading decisions.
Important Considerations:
Algorithm performance varies with market conditions - no single smoothing method is optimal for all scenarios
Extreme zone signals (overbought/oversold) indicate potential reversal areas but not guaranteed turning points, especially in strong trends
Crossover signals may generate false entries during sideways choppy markets regardless of smoothing algorithm
Divergence patterns require confirmation from price action or additional indicators before trading
Past indicator characteristics and backtested results do not guarantee future performance
Always combine Stochastic analysis with proper risk management, position sizing, and multi-indicator confirmation
Test selected algorithm on historical data of specific instrument and timeframe before live trading
Market regime changes may require algorithm adjustment for optimal performance
The enhanced smoothing options are intended to provide tools for optimizing the indicator's behavior to match individual trading styles and market characteristics, not to create a perfect predictive tool. Responsible usage includes understanding the mathematical properties of selected algorithms and their appropriate application contexts.

[blackcat] L3 Dynamic CrossOVERVIEW
The L3 Dynamic Cross indicator is a powerful tool designed to assist traders in identifying potential buy and sell opportunities through the use of dynamic moving averages. This versatile script offers a wide range of customizable options, allowing users to tailor the moving averages to their specific needs and preferences. By providing clear visual cues and generating precise crossover signals, it helps traders make informed decisions about market trends and potential entry/exit points 📈💹.
FEATURES
Multiple Moving Average Types:
Simple Moving Average (SMA): Provides a straightforward average of prices over a specified period.
Exponential Moving Average (EMA): Gives more weight to recent prices, making it responsive to new information.
Weighted Moving Average (WMA): Assigns weights to all prices within the look-back period, giving more importance to recent prices.
Volume Weighted Moving Average (VWMA): Incorporates volume data to provide a more accurate representation of price movements.
Smoothed Moving Average (SMMA): Averages out fluctuations to create a smoother trend line.
Double Exponential Moving Average (DEMA): Reduces lag by applying two layers of exponential smoothing.
Triple Exponential Moving Average (TEMA): Further reduces lag with three layers of exponential smoothing.
Hull Moving Average (HullMA): Combines weighted moving averages to minimize lag and noise.
Super Smoother Moving Average (SSMA): Uses a sophisticated algorithm to smooth out price data while preserving trend direction.
Zero-Lag Exponential Moving Average (ZEMA): Eliminates lag entirely by adjusting the calculation method.
Triangular Moving Average (TMA): Applies a double smoothing process to reduce volatility and enhance trend identification.
Customizable Parameters:
Length: Adjust the period for both fast and slow moving averages to match your trading style.
Source: Select different price sources such as close, open, high, or low for more nuanced analysis.
Visual Representation:
Fast MA: Displayed as a green line representing shorter-term trends.
Slow MA: Shown as a red line indicating longer-term trends.
Crossover Signals:
Generate buy ('BUY') and sell ('SELL') labels based on crossover events between the fast and slow moving averages 🏷️.
Clear visual cues help traders quickly identify potential entry and exit points.
Alert Functionality:
Receive real-time notifications when crossover conditions are met, ensuring timely action 🔔.
Customizable alert messages for personalized trading strategies.
Advanced Trade Management:
Support for pyramiding levels allows traders to manage multiple positions effectively.
Fine-tune your risk management by setting the number of allowed trades per signal.
HOW TO USE
Adding the Indicator:
Open your TradingView chart and go to the indicators list.
Search for L3 Dynamic Cross and add it to your chart.
Configuring Settings:
Choose your desired Moving Average Type from the dropdown menu.
Adjust the Fast MA Length and Slow MA Length according to your trading timeframe.
Select appropriate Price Sources for both fast and slow moving averages.
Monitoring Signals:
Observe the plotted lines on the chart to track short-term and long-term trends.
Look for buy and sell labels that indicate potential trade opportunities.
Setting Up Alerts:
Enable alerts based on crossover conditions to receive instant notifications.
Customize alert messages to suit your trading plan.
Managing Positions:
Utilize the pyramiding feature to handle multiple entries and exits efficiently.
Keep track of your position sizes relative to the defined pyramiding levels.
Combining with Other Tools:
Integrate this indicator with other technical analysis tools for confirmation.
Use additional filters like volume, RSI, or MACD to enhance decision-making accuracy.
LIMITATIONS
Market Conditions: The effectiveness of the indicator may vary in highly volatile or sideways markets. Be cautious during periods of low liquidity or sudden price spikes 🌪️.
Parameter Sensitivity: Different moving average types and lengths can produce varying results. Experiment with settings to find what works best for your asset class and timeframe.
False Signals: Like any technical indicator, false signals can occur. Always confirm signals with other forms of analysis before executing trades.
NOTES
Historical Data: Ensure you have enough historical data loaded into your chart for accurate moving average calculations.
Backtesting: Thoroughly backtest the indicator on various assets and timeframes using demo accounts before deploying it in live trading environments 🔍.
Customization: Feel free to adjust colors, line widths, and label styles to better fit your chart aesthetics and personal preferences.
EXAMPLE STRATEGIES
Trend Following: Use the indicator to ride trends by entering positions when the fast MA crosses above/below the slow MA and exiting when the opposite occurs.
Mean Reversion: Identify overbought/oversold conditions by combining the indicator with oscillators like RSI or Stochastic. Enter counter-trend positions when the moving averages diverge significantly from the mean.
Scalping: Apply tight moving average settings to capture small, quick profits in intraday trading. Combine with volume indicators to filter out weak signals.

three Supertrend EMA Strategy by Prasanna +DhanuThe indicator described in your Pine Script is a Supertrend EMA Strategy that combines the Supertrend and EMA (Exponential Moving Average) to create a trend-following strategy. Here’s a detailed breakdown of how this indicator works:
1. EMA (Exponential Moving Average):
The EMA is a moving average that places more weight on recent prices, making it more responsive to price changes compared to a simple moving average (SMA). In this strategy, the EMA is used to determine the overall trend direction.
Input Parameter:
ema_length: This is the period for the EMA, set to 50 periods by default. A shorter EMA will respond more quickly to price movements, while a longer EMA is smoother and less sensitive to short-term fluctuations.
How it's used:
If the price is above the EMA, it indicates an uptrend.
If the price is below the EMA, it indicates a downtrend.
2. Supertrend Indicator:
The Supertrend indicator is a trend-following tool based on the Average True Range (ATR), which is a volatility measure. It helps to identify the direction of the trend by setting a dynamic support or resistance level.
Input Parameters:
supertrend_atr_period: The period used for calculating the ATR, set to 10 periods by default.
supertrend_multiplier1: Multiplier for the first Supertrend, set to 3.0.
supertrend_multiplier2: Multiplier for the second Supertrend, set to 2.0.
supertrend_multiplier3: Multiplier for the third Supertrend, set to 1.0.
Each Supertrend line has a different multiplier, which affects its sensitivity to price changes. The ATR period defines how many periods of price data are used to calculate the ATR.
How the Supertrend works:
If the Supertrend value is below the price, the trend is considered bullish (uptrend).
If the Supertrend value is above the price, the trend is considered bearish (downtrend).
The Supertrend will switch between up and down based on price movement and ATR, providing a dynamic trend-following signal.
3. Three Supertrend Lines:
In this strategy, three Supertrend lines are calculated with different multipliers and the same ATR period (10 periods). Each line is more or less sensitive to price changes, and they are plotted on the chart in different colors based on whether the trend is bullish (green) or bearish (red).
Supertrend 1: The most sensitive Supertrend with a multiplier of 3.0.
Supertrend 2: A moderately sensitive Supertrend with a multiplier of 2.0.
Supertrend 3: The least sensitive Supertrend with a multiplier of 1.0.
Each Supertrend line signals a bullish trend when its value is below the price and a bearish trend when its value is above the price.
4. Strategy Rules:
This strategy uses the three Supertrend lines combined with the EMA to generate trade signals.
Entry Conditions:
A long entry is triggered when all three Supertrend lines are in an uptrend (i.e., all three Supertrend lines are below the price), and the price is above the EMA. This suggests a strong bullish market condition.
A short entry is triggered when all three Supertrend lines are in a downtrend (i.e., all three Supertrend lines are above the price), and the price is below the EMA. This suggests a strong bearish market condition.
Exit Conditions:
A long exit occurs when the third Supertrend (the least sensitive one) switches to a downtrend (i.e., the price falls below it).
A short exit occurs when the third Supertrend switches to an uptrend (i.e., the price rises above it).
5. Visualization:
The strategy also plots the following on the chart:
The EMA is plotted as a blue line, which helps identify the overall trend.
The three Supertrend lines are plotted with different colors:
Supertrend 1: Green (for uptrend) and Red (for downtrend).
Supertrend 2: Green (for uptrend) and Red (for downtrend).
Supertrend 3: Green (for uptrend) and Red (for downtrend).
Summary of the Strategy:
The strategy combines three Supertrend indicators (with different multipliers) and an EMA to capture both short-term and long-term trends.
Long positions are entered when all three Supertrend lines are bullish and the price is above the EMA.
Short positions are entered when all three Supertrend lines are bearish and the price is below the EMA.
Exits occur when the third Supertrend line (the least sensitive) signals a change in trend direction.
This combination of indicators allows for a robust trend-following strategy that adapts to both short-term volatility and long-term trend direction. The Supertrend lines provide quick reaction to price changes, while the EMA offers a smoother, more stable trend direction for confirmation.
The indicator described in your Pine Script is a Supertrend EMA Strategy that combines the Supertrend and EMA (Exponential Moving Average) to create a trend-following strategy. Here’s a detailed breakdown of how this indicator works:
1. EMA (Exponential Moving Average):
The EMA is a moving average that places more weight on recent prices, making it more responsive to price changes compared to a simple moving average (SMA). In this strategy, the EMA is used to determine the overall trend direction.
Input Parameter:
ema_length: This is the period for the EMA, set to 50 periods by default. A shorter EMA will respond more quickly to price movements, while a longer EMA is smoother and less sensitive to short-term fluctuations.
How it's used:
If the price is above the EMA, it indicates an uptrend.
If the price is below the EMA, it indicates a downtrend.
2. Supertrend Indicator:
The Supertrend indicator is a trend-following tool based on the Average True Range (ATR), which is a volatility measure. It helps to identify the direction of the trend by setting a dynamic support or resistance level.
Input Parameters:
supertrend_atr_period: The period used for calculating the ATR, set to 10 periods by default.
supertrend_multiplier1: Multiplier for the first Supertrend, set to 3.0.
supertrend_multiplier2: Multiplier for the second Supertrend, set to 2.0.
supertrend_multiplier3: Multiplier for the third Supertrend, set to 1.0.
Each Supertrend line has a different multiplier, which affects its sensitivity to price changes. The ATR period defines how many periods of price data are used to calculate the ATR.
How the Supertrend works:
If the Supertrend value is below the price, the trend is considered bullish (uptrend).
If the Supertrend value is above the price, the trend is considered bearish (downtrend).
The Supertrend will switch between up and down based on price movement and ATR, providing a dynamic trend-following signal.
3. Three Supertrend Lines:
In this strategy, three Supertrend lines are calculated with different multipliers and the same ATR period (10 periods). Each line is more or less sensitive to price changes, and they are plotted on the chart in different colors based on whether the trend is bullish (green) or bearish (red).
Supertrend 1: The most sensitive Supertrend with a multiplier of 3.0.
Supertrend 2: A moderately sensitive Supertrend with a multiplier of 2.0.
Supertrend 3: The least sensitive Supertrend with a multiplier of 1.0.
Each Supertrend line signals a bullish trend when its value is below the price and a bearish trend when its value is above the price.
4. Strategy Rules:
This strategy uses the three Supertrend lines combined with the EMA to generate trade signals.
Entry Conditions:
A long entry is triggered when all three Supertrend lines are in an uptrend (i.e., all three Supertrend lines are below the price), and the price is above the EMA. This suggests a strong bullish market condition.
A short entry is triggered when all three Supertrend lines are in a downtrend (i.e., all three Supertrend lines are above the price), and the price is below the EMA. This suggests a strong bearish market condition.
Exit Conditions:
A long exit occurs when the third Supertrend (the least sensitive one) switches to a downtrend (i.e., the price falls below it).
A short exit occurs when the third Supertrend switches to an uptrend (i.e., the price rises above it).
5. Visualization:
The strategy also plots the following on the chart:
The EMA is plotted as a blue line, which helps identify the overall trend.
The three Supertrend lines are plotted with different colors:
Supertrend 1: Green (for uptrend) and Red (for downtrend).
Supertrend 2: Green (for uptrend) and Red (for downtrend).
Supertrend 3: Green (for uptrend) and Red (for downtrend).
Summary of the Strategy:
The strategy combines three Supertrend indicators (with different multipliers) and an EMA to capture both short-term and long-term trends.
Long positions are entered when all three Supertrend lines are bullish and the price is above the EMA.
Short positions are entered when all three Supertrend lines are bearish and the price is below the EMA.
Exits occur when the third Supertrend line (the least sensitive) signals a change in trend direction.
This combination of indicators allows for a robust trend-following strategy that adapts to both short-term volatility and long-term trend direction. The Supertrend lines provide quick reaction to price changes, while the EMA offers a smoother, more stable trend direction for confirmation.

Heiken Ashi MTF Monitor - Better Formula - EMA, AMA, KAFA, T3Heiken Ashi MTF Monitor - Better Formula - EMA, AMA, KAFA, T3
This indicator is based on the works of Loxx & Smart_Money-Trader, without their initial codes, none of this will be possible.
This Pine Script indicator provides a multi-timeframe (MTF) analysis of Heiken Ashi trends, designed to enhance the traditional Heiken Ashi method with advanced smoothing techniques such as the Exponential Moving Average (EMA), Adaptive Moving Average (AMA), Kaufman’s Adaptive Moving Average (KAMA), and the Triple Exponential Moving Average (T3). The indicator offers a flexible approach to identify bullish, bearish, and neutral trends across six customizable timeframes and various Heiken Ashi calculation methods.
Key Features:
Multi-Timeframe (MTF) Support: The indicator allows you to monitor trends across six timeframes (e.g., 2-hour, 4-hour, daily, weekly, monthly), giving a holistic view of market conditions at different scales.
Heiken Ashi Calculation Methods: Choose between traditional Heiken Ashi or an enhanced "Better HA" method for more refined trend analysis.
Smoothing Options: Apply different smoothing techniques, including EMA, T3, KAMA, or AMA, to the Heiken Ashi values for smoother, more reliable trend signals.
Non-Repaint Option: This feature ensures that the values do not repaint after the bar closes, providing a more reliable historical view.
Customizable Plotting: The indicator offers full customization of which timeframes to display and whether to show labels for each timeframe.
Inputs and Settings:
Timeframe Inputs:
Users can set up to six different timeframes, ranging from intraday (2-hour, 4-hour) to higher timeframes (daily, weekly, monthly).
Timeframes can be enabled or disabled individually for each analysis.
Label Visibility:
Labels indicating the trend direction (bullish, bearish, neutral) can be shown for each timeframe. This helps with clarity when monitoring multiple timeframes simultaneously.
Smoothing Options:
EMA: Exponential Moving Average for standard smoothing.
AMA: Adaptive Moving Average, which adapts its smoothing based on market volatility.
KAMA: Kaufman’s Adaptive Moving Average, which adjusts its sensitivity to price fluctuations.
T3: Triple Exponential Moving Average, providing a smoother and more responsive moving average.
None: No smoothing applied (for raw Heiken Ashi calculations).
Non-Repaint Setting:
Enabling this ensures the trend values do not change after the bar closes, offering a stable historical view of trends.
Core Functions:
Heiken Ashi Calculations:
Traditional HA: The classic Heiken Ashi calculation is used here, where each bar's open, close, high, and low are computed based on the average price of the previous bar.
Better HA: A refined calculation method, where the raw Heiken Ashi close is adjusted by considering the price range. This smoother value is then optionally processed through a moving average function for further smoothing.
Heiken Ashi Trend Calculation:
Based on the selected Heiken Ashi method (Traditional or Better HA), the indicator checks whether the trend is bullish (upward movement), bearish (downward movement), or neutral (sideways movement).
For the "Better HA" method, the trend determination uses the difference between the smoothed Heiken Ashi close and open.
Moving Averages:
The moving averages applied to the Heiken Ashi values are configurable:
EMA: Standard smoothing with an exponential weighting.
T3: A triple exponential smoothing technique that provides a smoother moving average.
KAMA: An adaptive smoothing technique that adjusts to market noise.
AMA: An adaptive moving average that reacts to market volatility, making it more flexible.
None: For raw, unsmoothed Heiken Ashi data.
Trend Detection:
The indicator evaluates the direction of the trend for each timeframe and assigns a color-coded value (bearish, bullish, or neutral).
The trend values are plotted as circles, and their color reflects the detected trend: red for bearish, green for bullish, and white for neutral.
Multi-Timeframe (MTF) Support:
The indicator can be used to analyze up to six different timeframes simultaneously.
The trend for each timeframe is calculated and displayed as circles on the chart.
Users can enable or disable individual timeframes, allowing for a customizable view based on which timeframes they are interested in monitoring.
Plotting:
The indicator plots circles at specific levels based on the detected trend (Level 1 for the 2-hour timeframe, Level 2 for the 4-hour timeframe, etc.). The size and color of these circles represent the trend direction.
These plotted values provide a quick visual reference for trend direction across multiple timeframes.
Usage:
Trend Confirmation: By monitoring trends across multiple timeframes, traders can use this indicator to confirm trends and avoid false signals.
Customizable Timeframe Analysis: Traders can focus on shorter timeframes for intraday trades or look at longer timeframes for a broader market perspective.
Smoothing for Clarity: By applying various moving average techniques, traders can reduce noise and get a clearer view of the trend.
Non-Repainting: The non-repaint option ensures the indicator values remain consistent even after the bar closes, providing more reliable signals for backtesting or live trading.
This Heiken Ashi MTF Monitor indicator with better formulas and smoothing options is designed for traders who want to analyze trends across multiple timeframes while benefiting from advanced moving averages and more refined Heiken Ashi calculations. The customizable settings for smoothing, timeframe selection, and label visibility allow users to tailor the indicator to their specific needs and trading style.

Regression Line (Log)This indicator is based on the "Linear Regression Channel (Log)," which, in turn, is derived from TradingView's "Linear Regression Channel."
The "Regression Line (Log)" indicator is a valuable tool for traders and investors seeking to gain insights into long-term market trends. This indicator is personally favored for its ability to provide a comprehensive view of price movements over extended periods. It offers a unique perspective compared to traditional linear regression lines and moving averages, making it a valuable addition to the toolkit of experienced traders and investors.
Indicator Parameters:
Before delving into the details, it's worth noting that the chosen number of periods (2870) is a personal preference. This specific value is utilized for the S&P 500 index due to its alignment with various theories regarding the beginning of the modern economic era in the stock market. Different analysts propose different starting points, such as the 1950s, 1970s, or 1980s. However, users are encouraged to adjust this parameter to suit their specific needs and trading strategies.
How It Works:
The "Regression Line (Log)" indicator operates by transforming the closing price data into a logarithmic scale. This transformation can make the linear regression more suitable for data with exponential trends or rapid growth. Here's a breakdown of its functioning and why it can be advantageous for long-term trend analysis:
1. Logarithmic Transformation : The indicator begins by applying a logarithmic transformation to the closing price. This transformation helps capture price movements proportionally, making it especially useful for assets that exhibit exponential or rapid growth. This transformation can render linear regression more suitable for data with exponential or fast-paced trends.
2. Linear Regression on Log Scale : After the logarithmic transformation, the indicator calculates a linear regression line (lrc) on this log-transformed data. This step provides a smoother representation of long-term trends compared to a linear regression line on a linear scale.
3. Exponential Reversion : To present the results in a more familiar format, the indicator reverts the log-transformed regression line back to a linear scale using the math.exp function. This final output is the "Linear Regression Curve," which can be easily interpreted on standard price charts.
Advantages:
- Long-Term Trend Clarity : The logarithmic scale better highlights long-term trends and exponential price movements, making it a valuable tool for investors seeking to identify extended trends.
- Smoothing Effect : The logarithmic transformation and linear regression on a log scale smooth out price data, reducing noise and providing a clearer view of underlying trends.
- Adaptability : The indicator allows traders and investors to customize the number of periods (length) to align with their preferred historical perspective or trading strategy.
- Complementary to Other Tools : While not meant to replace other technical indicators, the "Regression Line (Log)" indicator complements traditional linear regression lines and moving averages, offering an alternative perspective for more comprehensive analysis.
Conclusion:
In summary, the "Regression Line (Log)" indicator is a versatile tool that can enhance your ability to analyze long-term market trends. Its logarithmic transformation provides a unique perspective on price data, particularly suited for assets with exponential growth patterns. While the choice of the number of periods is a personal one, it can be adapted to fit various historical viewpoints. This indicator is best utilized as part of a well-rounded trading strategy, in conjunction with other technical tools, to aid in informed decision-making.
CCI+EMA Strategy with Percentage or ATR TP/SL [Alifer]This is a momentum strategy based on the Commodity Channel Index (CCI), with the aim of entering long trades in oversold conditions and short trades in overbought conditions.
Optionally, you can enable an Exponential Moving Average (EMA) to only allow trading in the direction of the larger trend. Please note that the strategy will not plot the EMA. If you want, for visual confirmation, you can add to the chart an Exponential Moving Average as a second indicator, with the same settings used in the strategy’s built-in EMA.
The strategy also allows you to set internal Stop Loss and Take Profit levels, with the option to choose between Percentage-based TP/SL or ATR-based TP/SL.
The strategy can be adapted to multiple assets and timeframes:
Pick an asset and a timeframe
Zoom back as far as possible to identify meaningful positive and negative peaks of the CCI
Set Overbought and Oversold at a rough average of the peaks you identified
Adjust TP/SL according to your risk management strategy
Like the strategy? Give it a boost!
Have any questions? Leave a comment or drop me a message.
CAUTIONARY WARNING
Please note that this is a complex trading strategy that involves several inputs and conditions. Before using it in live trading, it is highly recommended to thoroughly test it on historical data and use risk management techniques to safeguard your capital. After backtesting, it's also highly recommended to perform a first live test with a small amount. Additionally, it's essential to have a good understanding of the strategy's behavior and potential risks. Only risk what you can afford to lose .
USED INDICATORS
1 — COMMODITY CHANNEL INDEX (CCI)
The Commodity Channel Index (CCI) is a technical analysis indicator used to measure the momentum of an asset. It was developed by Donald Lambert and first published in Commodities magazine (now Futures) in 1980. Despite its name, the CCI can be used in any market and is not just for commodities. The CCI compares current price to average price over a specific time period. The indicator fluctuates above or below zero, moving into positive or negative territory. While most values, approximately 75%, fall between -100 and +100, about 25% of the values fall outside this range, indicating a lot of weakness or strength in the price movement.
The CCI was originally developed to spot long-term trend changes but has been adapted by traders for use on all markets or timeframes. Trading with multiple timeframes provides more buy or sell signals for active traders. Traders often use the CCI on the longer-term chart to establish the dominant trend and on the shorter-term chart to isolate pullbacks and generate trade signals.
CCI is calculated with the following formula:
(Typical Price - Simple Moving Average) / (0.015 x Mean Deviation)
Some trading strategies based on CCI can produce multiple false signals or losing trades when conditions turn choppy. Implementing a stop-loss strategy can help cap risk, and testing the CCI strategy for profitability on your market and timeframe is a worthy first step before initiating trades.
2 — AVERAGE TRUE RANGE (ATR)
The Average True Range (ATR) is a technical analysis indicator that measures market volatility by calculating the average range of price movements in a financial asset over a specific period of time. The ATR was developed by J. Welles Wilder Jr. and introduced in his book “New Concepts in Technical Trading Systems” in 1978.
The ATR is calculated by taking the average of the true range over a specified period. The true range is the greatest of the following:
The difference between the current high and the current low.
The difference between the previous close and the current high.
The difference between the previous close and the current low.
The ATR can be used to set stop-loss orders. One way to use ATR for stop-loss orders is to multiply the ATR by a factor (such as 2 or 3) and subtract it from the entry price for long positions or add it to the entry price for short positions. This can help traders set stop-loss orders that are more adaptive to market volatility.
3 — EXPONENTIAL MOVING AVERAGE (EMA)
The Exponential Moving Average (EMA) is a type of moving average (MA) that places a greater weight and significance on the most recent data points.
The EMA is calculated by taking the average of the true range over a specified period. The true range is the greatest of the following:
The difference between the current high and the current low.
The difference between the previous close and the current high.
The difference between the previous close and the current low.
The EMA can be used by traders to produce buy and sell signals based on crossovers and divergences from the historical average. Traders often use several different EMA lengths, such as 10-day, 50-day, and 200-day moving averages.
The formula for calculating EMA is as follows:
Compute the Simple Moving Average (SMA).
Calculate the multiplier for weighting the EMA.
Calculate the current EMA using the following formula:
EMA = Closing price x multiplier + EMA (previous day) x (1-multiplier)
STRATEGY EXPLANATION
1 — INPUTS AND PARAMETERS
The strategy uses the Commodity Channel Index (CCI) with additional options for an Exponential Moving Average (EMA), Take Profit (TP) and Stop Loss (SL).
length : The period length for the CCI calculation.
overbought : The overbought level for the CCI. When CCI crosses above this level, it may signal a potential short entry.
oversold : The oversold level for the CCI. When CCI crosses below this level, it may signal a potential long entry.
useEMA : A boolean input to enable or disable the use of Exponential Moving Average (EMA) as a filter for long and short entries.
emaLength : The period length for the EMA if it is used.
2 — CCI CALCULATION
The CCI indicator is calculated using the following formula:
(src - ma) / (0.015 * ta.dev(src, length))
src is the typical price (average of high, low, and close) and ma is the Simple Moving Average (SMA) of src over the specified length.
3 — EMA CALCULATION
If the useEMA option is enabled, an EMA is calculated with the given emaLength .
4 — TAKE PROFIT AND STOP LOSS METHODS
The strategy offers two methods for TP and SL calculations: percentage-based and ATR-based.
tpSlMethod_percentage : A boolean input to choose the percentage-based method.
tpSlMethod_atr : A boolean input to choose the ATR-based method.
5 — PERCENTAGE-BASED TP AND SL
If tpSlMethod_percentage is chosen, the strategy calculates the TP and SL levels based on a percentage of the average entry price.
tp_percentage : The percentage value for Take Profit.
sl_percentage : The percentage value for Stop Loss.
6 — ATR-BASED TP AND SL
If tpSlMethod_atr is chosen, the strategy calculates the TP and SL levels based on Average True Range (ATR).
atrLength : The period length for the ATR calculation.
atrMultiplier : A multiplier applied to the ATR to set the SL level.
riskRewardRatio : The risk-reward ratio used to calculate the TP level.
7 — ENTRY CONDITIONS
The strategy defines two conditions for entering long and short positions based on CCI and, optionally, EMA.
Long Entry: CCI crosses below the oversold level, and if useEMA is enabled, the closing price should be above the EMA.
Short Entry: CCI crosses above the overbought level, and if useEMA is enabled, the closing price should be below the EMA.
8 — TP AND SL LEVELS
The strategy calculates the TP and SL levels based on the chosen method and updates them dynamically.
For the percentage-based method, the TP and SL levels are calculated as a percentage of the average entry price.
For the ATR-based method, the TP and SL levels are calculated using the ATR value and the specified multipliers.
9 — EXIT CONDITIONS
The strategy defines exit conditions for both long and short positions.
If there is a long position, it will be closed either at TP or SL levels based on the chosen method.
If there is a short position, it will be closed either at TP or SL levels based on the chosen method.
Additionally, positions will be closed if CCI crosses back above oversold in long positions or below overbought in short positions.
10 — PLOTTING
The script plots the CCI line along with overbought and oversold levels as horizontal lines.
The CCI line is colored red when above the overbought level, green when below the oversold level, and white otherwise.
The shaded region between the overbought and oversold levels is plotted as well.

loxxmas - moving averages used in Loxx's indis & stratsLibrary "loxxmas"
TODO:loxx moving averages used in indicators
kama(src, len, kamafastend, kamaslowend)
KAMA Kaufman adaptive moving average
Parameters:
src : float
len : int
kamafastend : int
kamaslowend : int
Returns: array
ama(src, len, fl, sl)
AMA, adaptive moving average
Parameters:
src : float
len : int
fl : int
sl : int
Returns: array
t3(src, len)
T3 moving average, adaptive moving average
Parameters:
src : float
len : int
Returns: array
adxvma(src, len)
ADXvma - Average Directional Volatility Moving Average
Parameters:
src : float
len : int
Returns: array
ahrma(src, len)
Ahrens Moving Average
Parameters:
src : float
len : int
Returns: array
alxma(src, len)
Alexander Moving Average - ALXMA
Parameters:
src : float
len : int
Returns: array
dema(src, len)
Double Exponential Moving Average - DEMA
Parameters:
src : float
len : int
Returns: array
dsema(src, len)
Double Smoothed Exponential Moving Average - DSEMA
Parameters:
src : float
len : int
Returns: array
ema(src, len)
Exponential Moving Average - EMA
Parameters:
src : float
len : int
Returns: array
fema(src, len)
Fast Exponential Moving Average - FEMA
Parameters:
src : float
len : int
Returns: array
hma(src, len)
Hull moving averge
Parameters:
src : float
len : int
Returns: array
ie2(src, len)
Early T3 by Tim Tilson
Parameters:
src : float
len : int
Returns: array
frama(src, len, FC, SC)
Fractal Adaptive Moving Average - FRAMA
Parameters:
src : float
len : int
FC : int
SC : int
Returns: array
instant(src, float)
Instantaneous Trendline
Parameters:
src : float
float : alpha
Returns: array
ilrs(src, int)
Integral of Linear Regression Slope - ILRS
Parameters:
src : float
int : len
Returns: array
laguerre(src, float)
Laguerre Filter
Parameters:
src : float
float : alpha
Returns: array
leader(src, int)
Leader Exponential Moving Average
Parameters:
src : float
int : len
Returns: array
lsma(src, int, int)
Linear Regression Value - LSMA (Least Squares Moving Average)
Parameters:
src : float
int : len
int : offset
Returns: array
lwma(src, int)
Linear Weighted Moving Average - LWMA
Parameters:
src : float
int : len
Returns: array
mcginley(src, int)
McGinley Dynamic
Parameters:
src : float
int : len
Returns: array
mcNicholl(src, int)
McNicholl EMA
Parameters:
src : float
int : len
Returns: array
nonlagma(src, int)
Non-lag moving average
Parameters:
src : float
int : len
Returns: array
pwma(src, int, float)
Parabolic Weighted Moving Average
Parameters:
src : float
int : len
float : pwr
Returns: array
rmta(src, int)
Recursive Moving Trendline
Parameters:
src : float
int : len
Returns: array
decycler(src, int)
Simple decycler - SDEC
Parameters:
src : float
int : len
Returns: array
sma(src, int)
Simple Moving Average
Parameters:
src : float
int : len
Returns: array
swma(src, int)
Sine Weighted Moving Average
Parameters:
src : float
int : len
Returns: array
slwma(src, int)
linear weighted moving average
Parameters:
src : float
int : len
Returns: array
smma(src, int)
Smoothed Moving Average - SMMA
Parameters:
src : float
int : len
Returns: array
super(src, int)
Ehlers super smoother
Parameters:
src : float
int : len
Returns: array
smoother(src, int)
Smoother filter
Parameters:
src : float
int : len
Returns: array
tma(src, int)
Triangular moving average - TMA
Parameters:
src : float
int : len
Returns: array
tema(src, int)
Tripple exponential moving average - TEMA
Parameters:
src : float
int : len
Returns: array
vwema(src, int)
Volume weighted ema - VEMA
Parameters:
src : float
int : len
Returns: array
vwma(src, int)
Volume weighted moving average - VWMA
Parameters:
src : float
int : len
Returns: array
zlagdema(src, int)
Zero-lag dema
Parameters:
src : float
int : len
Returns: array
zlagma(src, int)
Zero-lag moving average
Parameters:
src : float
int : len
Returns: array
zlagtema(src, int)
Zero-lag tema
Parameters:
src : float
int : len
Returns: array
threepolebuttfilt(src, int)
Three-pole Ehlers Butterworth
Parameters:
src : float
int : len
Returns: array
threepolesss(src, int)
Three-pole Ehlers smoother
Parameters:
src : float
int : len
Returns: array
twopolebutter(src, int)
Two-pole Ehlers Butterworth
Parameters:
src : float
int : len
Returns: array
twopoless(src, int)
Two-pole Ehlers smoother
Parameters:
src : float
int : len
Returns: array
HEYC-Bands-Strategy by HassonyaHey guys, HEYC-Bands-Strategy indicator is moving average envelopes trend tracker system are pivot-based envelopes set above and below a moving average. Envelope is then set the high and low above or below the moving average. This creates parallel bands that follow price action. With a moving average as the base, Moving Average Envelopes can be used as a trend following indicator. However, this indicator is not limited to just trend following. You can also use it as support and resistance. The indicator aims to ensure that you follow the trend with maximum consistency and stay in the trend.
The indicator has 15 different options that form the basis of the moving average. What options are these?
- EMA - Exponential Moving Average
- WMA - Weighted Moving Average
- VWMA - Volume-Weighted Moving Average
- DEMA - Double Exponential Moving Average
- TEMA - Triple Exponential Moving Average
- LAGMA - Laguerre Moving Average
- HULLMA - Hull Moving Average
- EHMA - Exponential Hull Moving Average
- ETMA - Exponential Triangular Moving Average
- SSMA - Super-Smoother Moving Average
- ALMA - Arnaud Legoux Moving Average
- VIDYA - Variable Index Dynamic Average
- STMA - Triangular Moving Average
- ZEMA - Zero-Lag Exponential Moving Average
- SMA - Simple Moving Average
With the simplest logic, you can use it as buy when the price closes on the band, and sell when the price closes below the band.
Vertical lines and background guide you in the buying/selling trend changes in the indicator settings.
Thanks for support
