5 Moving Average Exponential 7-15-30-50-2005 Moving Average Exponential. Crypto EMA. 7 is a fast support or resistance, 15 confirmation support or resistance. 30 Important support and resistance. 50 institutional support or resistance. 200 general trend, support and resistance.
Cerca negli script per "Exponential"

Holt Exponential Moving AverageHolt Exponential Moving Average indicator script.
This indicator was originally developed by Charles C. Holt (International Journal of Forecasting 20(1):5-10, March 2004: Forecasting seasonals and trends by exponentially weighted moving averages).

[Pandora][Swarm] Rapid Exponential Moving AverageENVISIONING POSSIBILITY
What is the theoretical pinnacle of possibility? The current state of algorithmic affairs falls far short of my aspirations for achievable feasibility. I'm lifting the lid off of Pandora's box once again, very publicly this time, as a brute force challenge to conventional 'wisdom'. The unfolding series of time mandates a transcendental systemic alteration...
THE MOVING AVERAGE ZOO:
The realm of digital signal processing for trading is filled with familiar antiquated filtering tools. Two families of filtration, being 'infinite impulse response' (EMA, RMA, etc.) and 'finite impulse response' (WMA, SMA, etc.), are prevalently employed without question. These filter types are the mules and donkeys of data analysis, broadly accepted for use in finance.
At first glance, they appear sufficient for most tasks, offering a basic straightforward way to reduce noise and highlight trends. Yet, beneath their simplistic facade lies a constellation of limitations and impediments, each having its own finicky quirks. Upon closer inspection, identifiable drawbacks render them far from ideal for many real-world applications in today's volatile markets.
KNOWN FUNDAMENTAL FLAWS:
Despite commonplace moving average (MA) popularity, these conventional filters suffer from an assortment of fundamental flaws. Most of them don't genuinely address core challenges of how to preserve the true dynamics of a signal while suppressing noise and retaining cutoff frequency compliance. Their simple cookie cutter structures make them ill-suited in actuality for dynamic market environments. In reality, they often trade one problem for another dilemma, forsaking analytics to choose between distortion and delay.
A deeper seeded issue remains within frequency compliance, how adequately a filter respects (or disrespects) the underlying signal’s spectral properties according to it's assigned periodic parameter. Traditional MAs habitually distort phase relationships, causing delayed reactions with surplus lag or exaggerations with excessive undershoot/overshoot. For applications requiring timely resilience, such as algorithmic trading, these shortcomings are often functionally unacceptable. What’s needed is vigorous filters that can more accurately retain signal behaviors while minimizing lag without sacrificing smoothness and uniformity. Until then, the public MA zoo remains as a collection of corny compromises, rather than a favorable toolbelt of solutions.
P.S.: In PSv7+, in my opinion, many of these geriatric MAs deserve no future with ease of access for the naive, simply not knowing these filters are most likely creating bigger problems than solving any.
R.E.M.A.
What is this? I prefer to think of it as the "radical EMA", definitely along my lines of a retire everything morte algorithm. This isn't your run of the mill average from the petting zoo. I would categorize it as a paradigm shifting rampant economic masochistic annihilator, sufficiently good enough to begin ruthlessly executing moving averages left and right. Um, yeah... that kind of moving average destructor as you may soon recognize with a few 'Filters+' settings adjustments, realizing ordinary EMA has been doing us an injustice all this time.
Does it possess the capability to relentlessly exterminate most averaging filters in existence? Well, it's about time we find out, by uncaging it on the loose into the greater economic wilderness. Only then can we truly find out if it is indeed a radical exponential market accelerant whose time has come. If it is, then it may eventually become a reality erasing monolithic anomaly destined for greatness, ultimately changing the entire landscape of trading in perpetuity.
UNLEASHING NEXT-GEN:
This lone next generation exoweapon algorithm is intended to initiate the transformative beginning stages of mass filtration deprecation. However, it won't be the only one, just the first arrival of it's alien kind from me. Welcome to notion #1 of my future filtration frontier, on this episode of the algorithmic twilight zone. Where reality takes a twisting turn one dimension beyond practical logic, after persistent models of mindset disintegrate into insignificance, followed by illusory perception confronted into cognitive dissonance.
An evolutionary path to genuine advancement resides outside the prison of preconceptions, manifesting only after divergence from persistent binding restrictions of dogmatic doctrines. Such a genesis in transformative thinking will catalyze unbounded cognitive potential, plowing the way for the cultivation of total redesigns of thought. Futuristic innovative breakthroughs demand the surrender of legacy and outmoded understandings.
Now that the world's largest assembly of investors has been ensembled, there are additional tasks left to perform. I'm compelled to deploy this mathematical-weapon of mass financial creation into it's rightful destined hands, to "WE THE PEOPLE" of TV.
SCRIPT INTENTION:
Deprecate anything and everything as any non-commercial member sees desirably fit. This includes your existing code formulations already in working functional modes of operation AND/OR future projects in the works. Swapping is nearly as simple as copying and pasting with meager modifications, after you have identified comparable likeness in this indicators settings with a visual assessment. Results may become eye opening, but only if you dare to look and test.
Where you may suspect a ta.filter() is lacking sufficient luster or may be flat out majorly deficient, employing rema, drema, trema, or qrema configurations may be a more suitable replacement. That's up to you to discern. My code satire already identifies likely bottom of the barrel suspects that either belong in the extinction record or have already been marked for deprecation. They are ordered more towards the bottom by rank where they belong. SuperSmoother is a masterpiece here to stay, being my original go-to reference filter. Everything you see here is already deprecated, including REMA...
REMA CHARACTERISTICS
- VERY low lag
- No overshoot
- Frequency compliant
- Proper initialization at bar_index==0
- Period parameter accepts poitive floating point numerics (AND integers!)
- Infinite impulse response (IIR) filter
- Compact code footprint
- Minimized computational overhead

Relative Strength Exponential Moving Average [CC]The Relative Strength Exponential Moving Average was created by Vitali Apirine (Stocks and Commodities Jan 2022 pgs 22-25) and this is a handy moving average that combines a typical overbought/oversold mechanic with an overall trend indicator. Even though the typical length is so large it reacts extremely quickly when the stock becomes overbought or oversold. Because of this the indicator by itself doesn't work as well during choppy periods so Vitali recommends using a moving average crossover system during choppy so do one indicator with the default length of 50 and use a different length of 10 so when the shorter length crosses over the longer length then buy and vice versa you would sell. Generally speaking buy when the line turns green and sell when it turns red. I have used strong buy and sell signals in addition to normal signals so strong signals are darker in color and normal signals are lighter in color.
Let me know if there are any other scripts or indicators you would like me to publish!

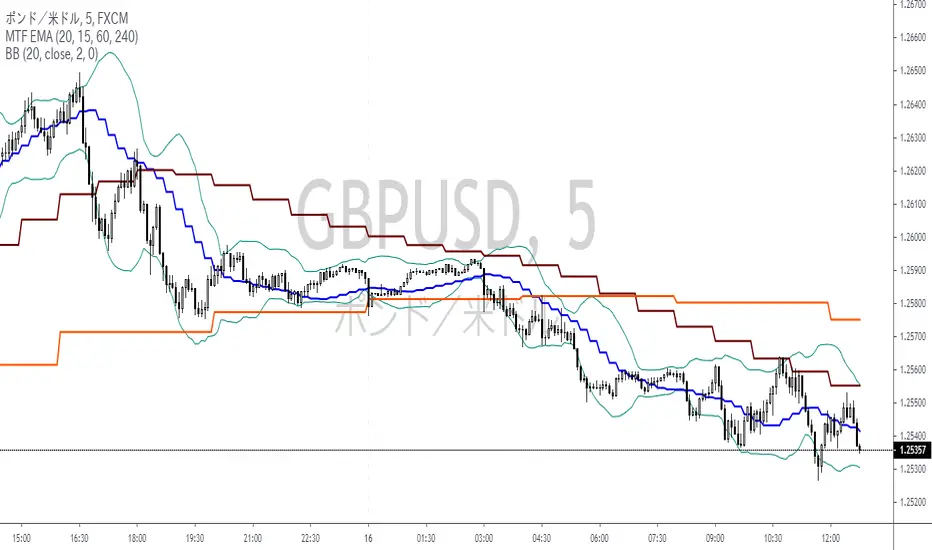
MTF EMA 3Set(Multi Time Frame Exponential Moving Averages 3 Set)Multi Time Frame Exponential Moving Averages 3 Set
One indicator displays the three types of moving averages of the top bar.
It can be used for environment recognition.
It is easy to repel when the 4 hour foot and the pivot overlap.
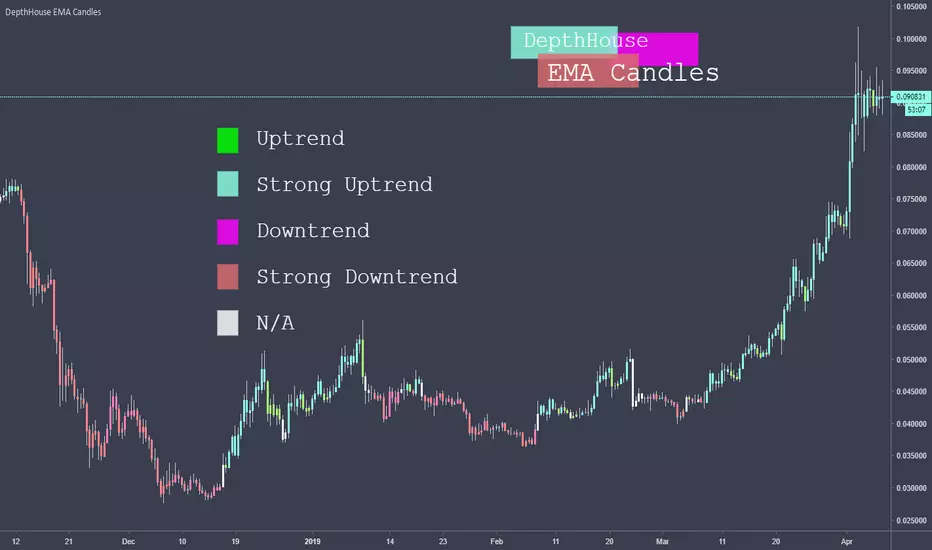
DepthHouse Exponential CandlesThis EMA Candles indicator use the price movement between two user selected Exponential Moving Averages to help determine the current trend.
As of release, there are 5 possible bar color outputs, all of which are shown in the legend above.
The Five Electable Color Outputs:
Uptrend; Strong Uptrend; Downtrend; Strong Downtrend; n/a
I hope you all enjoy!
Please leave your suggestions in the comments below!

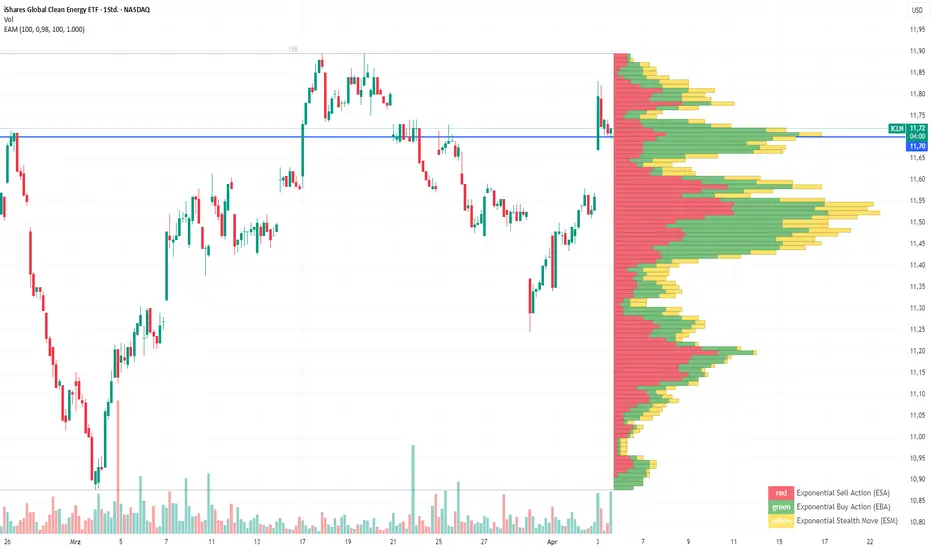
Exponential Action Map (EAM)### **Exponential Action Map (EAM) – Description and Differences from VPVR**
The Exponential Action Map (EAM) indicator is a Pine Script-based volume profile indicator that offers **a weighted representation of buying and selling activity**. Unlike the standard **Volume Profile Visible Range (VPVR)**, which simply shows traded volume at various price levels, the EAM provides the following additional features:
1. **Exponential Weighting**:
- Instead of treating the volume of all considered bars equally, the EAM uses a **decay factor** to gradually diminish the significance of older data. This allows **more recent price movements to have greater influence**, making it particularly useful for short-term analysis.
2. **Exponential Stealth Move (ESM)**:
- In addition to buy and sell volume, the EAM calculates and displays the **Exponential Stealth Move (ESM)**.
- This measures the relative price movement compared to volume and highlights areas where **significant price changes occur with low volume**, which may indicate institutional activity or strong momentum.
- The ESM visualization is not present in VPVR, making it a distinct and valuable feature.
3. **Visualization Methodology**:
- Instead of simple histograms like in VPVR, volume is represented by **dynamic boxes** that encompass Buy (EBA), Sell (ESA), and Stealth Move (ESM) activities.
- The size and color of these boxes are **customizable**, allowing for clear differentiation between various volume types.
4. **Flexibility & Configuration**:
- Users can adjust parameters such as **Number of Bars, Decay Factor, Bar Width, and Maximum History Data**.
- The ability to **toggle historical data visibility** offers a **tailored view** that VPVR does not provide.
**Conclusion:** The EAM extends the classic volume profile (VPVR) by introducing **time-weighted volume analysis and detection of Stealth Moves (ESM)**. This not only highlights price levels with high trading volume but also reveals **price movements with low liquidity**, which can potentially indicate institutional interest.
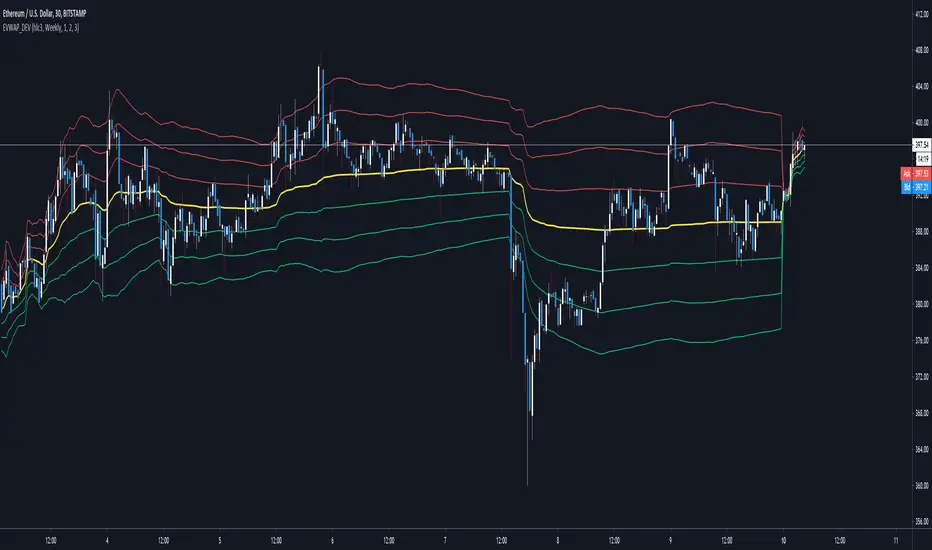
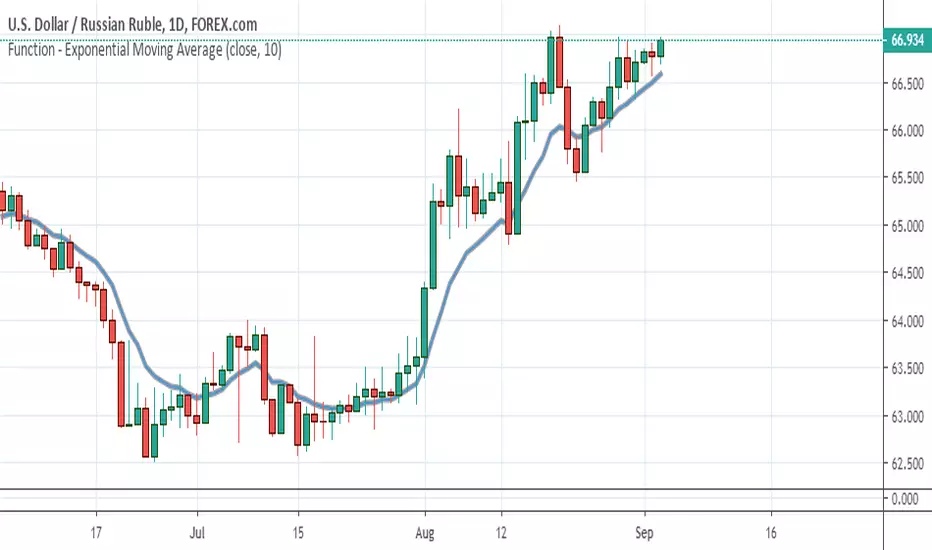
Exponential VWAP & DeviationsExponential Volume Weighted Average Price and Deviations.
Selectable intervals (daily/weekly/monthly/yearly vwap). Options to change deviation multipliers and display interval closing values for the previous interval.
Uses volume weighted EMA for the interval as the basis/vwap & exponential deviations calculated using the exponential vwap as the mean.
Exponential moving averages Convergence to identify Strength of Exponential moving averages Convergence to identify Strength of the stock.
Description:
This script is developed to find Convergences for many indicators. It analyses Convergences of 20days, 50days, 100days, 150days and 200days exponential moving averages. When all the plotted lines are converged and Price of stock is above the Convergence the stock is bullish, similarly if the price of the stock is below the convergence stock is bearish.
This indicator gives you VWAP and EMA’s for convergence along with Bollinger Bands.
VWAP and Bollinger bands and EMA’s can be altered as you required.
In settings menu we can enable and disable VWAP, EMA’S & Bollinger bands and in style menu even we can choose required EMA
It helps for convergence.

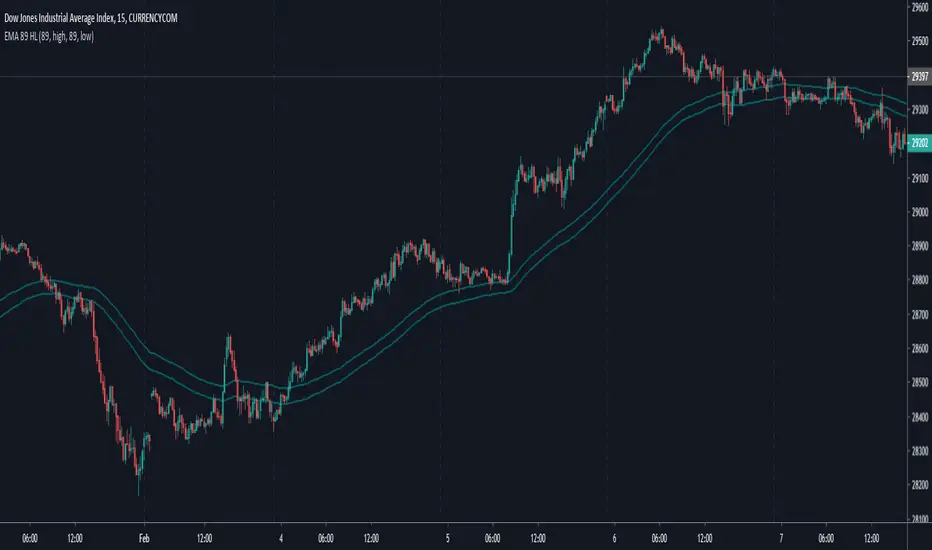
Exponential Moving Average 89Exponential Moving Average 89
Plots Exponential Moving Average 89 High Low
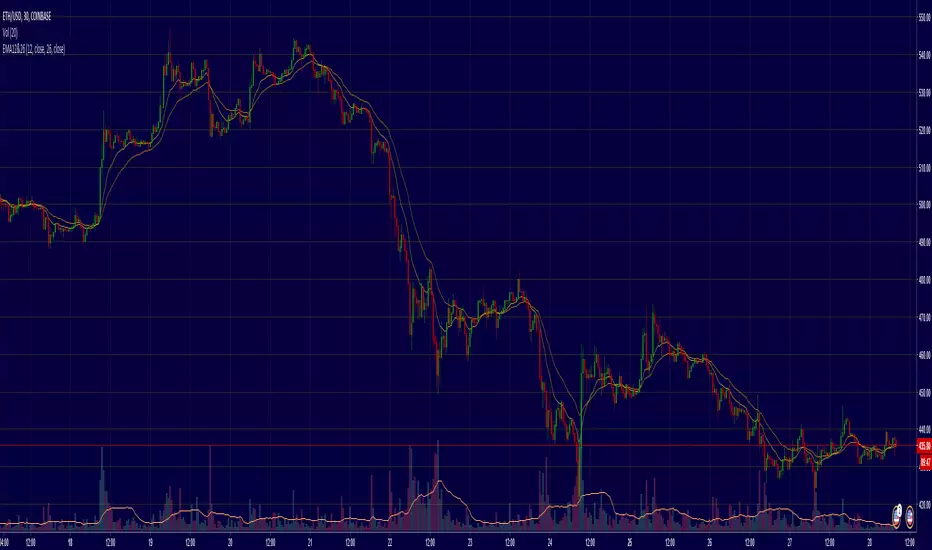
Exponential Moving Averages 12 & 26Exponential Moving Average Indicator for trading 12EMA and 26EMA crossovers.
The 12 and 26 period exponential moving averages (EMAs) are often the most popularly quoted or analyzed short-term averages.
2/20 Exponential Moving Average Backtest Strategy
This indicator plots 2/20 exponential moving average. For the Mov
Avg X 2/20 Indicator, the EMA bar will be painted when the Alert criteria is met.
You can use in the xPrice any series: Open, High, Low, Close, HL2, HLC3, OHLC4 and ect...
You can change long to short in the Input Settings
Please, use it only for learning or paper trading. Do not for real trading.

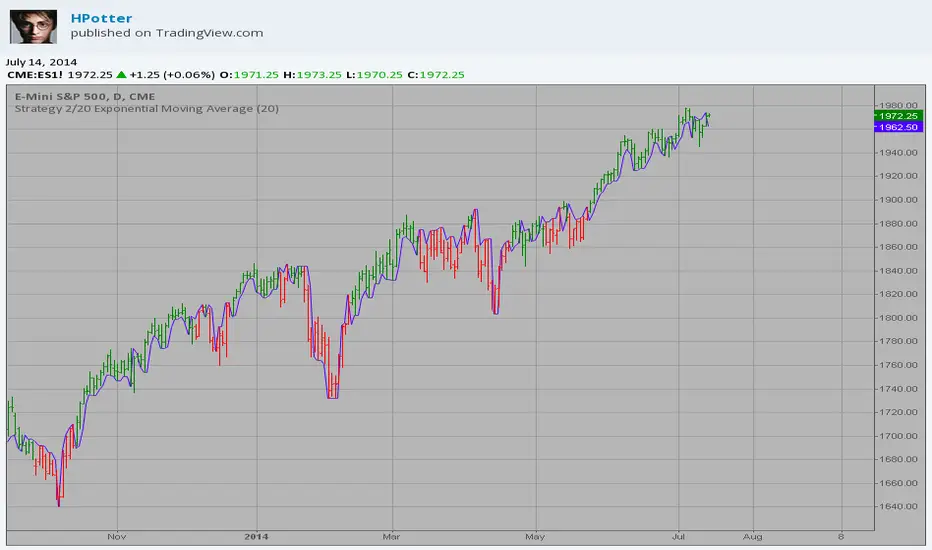
Strategy 2/20 Exponential Moving Average Strategy.
This indicator plots 2/20 exponential moving average. For the Mov
Avg X 2/20 Indicator, the EMA bar will be painted when the Alert criteria is met.
You can use in the xPrice any series: Open, High, Low, Close, HL2, HLC3, OHLC4 and ect...
Exponential Moving Averages 9 & 40 NKExponential Moving Averages 9 & 40 NK, used in Currency Markets

Exponential Bollinger Band StrategyExponential Bollinger Band strategy
Just Bollinger Bands crossover that is modified with EMA to generate more profit than previously possible. 10-15% performance gain over regular BBands.

Session Highlighter with Kill Zones [Exponential-X]Session Highlighter with Kill Zones
Overview
This indicator provides comprehensive visualization of major forex trading sessions (Asian, London, and New York) with integrated kill zone detection and real-time session analytics. It helps traders identify optimal trading times by highlighting high-volatility periods and tracking session-specific price ranges.
What Makes This Original
While session indicators are common, this script uniquely combines several features that work together:
Kill Zone Integration: Highlights specific high-volatility windows within sessions (London: 02:00-05:00 EST, NY: 08:30-11:00 EST) when institutional activity typically peaks
Session Overlap Detection: Automatically detects and highlights when major sessions overlap (London-NY, Asian-London) with distinct visual cues
Real-Time Range Tracking: Calculates and displays percentage-based session ranges as they develop, not just historical data
Dynamic Statistics Dashboard: Live table showing current active session, session times, and comparative range percentages
Customizable Visual System: Flexible styling options including background shading, box overlays, and configurable line styles for session boundaries
How It Works
Session Detection Logic
The script uses timezone-normalized session detection based on EST/EDT times. It converts the current bar's timestamp to New York time and determines which session(s) are active using minute-based calculations. This approach ensures accurate session detection regardless of your chart's timezone settings.
Kill Zones
Kill zones represent periods within sessions when institutional traders are most active. The London kill zone (02:00-05:00 EST) captures pre-London open volatility, while the NY kill zone (08:30-11:00 EST) aligns with US economic data releases and market open activity.
Range Calculations
Session highs, lows, and opens are tracked from the first bar of each session and updated in real-time. Range percentages are calculated as: ((High - Low) / Low) × 100 , providing a volatility measure that's comparable across different instruments and price levels.
Visual System
Background shading: Color-coded zones for each session
Session boxes: Outline entire session ranges
H/L lines: Dynamic lines showing current session extremes
Open lines: Reference levels from session start
Overlap highlighting: Distinct colors when multiple sessions are active simultaneously
How to Use
Intraday Trading: Use kill zones to time entries during high-liquidity periods
Session Breakouts: Monitor for price breaks above/below session highs/lows
Range Trading: Trade between session boundaries during consolidation
Session Continuity: Observe how price behaves as sessions transition
Volatility Assessment: Compare current session ranges to typical values
Recommended Timeframes: Works on any timeframe, but most useful on 1m to 1H charts for intraday trading.
Settings Explained
Sessions Group
Toggle each major session on/off independently
Customize colors for visual clarity
Enable/disable overlap highlighting
Levels Group
Show/hide session high/low lines
Show/hide session open levels
Choose line styles (Solid/Dashed/Dotted)
Kill Zones Group
Toggle kill zone highlighting
Select which kill zones to display
Customize kill zone color intensity
Display Group
Show/hide statistics table
Show/hide session labels on chart
Important Notes
All times are displayed in EST/EDT
Session ranges reset at the start of each new session
Kill zones are session sub-periods, not separate sessions
Overlap colors override individual session colors when multiple sessions are active
The statistics table updates in real-time and shows percentage-based ranges for cross-instrument comparison
Session Times Reference
Asian Session: 19:00 - 04:00 EST (Tokyo open through early Sydney close)
London Session: 03:00 - 12:00 EST (Full European trading hours)
New York Session: 08:00 - 17:00 EST (US market hours)
London Kill Zone: 02:00 - 05:00 EST (Pre-London volatility spike)
NY Kill Zone: 08:30 - 11:00 EST (US open and news releases)
Alerts Available
The script includes six pre-configured alert conditions:
London Kill Zone start
NY Kill Zone start
London-NY Overlap start
Asian Session open
London Session open
NY Session open
Create alerts through TradingView's alert system to get notified when specific sessions or kill zones begin.
Disclaimer: This indicator is for informational purposes only. Session times and kill zones are based on typical market patterns but do not guarantee specific trading outcomes. Always use proper risk management.

ICT Premium/Discount Zones [Exponential-X]Premium/Discount Zones - Visual Market Structure Tool
Overview
This indicator helps traders visualize premium and discount price zones based on recent market structure. It automatically identifies swing highs and lows within a specified lookback period and divides the price range into three key areas: Premium Zone, Equilibrium, and Discount Zone.
What This Indicator Does
The script continuously monitors price action and calculates:
Highest High and Lowest Low within the lookback period
Equilibrium Level - the midpoint between the swing high and low
Premium Zone - the area from equilibrium to the swing high (typically viewed as relatively expensive price levels)
Discount Zone - the area from the swing low to equilibrium (typically viewed as relatively cheap price levels)
Core Calculation Method
The indicator uses pivot point logic to identify significant swing highs and lows based on the pivot strength parameter. It then calculates the highest high and lowest low over the specified lookback period. The equilibrium is computed as the arithmetic mean of these two extremes, creating a fair value reference point.
The zones are dynamically updated as new price data becomes available, ensuring the visualization remains relevant to current market conditions.
Key Features
Dynamic Zone Detection
Automatically adjusts zones based on recent price action
Uses customizable lookback period for flexibility across different timeframes
Employs pivot strength parameter to filter out minor price fluctuations
Visual Clarity
Color-coded zones for easy identification (red for premium, green for discount)
Optional equilibrium line display
Adjustable zone label placement
Customizable color schemes to match your charting preferences
Alert Capabilities
Alerts when price enters the premium zone
Alerts when price enters the discount zone
Alerts when price returns to equilibrium
Helps traders monitor key zone interactions without constant chart watching
Customization Options
Adjustable lookback period (5-500 bars)
Configurable pivot strength for swing detection (1-20 bars)
Control over box extension into the future
Toggle labels and equilibrium line on/off
Full color customization for all visual elements
How to Use This Indicator
Setup
Add the indicator to your chart
Adjust the lookback period to match your trading timeframe (shorter for intraday, longer for swing trading)
Set pivot strength to filter out noise (higher values for major swings, lower for more frequent updates)
Customize colors and labels to your preference
Interpretation
Premium Zone: Price trading here may indicate potential resistance or selling opportunities when aligned with other technical factors
Discount Zone: Price trading here may indicate potential support or buying opportunities when aligned with other technical factors
Equilibrium: Acts as a fair value reference point where price often consolidates or reacts
Trading Applications
This tool works well when combined with other forms of analysis such as:
Trend identification indicators
Volume analysis
Support and resistance levels
Price action patterns
Market structure analysis
Important Considerations
This indicator identifies zones based purely on historical price data
Premium and discount zones are relative to the recent lookback period
The effectiveness varies across different market conditions and timeframes
Should be used as part of a comprehensive trading strategy, not in isolation
Past price structure does not guarantee future price behavior
Technical Details
Calculation Method
Uses Pine Script's ta.pivothigh() and ta.pivotlow() functions for swing detection
Employs ta.highest() and ta.lowest() for range calculation
Updates dynamically with each new bar
Draws zones using box objects for clear visual representation
Performance Optimization
Efficiently manages box and line objects to minimize resource usage
Uses conditional plotting to reduce unnecessary calculations
Limited to essential visual elements for chart clarity
Timeframe Compatibility
This indicator works on all timeframes but the recommended settings vary:
1-5 minute charts: Lookback period 10-20, Pivot strength 3-5
15-60 minute charts: Lookback period 20-50, Pivot strength 5-10
Daily charts: Lookback period 50-100, Pivot strength 10-15
Weekly charts: Lookback period 20-50, Pivot strength 5-10
Adjust these values based on the volatility of your specific instrument.
Limitations and Considerations
What This Indicator Does NOT Do
Does not provide buy or sell signals on its own
Does not predict future price movements
Does not account for fundamental factors or market events
Does not guarantee profitability or accuracy
Market Condition Awareness
In strong trending markets, price may remain in premium or discount zones for extended periods
During ranging conditions, price typically oscillates between zones more predictably
High volatility can cause frequent zone recalculations
Low volatility may result in narrow zones with limited practical use
Risk Considerations
Premium and discount are relative concepts, not absolute values
What appears as a discount zone may continue lower in a downtrend
What appears as a premium zone may continue higher in an uptrend
Always use proper risk management and position sizing
Consider multiple timeframe analysis for context
Version Information
This indicator is written in Pine Script v6, ensuring compatibility with the latest TradingView features and optimal performance.
Final Notes
This tool is designed to enhance your market analysis by providing a clear visual representation of premium and discount price zones. It should be used as one component of a well-rounded trading approach that includes proper risk management, multiple forms of analysis, and realistic expectations about market behavior.
The concept of premium and discount zones is rooted in auction market theory and the idea that price oscillates around fair value. However, traders should understand that these zones are interpretive tools based on historical data and do not constitute trading advice or predictions about future price action.
Remember to backtest any strategy using this indicator on historical data before applying it to live trading, and always trade responsibly within your risk tolerance.
Disclaimer: The information provided by this indicator is for educational and informational purposes only. It does not constitute financial advice, investment advice, trading advice, or any other sort of advice. Always conduct your own research and consult with qualified financial professionals before making trading decisions.

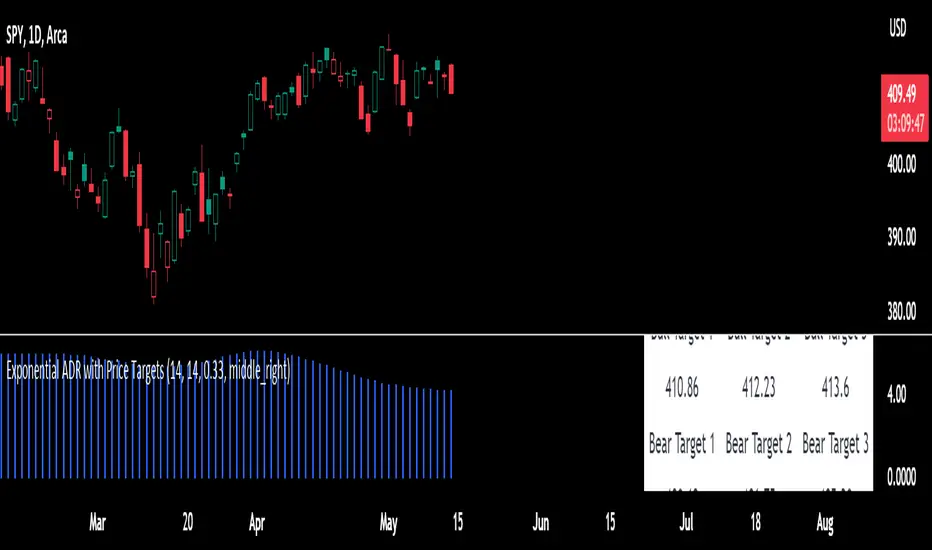
Exponential ADR with Price TargetsThis script is designed to help you analyze price movements in the financial markets by calculating the Average Daily Range (ADR), adjusting it based on exponentiality and generating price targets based on that range.
The ADR represents the average range between the highest and lowest prices of a trading instrument during a specific period. It gives you an idea of how much the price typically moves in a day. In this script, we calculate the ADR using Simple Moving Averages (SMA) of the high and low prices over a certain length of time. You can customize this length according to your preference.
To make the ADR smoother and more responsive to recent price changes, we apply an Exponential Moving Average (EMA) to the ADR values. The EMA places more weight on recent data, giving you a more up-to-date measure of the ADR. The length of the EMA is also adjustable.
Once we have the Exponential ADR, we can generate price targets based on it. Price targets are potential levels where the price may reach in the future. We calculate these targets by adding or subtracting a certain multiple of the Exponential ADR from the current closing price. The multiple is determined by a parameter called the "Target Multiplier." You can adjust this value to control the distance of the price targets from the closing price.
In addition to plotting the Exponential ADR as a histogram on the chart, we create a table that displays the price targets. The table shows three bullish (positive) targets and three bearish (negative) targets. The targets are labeled as "Bull Target" or "Bear Target" followed by a number indicating the target's order. For each target, we display the corresponding price level.
To estimate the potential price levels, we used a formula that takes into account the current closing price and a value called the Exponential Average Daily Range (Exponential ADR). The Exponential ADR represents the average range of price movement over a specific period.
To calculate the price targets, we multiplied the Exponential ADR by a user-defined value called the target multiplier. This target multiplier allows traders to control the distance of the price targets from the current price. The resulting value indicates the desired distance from the current price for each target level.
For bullish targets, we added the calculated value to the current closing price. This suggests potential upward movement in the price. On the other hand, for bearish targets, we subtracted the calculated value from the current closing price. This indicates potential downward movement in the price.
By providing multiple target levels, such as level 1, level 2, and level 3, traders can assess different scenarios and potential price outcomes. These target levels help traders identify possible price levels where they might consider taking profit or adjusting their trading positions.
It's important to note that these price targets are not guaranteed to be reached, but they serve as reference points based on historical price behavior and the Exponential ADR. Traders can use them as part of their overall trading strategy and decision-making process.
Adjust the input parameters according to your desired settings, such as the ADR length, EMA length, target multiplier, table position, and table style. The indicator will then calculate and display the Exponential ADR and price targets on the chart, helping you identify potential levels of support and resistance for your trading decisions.
Exponential Trend [AlgoAlpha]OVERVIEW
This script plots an adaptive exponential trend system that initiates from a dynamic anchor and accelerates based on time and direction. Unlike standard moving averages or trailing stops, the trend line here doesn't follow price directly—it expands exponentially from a pivot determined by a modified Supertrend logic. The result is a non-linear trend curve that starts at a specific price level and accelerates outward, allowing traders to visually assess trend strength, persistence, and early-stage reversal points through both base and volatility-adjusted extensions.
CONCEPTS
This indicator builds on the idea that trend-following tools often need dynamic, non-static expansion to reflect real market behavior. It uses a simplified Supertrend mechanism to define directional context and anchor levels, then applies an exponential growth function to simulate trend acceleration over time. The exponential growth is unidirectional and resets only when the direction flips, preserving trend memory. This method helps avoid whipsaws and adds time-weighted confirmation to trends. A volatility buffer—derived from ATR and modifiable by a width multiplier—adds a second layer to indicate zones of risk around the main trend path.
FEATURES
Exponential Trend Logic : Once a directional anchor is set, the base trend line accelerates using an exponential formula tied to elapsed bars, making the trend stronger the longer it persists.
Volatility-Adjusted Extension : A secondary band is plotted above or below the base trend line, widened by ATR to visualize volatility zones, act as soft stop regions or as a better entry point (Dynamic Support/Resistance).
Color-Coded Visualization : Clear green/red base and extension lines with shaded fills indicate trend direction and confidence levels.
Signal Markers & Alerts : Triangle markers indicate confirmed trend reversals. Built-in alerts notify users of bullish or bearish direction changes in real-time.
USAGE
Use this script to identify strong trends early, visually measure their momentum over time, and determine safe areas for entries or exits. Start by adjusting the *Exponential Rate* to control how quickly the trend expands—the higher the rate, the more aggressive the curve. The *Initial Distance* sets how far the anchor band is placed from price initially, helping filter out noise. Increase the *Width Multiplier* to widen the volatility zone for more conservative entries or exits. When the price crosses above or below the base line, a new trend is assumed and the exponential projection restarts from the new anchor. The base trend and its extension both shift over time, but only reset on a confirmed reversal. This makes the tool especially useful for momentum continuation setups or trailing stop logic in trending markets.

Exponential Regression Log ResidualThis custom indicator measures the logarithmic residual between the current price and an exponential regression line, offering insights into relative overbought and oversold conditions on a logarithmic scale. It can be especially useful when analyzing assets that move exponentially over time, such as growth stocks or cryptocurrencies.

Exponential Moving Average (Set of 3) [Krypt] + 13/34 EMAsI took Krypt's script and essentially added on to it.
the 20/50/100/200 EMAs should be used together as support and resistance as normal.
Wait for price to break 200 EMA
Wait for 50 EMA to cross 200 EMA
Wait for pullback to 50 EMA to open position
20 and 100 EMAs are for extra information about moving support and resistance
and 13/34 EMAs should be used in conjunction
When 13 EMA crosses 34 EMA, open position
When price gets far from 13/34, close position (because price will attempt to revert back to mean)
This is better for scalping and swing trades than the 20/50/100/200 setup.
Twitter: @AzorAhai06
