Bitcoin Logarithmic Fractal Growth Model By ARUDDThis model, which I'm calling the Logarithmic Fractal Growth Mode (L.F.G) , uses Bitcoin's mathematical monetary policy to evaluate the future possible price valuation.
It takes into account fractal (and logarithmic) growth as well as how those who hold bitcoins might react to certain events such as changes in supply and demand. It also shows that it is mathematically logical that someday it must become stable.
The information gained from knowing this helps people make more informed decisions when buying bitcoin and thinking of its future possibilities.
The model can serve as some type of general guideline for determining how much bitcoins should be worth in the future if it follows a certain path from its current price.
Modeling Bitcoin's money supply mathematically, and knowing that there is a finite number of them, makes this whole process much more rational than just thinking about the possibilities in pure subjective terms.
Before going any further I want to say that no one can know with absolute certainty what will happen to bitcoins price in the future, but using mathematics gives us an idea of where things are headed.
The results presented here are based on very reasonable assumptions for how bitcoin might continue to grow (and then level out) once there are over 21 million bitcoins in existence.
The model shows that bitcoin's price can never go down to zero (thus creating the "death spiral" phenomenon), and as such, bitcoin has an extremely high probability of becoming stable as it approaches infinity.
Conversely, this model also shows that at some point there is a high probability that bitcoin will not continue to grow exponentially forever.
Credit goes to Quantadelic for the awesome original script.
ARUDD
Cerca negli script per "Exponential"

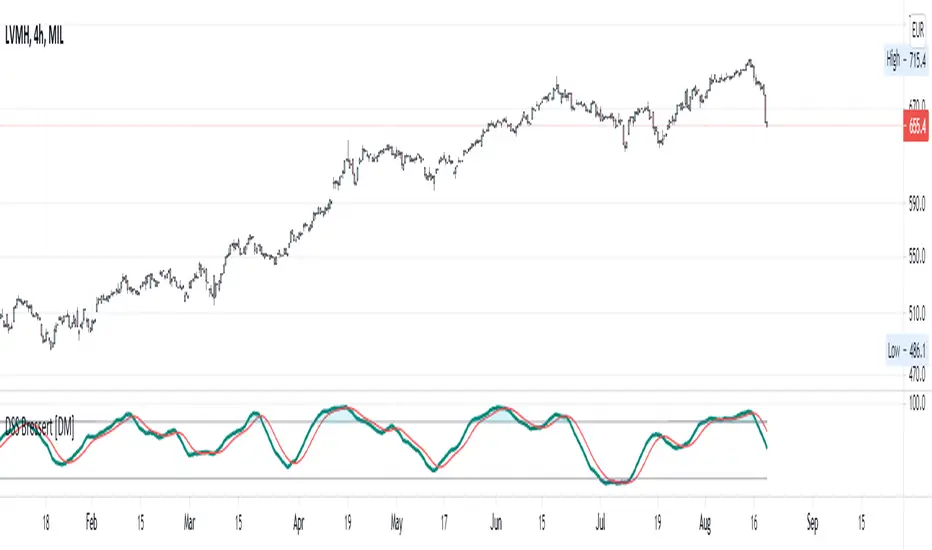
"DSS" Bessert Double Smooth Stochastic Alma Variant Hi colleagues I share this time DSS bressert.
As usual they have all the adjustable colors and signals. I hope you enjoy them and leave here below the length of signals that best suit your needs so that we can continue sharing content
Description
One after the other, William Blau and Walter Bressert each presented a version of the Double Smoothed Stochastics. Two exponentially smoothed MAs are used to even out the input values (H, L and C), in a similar way to the well-known stochastic formula.
Parameters
The adjustable period length can be chosen from 2 to 500. The most common settings will have a period length ranging from 5 to 30. In addition, the indicator can be smoothed in the interval from 1 to 50. Meaningful smoothing values lie in the short-term range.
Interpretation
The application of the DSS is comparable with that of the stochastic method. Accordingly, values above 70 or 80 must be regarded as overbought and values below 20 or 30 as oversold. A rise of the DSS above its center line should be viewed as bullish, and a fall of the DSS below its center line as bearish.
/// Quick Explained ALMA ///
//Window size: The window size is the look-back period and it is a basic setting of ALMA.
//Experienced traders can change this setting according to their preference.
//But if you are using this indicator for the first time, it is recommended to go with the default setting.
//Offset: The offset value is used to tweak the ALMA so that it will be more inclined
//towards responsiveness or smoothness. You can set the offset in decimals between the 0 to1.
//The value of 0.01 makes it smoother, while a setting of 0.99 makes the indicator more responsive.
//Sigma: The sigma is used for the filter. Any value less than 6 makes the indicator
//more focused, whereas the setting of 6 makes the filter large. According to Mr Arnaud,
//a sigma value of 6 is offer good performance.
/// Explain DSS ///
//Parameters
//The adjustable period length can be chosen from 2 to 500.
//The most common settings will have a period length ranging from 5 to 30.
//In addition, the indicator can be smoothed in the interval from 1 to 50.
//Meaningful smoothing values lie in the short-term range.
//Interpretation
//The application of the DSS is comparable with that of the stochastic method.
//Accordingly, values above 70 or 80 must be regarded as overbought and values below 20 or 30 as oversold.
//A rise of the DSS above its center line should be viewed as bullish,
//and a fall of the DSS below its center line as bearish
/// End Of The Code///
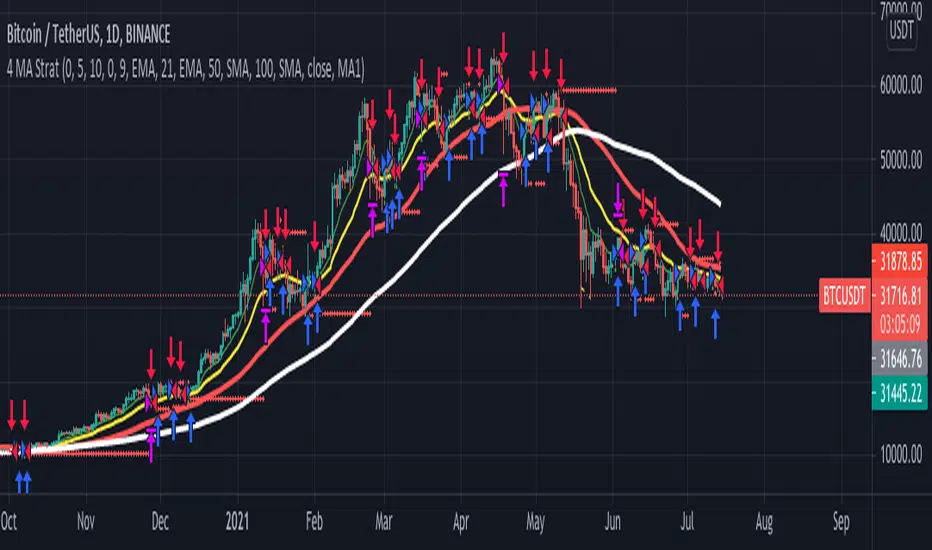
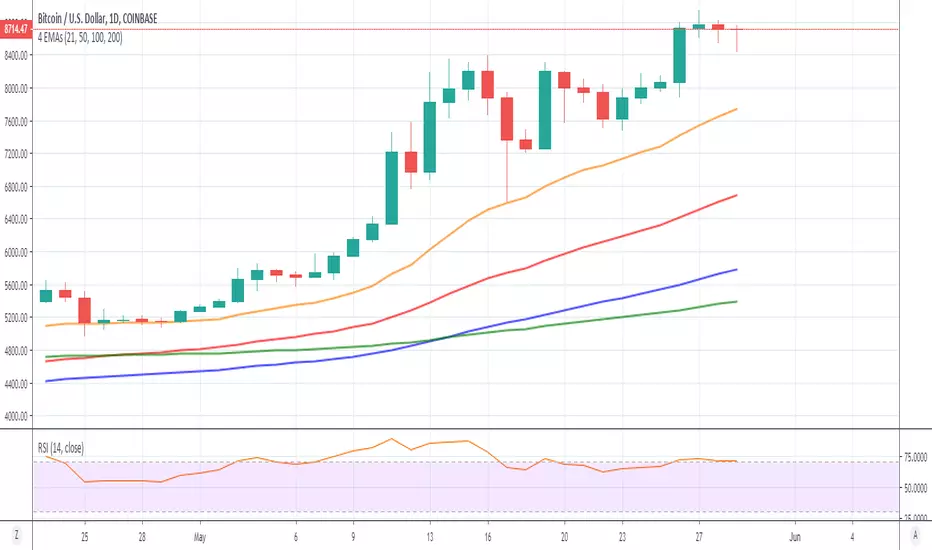
4 MA Strategy + Position Management// This is a simple crossover Moving Average strategy, good for long term crypto trades.
// It buys when the MA "X" crosses up the MA "Y", viceversa for shorts.
// Both MAs are selectable from the Inputs section in the front panel.
// There is also a Position Management option thats
// sizes positions to have the same USD risk (using leverage) on each trade,
// based on the percentage distance to the stop loss level.
// If you turn this option on you will see how the profit
// grows exponentially while the drawdown percentage almost remains the same.
Volume, Momentum and Volatility weighted moving averageMoving averages are filters on price data. This moving average creates a filter which factors in:
- the price RSI or it's Momentum
- the volume RSI
- the RVI or Volatility
Each factor is put through a least squares filter to smooth them first.
Then the factors are used to build a coefficient for an exponentially weighted average.
The chart above shows a comparison of standard average types with this script.
This is useful if you are looking for a moving average based trigger and do not wish to react to candle noise price action.

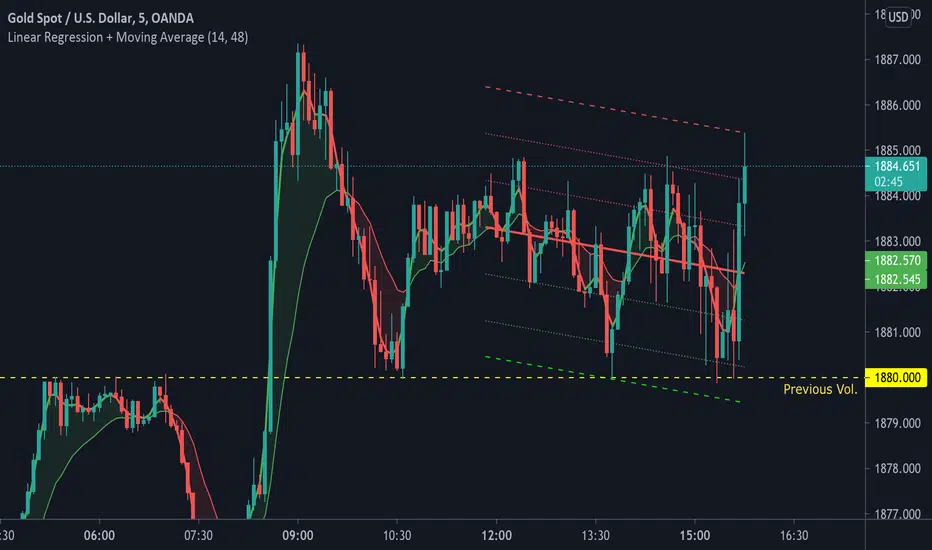
Linear Regression + Moving Average1. Linear Regression including 2 x Standard Deviation + High / Low. Middle line colour depends on colour change of Symmetrically Weighted Moving Average . Green zones indicate good long positions. Red zones indicate good short positions. (Custom)
2. Symmetrically Weighted Moving Average. Colour change depending on cross of offset -1. (Fixed)
3. Exponentially Weighted Moving Average. Colour change depending on cross with Symmetrically Weighted Moving Average. (Custom)
Log MACDThis is just a MACD indicator using the log of the closing price rather than the normal closing price. Useful for exponentially growing stocks and cryptocurrency.

Volume Weighted Directional BiasThis indicator uses a series of five volume weighted moving averages cast out in successive powers of three to calculate a value which expresses the direction and momentum of a trend. It can be used as a contrary indicator to identify waning momentum at the top or bottom of a rally or selloff. It can be used to identify trendline divergence. It can also be used for trend confirmation.
The length of the moving averages can be changed in the indicator inputs, but each should be longer than the previous.
The problem with most trend indicators is that they are either too lagging or too noisy. This indicator seeks to combine smoothed data and a long lookback period with an exponentially forward weighted calculation, making it still very responsive to market changes without too much signal noise.

Grid ToolThe core idea of this grid tool is that you have to concentrate less on the trade entries (this happens automatically time-independent but price-dependant) but rather on the validity of the macro trend. Exiting a trend when it is no longer valid is more important than entering a trade. But as long as the trend is valid, the trader participates exponentially in the overall trend.
It is advisable to start with a basic position and then "set up" the grid on this in a ratio of 1/10.
A major advantage of grid trading is that the average entry price in a trend moves further and further away from the current market price while the position continues to grow.
A small timeframe should be used so that the distance between the trades corresponds as closely as possible to the selected grid gap and since TV backtests are carried out with closed bars.
Before starting a grid, pre-analysis the market to make sure it is trending. Select the grid gap and grid position size that you are comfortable with. Monitor the trend and from time to time take some profit :).
PS: The ADX filter looks interesting.

[SCL] Bitcoin Hashrate Dips (Miner Capitulation)Gives long-term buy signals for Bitcoin from dips and recoveries in the hashrate (the "miner capitulation" theory). It has an overlay and a standalone mode and is fully configurable. It uses Williams Lows and ATR instead of moving averages.
Features that might be interesting for Pinescripters:
+ Automatic (as far as is possible currently) adjustment of plots for overlay and standalone display modes.
+ A neat label function for debugging floats
+ Fully commented
+ The debug that I used to overcome problems in developing it is left in
+ Ideas for how to deal with a wildly oscillating and exponentially increasing data source
You need to run this indicator on the Bitcoin daily chart for it to make any sense. The best is a BTC/USD chart with a long history, such as BNC:BLX.

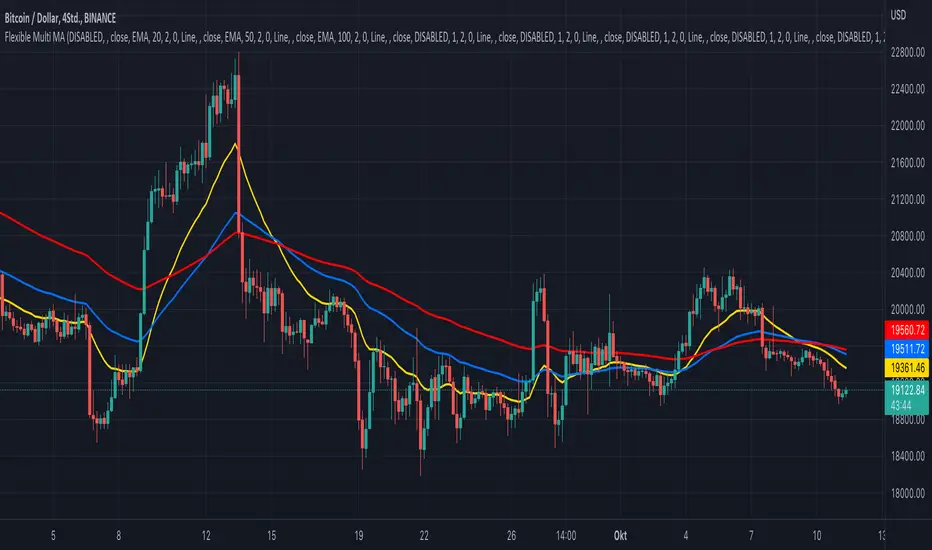
KINSKI Flexible Multi MA (EMA, SMA, RMA, WMA, VWMA, KAMA, HMA)This Multi Moving Average (MA) indicator is more flexible than any other indicator of this type offered so far. You can define up to 10 different Moving Average (MA) lines based on different calculation variants.
The following MA types can be configured.
- EMA: Exponentially Moving Average
- SMA: Small Moving Average
- RMA: Rolling Moving Average
- WMA: Weighted Moving Average
- VWMA: Volume Weighted Moving Average
- KAMA: Kaufman's Adaptive Moving Average
- HMA: Hull Moving Average
Which settings can be made?
- Selection for calculation formula ("Calculation Source"). The default value is "close".
- for each MA line the "Length" and the "Type" can be defined
- furthermore you can make layout adjustments via the "Style" menu
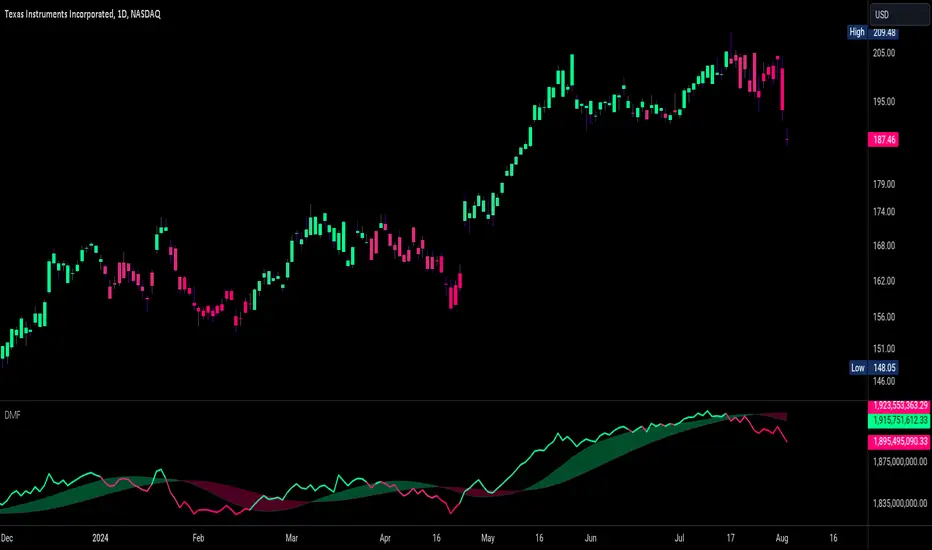
Dynamic Money FlowDynamic Money Flow is a volume indicator based on Marc Chaikin's Money Flow with a few improvements.
It can be used to confirm break-outs and trends.
Zero line crosses and divergences can provide useful signals while considering chart analysis as well.
Two weaknesses of CMF have been already fixed by Colin Twiggs (IncredibleCharts)...
1.CMF uses Chaikin's accumulation/distribution line to calculate the flow of money.
Accumulation/distribution line does not take the gaps into account. This can be solved using true range.
I call it true accumulation/distribution.
2.Oscillators have a tendency to center because of averaging calculations.
DMF is average of flowing volume divided by average of total volume. This means indicator plots the change of first factor compared to the other one. In Simple Averaging method every data is given an equal weight thus when the last data drops it will have heavy impact on the averages and the change of them.
It is much easier to identity these impacts after the drop of very high or very low data... So reducing the weight exponentially is a better option.
3.There is something else with CMF... changes of close price is ignored, because the formula only compares close price to its range.
To include the movements of close beside the close to range comparison, the distance between two last close prices should be compared to true range as well.
So volume can be distributed between close to range comparison (True Accumulation/Distribution) and close to close comparison automatically. And then results are summed to have a single multiplier.
An example for how close to close comparison affects DMF...
Or here you can see how lower wicks keep TMF (same as CMF in this case) from crossing zero line while price is trending down.
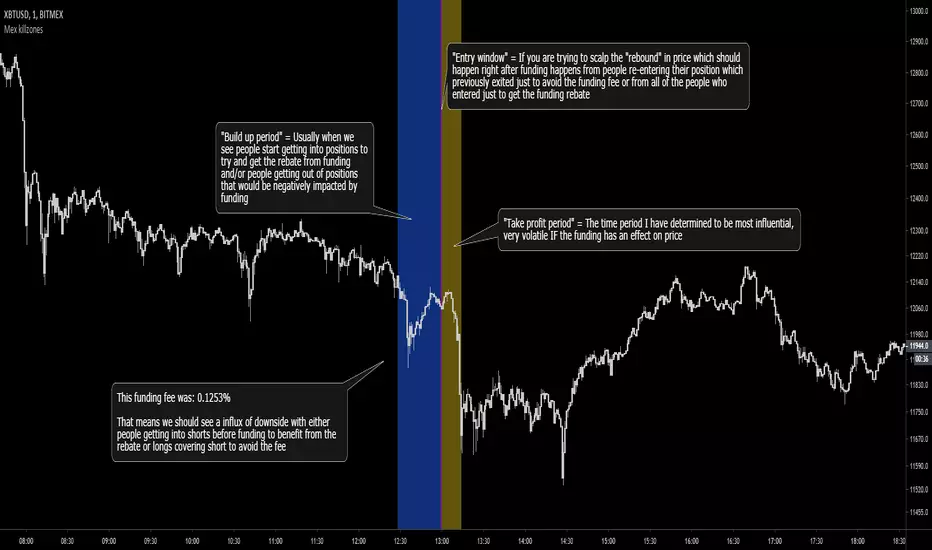
Bitmex Funding Killzones v3 [MaliciousUpload]Originally built off of "Oscarvs: BITCOIN KILL ZONES v2" indicator, updated to now highlight a different time period based event.
1. The indicator should not be affected by what time zone you are in, it will show true Funding periods by default.
2. This needs to be used on the 1min time frame to be used to its full extent
3. The more the funding fee is the more likely you are to have price get manipulated by people looking to act on its benefit
4. This indicator will work only for XBTUSD and ETHUSD perpetual contract symbols as they are the only two ones with funding...
My opinion: Funding is literally the exchanges insurance policy, they are "the house", they will always win.
With that in mind you can trade "with the house" in this regard, getting onto the side that will benefit from exponentially large funding rebates.
Do you ever ask how those "whales" got to be rich? It was by saving every penny they could while trading.
Funding gives people the option to jump out right before, avoiding the fee and then immediately enter in after at no loss (assuming limit orders ofc).
If that doesn't make sense to you i cant help, sorry. :pray: :pray: :pray:
"Build up period" = Usually when we see people start getting into positions to try and get the rebate from funding and/or people getting out of positions that would be negatively impacted by funding
"Entry window" = If you are trying to scalp the "rebound" in price which should happen right after funding happens from people re-entering their position which previously exited just to avoid the funding fee or from all of the people who entered just to get the funding rebate
"Take profit period" = The time period I have determined to be most influential, very volatile IF the funding has an effect on price
Hit me up on Discord if you are an **experienced** trader that takes trading seriously.
MaliciousUpload#1637
VWMA RibbonVolume Weighted Moving Average of HLC3's, spread over a wide range of periods to get an overall feel of any market.
The 15 periods used are exponentially increasing to provide somewhat even spacings in moving markets, which can be useful for progressive stop-buys (dollar cost averaging in) or progressive stop-losses (dollar cost averaging out):
4
7
12
20
33
54
87
140
226
365
590
955
1545
2500
5000

Delta Volume v2, by AlexIncHere is my new version of exponentially-attinuated volume based indicator, which can be used for confirmation of other signals.
Triple Moving Averages++Extended version of Triple Moving Averages
Puts three moving averages on the chart can choose from
Simple Moving Average
Exponentially Weighted Moving Average
RSI Moving Average
Weighted Moving Average
Arnaud Legoux Moving Average
Volume Weighted Moving Average
Also includes options to hide each of the moving averages

Richard Carey - Crypto Appropriate EWMACAn exponentially weighted moving average crossover strategy with variable MA types and Fast Slow periods.

WhenWasThePriceAction
Bars of largest range (volatility)
* see moments of strongest price action immediately
* colored & upDown by candle color
* amplifier: you see only the bull runs, and subsequent dumps
Very nice on the 5 years scale of BITSTAMP:BTCUSD - nothing comparable to 2013 has happened yet.
Internals:
squared_range = pow(high-low, 2)
That is essentially it already. The rest are details:
* gauge with (in case of Bitcoin exponentially rising) price
* show in red for negative candles
* take even higher polynomial (than 2) to show only the very largest values
* allow some user input (but there is not much more that can be chosen here.)
Sorry for such a simple formula - but sometimes the easiest things are powerful.
Please give feedback. www.tradingview.com and/or in the cryptocurrency chat. Thanks.

FREE INDICATOR: POLARIZED FRACTAL EFFICIENCYLooking for something other than a moving average to help determine not only a trend's strength, but also it's direction? Try PFE!
PFE was developed by Hans Hannula that was invented to determine price efficiency over a user-defined time period.
The Polarized Fractal Efficiency indicator is, in the essence, an exponentially smoothed ratio of the length of two lines: (1) of a straight line between today’s close and the close Period days ago, and (2) of a broken line connecting all Close points between today and Period days ago. The indicator output varies between -100 and 100. The theory behind this indicator is that if it is >50 (or <-50) then the market is likely to reverse its trend from positive to negative (or from negative to positive).
Other usage:
Securities with a PFE greater than zero are deemed to be trending up, while a reading of less than zero indicates the trend is down. The strengh of the trend is measured by the position of the PFE relative to the zero line. As a general rule, the further the PFE value is away from zero, the stronger and more efficient the given trend is. A PFE value that fluctuates around the zero line could indicate that the supply and demand for the security are in balance and price may trade sideways.
As with all indicators, finding something that works well along side this would be the most beneficial way to use it.
Perhaps something like the Choppiness Index (related idea below) could do the trick.
Grab the source code here: pastebin.com
Installation video by @ChrisMoody here : blog.tradingview.com

Logarithmic Fair Value Anchor | PWLogarithmic Fair Value Anchor
This indicator overlays a dynamic "fair value" estimate on the price chart, anchored to the logarithmic rate of change (ROC) of a user-selected reference asset. It aims to provide a relative valuation perspective by comparing the chart symbol's smoothed log-price to the momentum of the anchor, with optional deviation bands for contextualizing price extremes. The design draws from observations of cross-asset relationships (e.g., liquidity proxies or commodities influencing crypto/equities), offering a flexible tool for exploring mean-reversion or divergence setups.
Core Mechanics and Math Overview
At its foundation, the fair value line starts with a baseline: the exponential of an EMA-smoothed natural log of the close price over a user-defined lookback (default 180 bars). This log transformation helps handle exponential growth common in assets like BTC, creating a smoother, scale-invariant trend estimate.
The anchor's influence is incorporated via its 1-period ROC (percentage change), smoothed with an EMA over the same lookback. This "base influence" multiplicatively adjusts the baseline: fair_value = baseline * exp(base_influence). An optional correlation filter weights this adjustment based on the absolute Pearson correlation between log(prices) and log(anchor) — if correlation falls below a threshold (default 0.0), the influence is reduced or zeroed, allowing manual override for custom emphasis.
The result is further smoothed with a DEMA (default length 14) for responsiveness. Deviation bands are plotted multiplicatively around this fair value using exp(deviation * level), ensuring proportionality on log charts. Users can switch between three band types:
Log Stdev: Standard deviation of the log(price / anchor) ratio over the lookback — dynamic and volatility-responsive.
Static Sigma: A fixed user-input deviation value (default 0.15) — non-adaptive, providing consistent relative widths influenced by the anchor's scale.
ATR: Relativized Average True Range (ATR / fair_value * scaling multiplier, default 3.0) — adjusts to recent range but smoother than stdev in high-vol markets.
Bands are asymmetric (separate upper/lower multipliers, defaults 1.8/1.25) with three levels (1-3x deviation), highlighting potential overbought/oversold zones.
Key Features
Anchor Flexibility: Predefined options include Gold (XAUUSD), Silver (XAGUSD), S&P 500 (SPX), BTC, or custom proxies like Global Liquidity Index (GLI) aggregates from FRED/ECONOMICS data sources.
Trend and Visuals: Basic trend detection (price vs. offset fair value) colors bars orange (bullish) or blue (bearish). Extreme band touches add diamond markers and background fills for quick identification.
Info Table (Toggleable): A compact dashboard showing current fair value, trend direction/duration (simple 8-bar slope and streak counter), z-score deviation (log(price / fair_value) / base_deviation, with approximate normal percentile for statistical context), and neutral bias notes.
Customization: Inputs for lengths, offsets, multipliers, and correlation settings allow tailoring to different assets or timeframes.
What Makes This Approach Distinct
Inspired by fair value models seen in online discussions (e.g., on X/Twitter), this script evolved from a liquidity-specific idea to a generalizable anchor-based tool. The logarithmic ROC adjustment provides a novel way to "pull" the fair value toward an external reference without direct ratioing, differing from traditional pairs trading or simple moving averages. Band variety addresses practical challenges like excessive volatility in crypto (where stdev bands can widen dramatically), offering alternatives like static sigma for benchmark-style consistency or ATR for range-focused adaptation — an exploration not commonly combined in one indicator.
Usage Suggestions
On Crypto Charts: Use GLI/M2 proxies as anchors for macro liquidity context; switch to ATR bands (longer ATR length like 180) to tame vol spikes. Monitor z-score >2σ for potential pullbacks.
On Equities/Indices: Anchor to Gold for inflation views or S&P for broad market ties; static sigma bands can highlight persistent deviations in trending regimes.
General Tips: Enable log scale on TradingView for visual accuracy. Use the offset (default 90) to "project" fair value forward for anticipation. Combine with your own filters — e.g., band crosses as entry signals or percentile extremes (>95%) as overextension alerts. The table's deviation metric helps quantify "how far" price has strayed, assuming approximate log-normality.
Testing: Backtest on historical data across anchors/bands to see fit; shorter lookbacks for intraday, longer for swings.
Available Anchors and Their Purpose
The indicator lets you select different reference assets/symbols to influence the fair value calculation. Each anchor brings its own momentum and context to the relative valuation:
Gold (XAUUSD) — Tracks gold price as a classic safe-haven and inflation-sensitive asset. Useful for spotting divergences in risk-on/risk-off environments.
Silver (XAGUSD) — Similar to gold but often more volatile and industrial-demand driven. Can highlight commodity cycles or broader metal trends.
S&P 500 (TVC:SPX) — Represents broad U.S. equity market performance. Helpful for comparing the chart asset to overall stock-market momentum.
BTC (INDEX:BTCUSD) — Self-referencing anchor (BTC to BTC). Useful as a neutral baseline or for testing the indicator's behavior on its native symbol.
GLI Proxy — An experimental, user-constructed approximation of global liquidity conditions. It combines select central bank balance sheet data (FRED/ECB/Japan/China) with major FX rates to create a rough composite proxy. Not an official economic index — purely illustrative and simplified for visualization purposes.
M2 Proxy — An experimental synthetic measure attempting to capture broad money supply trends across major economies (U.S., Eurozone, Japan, China, UK). It aggregates M2 data series multiplied by relevant exchange rates and scaled. Like the GLI proxy, this is not an economist-endorsed or precise M2 aggregate — it's a basic, illustrative construction meant for exploratory macro context only.
Important Notes on Proxies
The GLI Proxy and M2 Proxy are experimental approximations created within Pine Script using publicly available economic data feeds. They are not accurate substitutes for official global liquidity or money-supply metrics published by central banks or research institutions. Values can be noisy, delayed, or incomplete depending on data availability.
For best results, users should:
Test different anchors on their chosen asset and timeframe.
Adjust lookback length, correlation threshold, band type, and multipliers to better fit the specific market (e.g., longer lengths for lower timeframes or high-vol assets like crypto).
Be aware that proxy-based anchors may behave differently across symbols due to data quirks or correlation shifts.
This flexibility is what makes the tool adaptable — but it also means results are highly dependent on user configuration and market conditions.
This is an exploratory valuation overlay — results vary by market, settings, and anchor relevance. Not intended as trading advice; always verify with independent analysis.
Notes
Pine Script v6; requires access to external symbols via request.security().
Potential for minor repainting on realtime bars due to smoothing.
Community input welcome for refinements!

Daily Levels & MAs on intraday timeframeDaily Levels & MAs - Professional Key Level Tracker
📊 OVERVIEW
A comprehensive indicator that displays critical daily moving averages and key price levels all in one clean view. Perfect for traders who need to see support/resistance zones and trend indicators without cluttering their charts.
🎯 WHAT IT SHOWS
Seven essential reference levels:
- 50 SMA (Daily Simple Moving Average) - Yellow
- 21 EMA (Daily Exponential Moving Average) - Red
- 9 EMA (Daily Exponential Moving Average) - White
- Prior Day High (PDH) - Green
- Prior Day Low (PDL) - Purple/Magenta
- Premarket High (PM High) - Purple
- Premarket Low (PM Low) - Orange
✨ KEY FEATURES
✓ All lines extend to the right with clear price labels
✓ Daily moving averages calculated from daily timeframe data
✓ Prior Day High/Low tracks ONLY regular trading hours (9:30 AM - 4:00 PM)
✓ Premarket levels capture 4:00 AM - 9:30 AM price action
✓ Dotted line style keeps chart clean and readable
✓ Semi-transparent labels don't obstruct price action
✓ Works on ALL intraday timeframes
✓ Auto-updates throughout the day
🔧 TECHNICAL SPECIFICATIONS
- Lines start from beginning of current trading session
- Labels positioned 10 bars to the right of current price
- Max lines: 500 (efficient performance)
- No repainting - uses confirmed historical data
- Premarket lines remain visible during regular hours
📈 IDEAL FOR
- Day traders tracking intraday support/resistance
- Swing traders monitoring key daily trend levels
- Gap traders who need premarket reference points
- Breakout traders watching PDH/PDL violations
- Trend followers using EMA crossovers
💡 HOW TO USE
**Moving Averages:**
- 50 SMA: Long-term trend direction
- 21 EMA: Medium-term momentum
- 9 EMA: Short-term trend and quick reversals
**Price Levels:**
- PDH/PDL: Yesterday's trading range boundaries
- PM High/Low: Today's premarket extremes
- Watch for breaks above/below these levels for potential momentum
🎨 COLOR CODING
- Yellow: 50 SMA (major trend)
- Red: 21 EMA (medium trend)
- White: 9 EMA (fast trend)
- Green: Prior Day High
- Purple/Magenta: Prior Day Low
- Purple: Premarket High
- Orange: Premarket Low
⚙️ SMART FEATURES
- Prior Day calculations exclude premarket/afterhours noise
- Premarket levels reset daily at 4:00 AM
- All levels visible simultaneously without overlap confusion
- Labels show exact price values for precision entries/exits
- Lines automatically adjust length as trading day progresses
📊 TRADING STRATEGIES
**Breakout Trading:**
- Long above PDH with volume confirmation
- Short below PDL with momentum
**Mean Reversion:**
- Fade extremes back to moving averages
- Look for price rejections at PM High/Low
**Trend Following:**
- Buy pullbacks to 9 EMA in uptrends (price above 21/50)
- Sell rallies to 9 EMA in downtrends (price below 21/50)
**Gap Trading:**
- Compare open to PDH/PDL
- Use PM levels to gauge early sentiment
🔒 NO CONFIGURATION NEEDED
Simply add to your chart and start trading! The indicator automatically:
1. Calculates daily moving averages from higher timeframe
2. Tracks prior day regular hours high/low
3. Monitors current premarket session extremes
4. Displays everything with clear labels and prices
Perfect for professional traders who want institutional-grade levels without the complexity!

[Sumit Ingole] 200-EMA SUMIT INGOLE
Indicator Name: 200 EMA Strategy Pro
Overview
The 200-period Exponential Moving Average (EMA) is widely regarded as the "Golden Line" by professional traders and institutional investors. This indicator is a powerful tool designed to identify the long-term market trend and filter out short-term market noise.
By giving more weight to recent price data than a simple moving average, this EMA reacts more fluidly to market shifts while remaining a rock-solid trend confirmation tool.
Key Features
Trend Filter: Instantly distinguish between a Bull market and a Bear market.
Price above 200 EMA: Bullish Bias
Price below 200 EMA: Bearish Bias
Dynamic Support & Resistance: Acts as a psychological floor or ceiling where major institutions often place buy or sell orders.
Institutional Benchmark: Since many hedge funds and banks track this specific level, price reactions near the 200 EMA are often highly significant.
Reduced Lag: Optimized exponential calculation ensures you stay ahead of the curve compared to traditional lagging indicators.
How to Trade with 200 EMA
Trend Confirmation: Only look for "Buy" setups when the price is trading above the 200 EMA to ensure you are trading with the primary trend.
Mean Reversion: When the price stretches too far away from the 200 EMA, it often acts like a magnet, pulling the price back toward it.
The "Death Cross" & "Golden Cross": Use this in conjunction with shorter EMAs (like the 50 EMA) to identify major trend reversals.
Exit Strategy: Can be used as a trailing stop-loss for long-term positional trades.
Best Used On:
Timeframes: Daily (1D), 4-Hour (4H), and Weekly (1W) for maximum accuracy.
Assets: Highly effective for Stocks, Forex (Major pairs), and Crypto (BTC/ETH).
Disclaimer: This tool is for educational and analytical purposes only. Trading involves risk, and it is recommended to use this indicator alongside other technical analysis tools for better confirmation.

Adaptive Regime Master: The Dual-Engine FrameworkAdaptive Regime Master: The Dual-Engine Framework
Overview
The Adaptive Regime Master: The Dual-Engine Framework is a sophisticated technical analysis tool designed to solve the "Indicator Paradox"—the reality that trend-following tools fail in sideways markets, and mean-reversion tools fail in strong trends.
Instead of forcing a single mathematical model onto an ever-changing market, this framework utilizes a Master Switch logic. It continuously analyzes market volatility and directional strength to dynamically toggle between two specialized trading engines. By identifying the current "Market Regime," the indicator automatically reconfigures its visual interface and signal logic to match the environment.
The Dual-Engine Architecture
The framework operates on a logic-gate system powered by the Average Directional Index (ADX) :
1. The Momentum Engine (Trendy Regime):
Activation: Triggered when ADX rises above the 25 threshold, signaling a confirmed trend.
Logic: Utilizes a combination of Exponential Moving Averages (EMA) for trend-following and MACD Histogram for momentum confirmation.
Visuals: The chart de-clutters to show only the EMA trend-line and momentum-based signals.
2. The Mean-Reversion Engine (Choppy Regime):
Activation: Triggered when ADX falls below 25, signaling a range-bound or consolidating market.
Logic: Switches to Bollinger Bands and the Relative Strength Index (RSI) to identify overextended price action at the range extremes.
Visuals: The EMA disappears, and the chart displays Bollinger Bands to help users visualize the "value area" and potential reversal zones.
Key Features
Alternating Signal Logic: Built-in state management ensures that signals always alternate (Buy → Sell → Buy). This prevents "signal clustering" and provides a clean, actionable roadmap for the user.
Dynamic ATR-Based Protection: The indicator calculates Stop Loss (SL) and Take Profit (TP) levels using the Average True Range (ATR) . Crucially, the multipliers adjust based on the regime: wider stops for volatile trends and tighter stops for quiet ranges.
Intrabar Execution Guard: To prevent "false exits," the framework includes a calculation safeguard that prevents SL/TP triggers on the same candle as the entry, ensuring the trade has room to breathe.
Real-Time Regime Dashboard: An on-chart table provides an immediate summary of the current ADX value, the active engine mode, and the current position status.
Visual Regime Indicator: Background color changes dynamically—Blue for Trend Mode, Orange for Range Mode.
Comprehensive Alert System: Built-in alerts for Long Entry, Short Entry, TP Hit, and SL Hit events.
How to Use
Identify the Background: A Blue background indicates the Momentum Engine is active; an Orange background indicates the Mean-Reversion Engine is active.
Execution: Follow the BUY and SELL labels. The framework handles the logic of whether it is a "breakout" or a "reversal" based on the active engine.
Risk Management: Once a signal appears, Red (SL) and Lime (TP) crosses will appear on the chart. These are your mathematical boundaries for the trade.
The Exit: The position is considered closed when price hits the SL/TP markers (indicated by orange/yellow crosses) or when an opposing signal is generated.
Monitor the Dashboard: Use the top-right table to track the current regime, ADX value, active mode, and position status in real-time.
Input Parameters
ADX Length: Period for ADX calculation (default: 14)
ADX Smoothing: Smoothing period for ADX (default: 14)
ADX Trend Threshold: Threshold to distinguish trend from range (default: 25)
EMA Length: Period for the Exponential Moving Average (default: 20)
BB Length: Period for Bollinger Bands (default: 20)
BB Multiplier: Standard deviation multiplier for Bollinger Bands (default: 2.0)
RSI Length: Period for RSI calculation (default: 14)
ATR Length: Period for Average True Range (default: 14)
ATR Mult (Trend): ATR multiplier for stop loss in trend mode (default: 1.5)
ATR Mult (Range): ATR multiplier for stop loss in range mode (default: 0.8)
Min SL % (of price): Minimum stop loss as percentage of price (default: 0.5%)
Pros and Cons
Pros:
Versatility: Performs in all market conditions, reducing the need for multiple separate indicators.
Reduced Fakeouts: Filters out "trend signals" during flat markets and "reversal signals" during parabolic moves.
Visual Clarity: Only shows the indicators relevant to the current market state, reducing cognitive load and chart clutter.
Automated Risk-Reward: Automatically plots 1:2 Risk-Reward levels based on current volatility.
Professional-Grade Logic: Implements state management to prevent signal conflicts and ensure clean alternating entries.
Multi-Timeframe Compatibility: Works on any timeframe, though optimized for intraday and swing trading.
Cons:
Lagging Nature: Like all ADX-based systems, there is a slight lag when the market transitions from a range to a trend.
Threshold Sensitivity: The default ADX threshold of 25 may need tuning for extremely low-volatility assets or different timeframes.
Not a "Holy Grail": While it filters many bad trades, sudden fundamental news or black swan events can still bypass technical logic.
Requires Discipline: Users must follow the signals and respect the SL/TP levels for the framework to be effective.
Learning Curve: New users may need time to understand the regime-switching concept and trust the automated logic.
Why Use This Framework?
Most traders lose money because they apply the wrong tool to the wrong market. They use RSI to "sell the top" of a breakout, or use Moving Averages to "buy the dip" in a sideways grind. The Adaptive Regime Master removes the emotional guesswork by mathematically defining the market state and forcing the strategy to adapt.
This is a professional-grade framework for traders who value:
Logic over emotion
Discipline over impulse
Chart cleanliness over indicator overload
Adaptive systems over static strategies
Whether you're a scalper, day trader, or swing trader, this framework provides a systematic approach to reading market conditions and executing high-probability setups with predefined risk management.
Best Practices
Never forget to adjust Stop Loss and Take Profit level related to the interval you (will) use. (Default parameters are optimized for 60m)
Always backtest the indicator on your specific asset and timeframe before live trading
Adjust the ADX threshold based on the volatility characteristics of your market
Use the framework in conjunction with proper position sizing and account risk management
Pay attention to the regime dashboard—avoid forcing trades when the market is transitioning between regimes
Set up alerts for all signal types to avoid missing opportunities
Consider fundamental analysis and news events alongside technical signals
Detailed Disclaimer
FINANCIAL RISK WARNING:
Trading foreign exchange, stocks, indices, cryptocurrencies, and commodities on margin carries a high level of risk and may not be suitable for all investors. The high degree of leverage can work against you as well as for you. Before deciding to invest in any financial instrument, you should carefully consider your investment objectives, level of experience, and risk appetite. The possibility exists that you could sustain a loss of some or all of your initial investment; therefore, you should not invest money that you cannot afford to lose.
NO INVESTMENT ADVICE:
The "Adaptive Regime Master: The Dual-Engine Framework" is an educational tool designed to assist in technical analysis. It does not constitute investment advice, financial advice, trading advice, or a recommendation to buy or sell any security or financial instrument. All content provided by this indicator is for informational and educational purposes only.
PAST PERFORMANCE:
Past performance is not indicative of future results. Hypothetical or simulated performance results have certain limitations. Unlike an actual performance record, simulated results do not represent actual trading and may not be impacted by brokerage and other slippage fees. Simulated trading programs in general are also subject to the fact that they are designed with the benefit of hindsight.
NO GUARANTEE:
No representation is being made that any account will or is likely to achieve profits or losses similar to those shown in any backtests or forward tests. The author and developers of this indicator make no warranties, expressed or implied, regarding the accuracy, completeness, or reliability of the information provided.
USER RESPONSIBILITY:
Users should perform their own due diligence and test the logic on a demo or paper trading account before applying it to live capital. You are solely responsible for your own investment and trading decisions. The author and developers assume no responsibility for any financial losses, damages, or adverse consequences incurred through the use of this tool.
ACCEPTANCE OF TERMS:
Use of this indicator constitutes acceptance of these terms and acknowledgment that you understand the risks involved in trading financial instruments.
REGULATORY NOTICE:
This indicator is not affiliated with, endorsed by, or approved by any financial regulatory authority. Always consult with a licensed financial advisor before making investment decisions.
