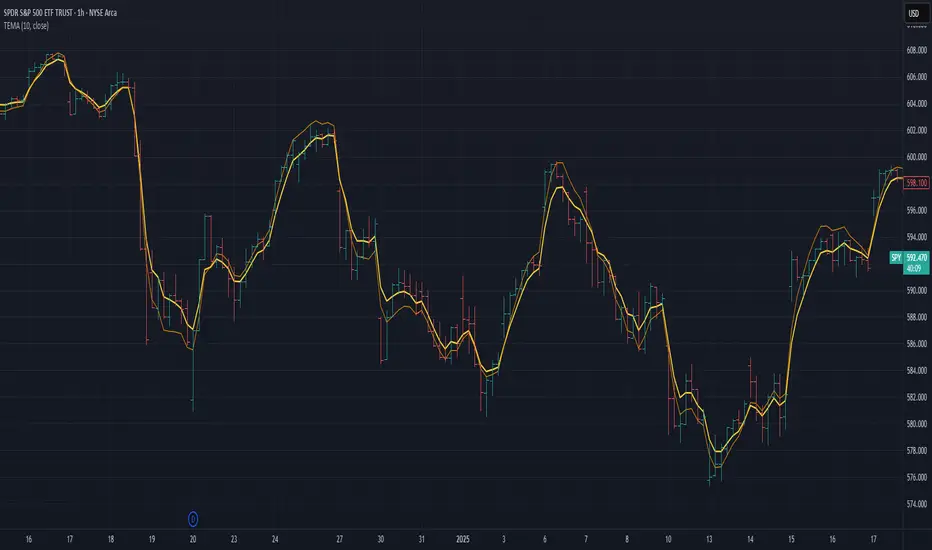
Triple Exponential Moving Average (TEMA)The Triple Exponential Moving Average (TEMA) is an advanced technical indicator designed to significantly reduce the lag inherent in traditional moving averages while maintaining signal quality. Developed by Patrick Mulloy in 1994 as an extension of his DEMA concept, TEMA employs a sophisticated triple-stage calculation process to provide exceptionally responsive market signals.
TEMA's mathematical approach goes beyond standard smoothing techniques by using a triple-cascade architecture with optimized coefficients. This makes it particularly valuable for traders who need earlier identification of trend changes without sacrificing reliability. Since its introduction, TEMA has become a key component in many algorithmic trading systems and professional trading platforms.
▶️ **Core Concepts**
Triple-stage lag reduction: TEMA uses a three-level EMA calculation with optimized coefficients (3, -3, 1) to dramatically minimize the delay in signal generation
Enhanced responsiveness: Provides significantly faster reaction to price changes than standard EMA or even DEMA, while maintaining reasonable smoothness
Strategic signal processing: Employs mathematical techniques to extract the underlying trend while filtering random price fluctuations
Timeframe effectiveness: Performs well across multiple timeframes, though particularly valued in short to medium-term trading
TEMA achieves its enhanced responsiveness through an innovative triple-cascade architecture that strategically combines three levels of exponential moving averages. This approach effectively removes the lag component inherent in EMA calculations while preserving the essential smoothing benefits.
▶️ **Common Settings and Parameters**
Length: Default: 12 | Controls sensitivity/smoothness | When to Adjust: Increase in choppy markets, decrease in strongly trending markets
Source: Default: Close | Data point used for calculation | When to Adjust: Change to HL2/HLC3 for more balanced price representation
Corrected: Default: false | Adjusts internal EMA smoothing factors for potentially faster response | When to Adjust: Set to true for a modified TEMA that may react quicker to price changes. false uses standard TEMA calculation
Visualization: Default: Line | Display format on charts | When to Adjust: Use filled cloud to see divergence from price more clearly
Pro Tip: For optimal trade signals, many professional traders use two TEMAs (e.g., 8 and 21 periods) and look for crossovers, which often provide earlier signals than traditional moving average pairs.
▶️ **Calculation and Mathematical Foundation**
Simplified explanation:
TEMA calculates three levels of EMAs, then combines them using a special formula that amplifies recent price action while reducing lag. This triple-processing approach effectively eliminates much of the delay found in traditional moving averages.
Technical formula:
TEMA = 3 × EMA₁ - 3 × EMA₂ + EMA₃
Where:
EMA₁ = EMA(source, α₁)
EMA₂ = EMA(EMA₁, α₂)
EMA₃ = EMA(EMA₂, α₃)
The smoothing factors (α₁, α₂, α₃) are determined as follows:
Let α_base = 2/(length + 1)
α₁ = α_base
If corrected is false:
α₂ = α_base
α₃ = α_base
If corrected is true:
Let r = (1/α_base)^(1/3)
α₂ = α_base * r
α₃ = α_base * r * r = α_base * r²
The corrected = true option implements a variation that uses progressively smaller alpha values for the subsequent EMA calculations. This approach aims to optimize the filter's frequency response and phase lag.
Alpha Calculation for corrected = true:
α₁ (alpha_base) = 2/(length + 1)
r = (1/α₁)^(1/3) (cube root relationship)
α₂ = α₁ * r = α₁^(2/3)
α₃ = α₂ * r = α₁^(1/3)
Mathematical Rationale for Corrected Alphas:
1. Frequency Response Balance:
The standard TEMA (where α₁ = α₂ = α₃) can lead to an uneven frequency response, potentially over-smoothing high frequencies or creating resonance artifacts. The geometric progression of alphas (α₁ > α₁^(2/3) > α₁^(1/3)) in the corrected version aims to create a more balanced filter cascade. Each stage contributes more proportionally to the overall frequency response.
2. Phase Lag Optimization:
The cube root relationship between the alphas is designed to minimize cumulative phase lag while maintaining smoothing effectiveness. Each subsequent EMA stage has a progressively smaller impact on phase distortion.
3. Mathematical Stability:
The geometric progression (α₁, α₁^(2/3), α₁^(1/3)) can enhance numerical stability due to constant ratios between consecutive alphas. This helps prevent the accumulation of rounding errors and maintains consistent convergence properties.
Practical Impact of corrected = true:
This modification aims to achieve:
Potentially better lag reduction for a similar level of smoothing
A more uniform frequency response across different market cycles
Reduced overshoot or undershoot in trending conditions
Improved signal-to-noise ratio preservation
Essentially, the cube root relationship in the corrected TEMA attempts to optimize the trade-off between responsiveness and smoothness that can be a challenge with uniform alpha values.
🔍 Technical Note: Advanced implementations apply compensation techniques to all three EMA stages, ensuring TEMA values are valid from the first bar without requiring a warm-up period. This compensation corrects initialization bias and prevents calculation errors from compounding through the cascade.
▶️ **Interpretation Details**
TEMA excels at identifying trend changes significantly earlier than traditional moving averages, making it valuable for both entry and exit signals:
When price crosses above TEMA, it often signals the beginning of an uptrend
When price crosses below TEMA, it often signals the beginning of a downtrend
The slope of TEMA provides insight into trend strength and momentum
TEMA crossovers with price tend to occur earlier than with standard EMAs
When multiple-period TEMAs cross each other, they confirm significant trend shifts
TEMA works exceptionally well as a dynamic support/resistance level in trending markets
For optimal results, traders often use TEMA in combination with momentum indicators or volume analysis to confirm signals and reduce false positives.
▶️ **Limitations and Considerations**
Market conditions: The high responsiveness can generate false signals during highly choppy, sideways markets
Overshooting: More aggressive lag reduction leads to more pronounced overshooting during sharp reversals
Parameter sensitivity: Changes in length have more dramatic effects than in simpler moving averages
Calculation complexity: Triple cascaded EMAs make behavior less predictable and more resource-intensive
Complementary tools: Should be used with confirmation tools like RSI, MACD or volume indicators
▶️ **References**
Mulloy, P. (1994). "Smoothing Data with Less Lag," Technical Analysis of Stocks & Commodities .
Mulloy, P. (1995). "Comparing Digital Filters," Technical Analysis of Stocks & Commodities .
Cerca negli script per "Exponential"
Moving Average Exponential-DonCHI-SUPERTRENDThe "Moving Average Exponential-DonCHI-SUPERTREND" is a trading strategy or indicator that combines three distinct technical analysis tools:
Moving Average Exponential (EMA): This is a type of moving average that gives more weight to recent prices, making it more responsive to price changes compared to a simple moving average.
Donchian Channels (DonCHI): These are bands that are plotted above and below the recent price highs and lows. They help identify the current price volatility and potential breakout points.
SUPERTREND: This is a trend-following indicator that uses the average true range (ATR) to determine the direction of the trend. It provides signals similar to moving averages but with less lag.

Zero Lag Exponential Moving Average ForLoop [InvestorUnknown]Overview
The Zero Lag Exponential Moving Average (ZLEMA) ForLoop indicator is designed for traders seeking a responsive and adaptive tool to identify trend changes. By leveraging a range of lengths and different moving average (MA) types, this indicator helps smooth out price data and provides timely signals for market entry and exit.
User Inputs
Start and End Lengths: Define the range of lengths over which the IIRF values are calculated.
Moving Average Type: Choose from EMA, SMA, WMA, VWMA, or TMA for trend smoothing.
Moving Average Length: Specify the length for the chosen MA type.
Calculation Source: Select the price data used for calculations.
Signal Calculation
Signal Mode (sigmode): Determines the type of signal generated by the indicator. Options are "Fast", "Slow", "Thresholds Crossing", and "Fast Threshold".
1. Slow: is a simple crossing of the midline (0).
2. Fast: positive signal depends if the current MA > MA or MA is above 0.99, negative signals comes if MA < MA or MA is below -0.99.
3. Thresholds Crossing: simple ta.crossover and ta.crossunder of the user defined threshold for Long and Short.
4. Fast Threshold: signal changes if the value of MA changes by more than user defined threshold against the current signal
col1 = MA > 0 ? colup : coldn
var color col2 = na
if MA > MA or MA > 0.99
col2 := colup
if MA < MA or MA < -0.99
col2 := coldn
var color col3 = na
if ta.crossover(MA,longth)
col3 := colup
if ta.crossunder(MA,shortth)
col3 := coldn
var color col4 = na
if (MA > MA + fastth)
col4 := colup
if (MA < MA - fastth)
col4 := coldn
color col = switch sigmode
"Slow" => col1
"Fast" => col2
"Thresholds Crossing" => col3
"Fast Threshold" => col4
Visualization Settings
Bull Color (colup): The color used to indicate bullish signals.
Bear Color (coldn): The color used to indicate bearish signals.
Color Bars (barcol): Option to color the bars based on the signal.
Custom function
// Function to calculate an array of ZLEMA values over a range of lengths
ZLEMAForLoop(a, b, c, s) =>
// Initialize an array to hold ZLEMA trend values
var Array = array.new_float(b - a + 1, 0.0)
// Loop through the range from 'a' to 'b'
for x = 0 to (b - a)
// Calculate the current length
len = a + x
// Calculate the lag based on the length
lag = math.floor((len - 1) / 2)
// Calculate the smoothing factor alpha
alpha = 2 / (len + 1)
// Initialize the ZLEMA variable
zlema = 0.0
// Compute the ZLEMA value
zlema := na(zlema ) ? (s + s - s ) : alpha * (s + s - s ) + (1 - alpha) * nz(zlema )
// Determine the trend based on ZLEMA value
trend = zlema > zlema ? 1 : -1
// Store the trend in the array
array.set(Array, x, trend)
// Calculate the average of the trend values
Avg = array.avg(Array)
// Apply the selected moving average type to the average trend value
float MA = switch maType
"EMA" => ta.ema(Avg, c) // Exponential Moving Average
"SMA" => ta.sma(Avg, c) // Simple Moving Average
"WMA" => ta.wma(Avg, c) // Weighted Moving Average
"VWMA" => ta.vwma(Avg, c) // Volume-Weighted Moving Average
"TMA" => ta.trima(Avg, c) // Triangular Moving Average
=>
runtime.error("No matching MA type found.") // Error handling for unsupported MA type
float(na)
// Return the array of trends, the average trend, and the moving average
Important Considerations
Speed vs. Stability: The ZLEMA ForLoop is designed for fast response times, making it ideal for short-term trading strategies. However, its sensitivity also means it may generate more signals, some of which could be false positives.
Use with Other Indicators: To improve the reliability of the signals, it is recommended to use the ZLEMA ForLoop in conjunction with other technical indicators.
Customization: Tailor the settings to match your trading style and risk tolerance. Adjusting the lengths, MA type, and thresholds can significantly impact the indicator's performance.
Conclusion
The ZLEMA ForLoop indicator offers a flexible tool for traders looking to capture trend changes quickly. By providing multiple modes and customization options, it allows traders to fine-tune their analysis and make informed decisions. For best results, use this indicator alongside other analytical tools to confirm signals and avoid potential false entries.

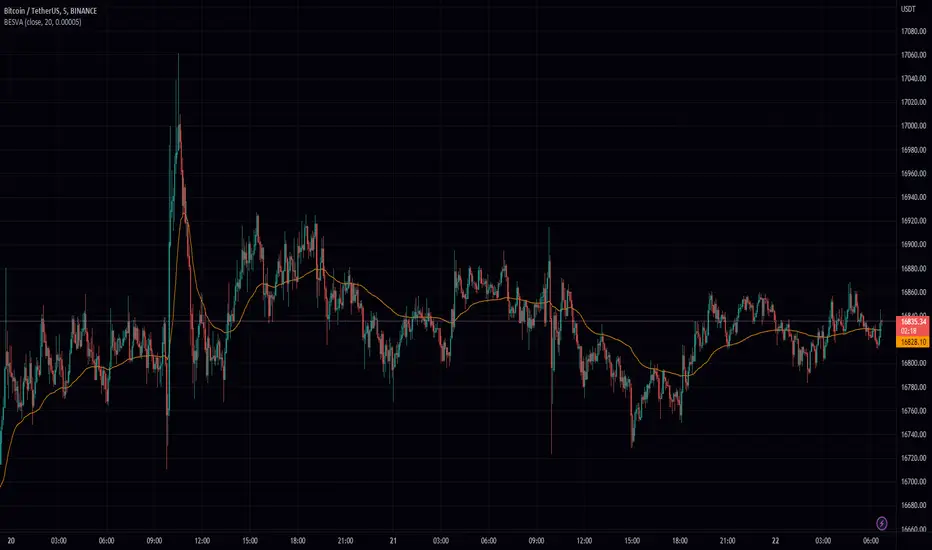
Brown's Exponential Smoothing Volatility Adjusted (BESVA)Introduction:
This script is a technical indicator for financial markets, designed to provide traders with a smoothed version of an asset's price using Brown's exponential smoothing method. The indicator adjusts the smoothing parameter based on the volatility of the asset, resulting in a smoother plot with less volatility and a quicker response to price changes with higher volatility.
Methodology:
The indicator begins by defining a length parameter, which determines the number of bars used in a volatility calculation. The user can input a value for this parameter, with a default of 20 bars.
Next, the script calculates the standard deviation of the asset's close price over the defined length, which serves as a measure of volatility. The standard deviation is then normalized by dividing it by the maximum standard deviation and adding a minimum value (set to 0.00005 by default). This normalization technique ensures that the indicator is comparable across different asset classes and time frames.
The normalized volatility measure is then used to adjust the smoothing parameter for the exponential moving average. Specifically, the smoothing parameter is set to the normalized volatility measure, with the minimum value used when the volatility is at its minimum. As the volatility increases, the smoothing parameter decreases, resulting in a quicker response to price changes.
The resulting smoothed price plot is then plotted on the chart.
Conclusion:
This script provides a useful tool for traders looking to analyze the trends in an asset's price while taking into account its volatility. The adjustable smoothing parameter ensures that the indicator responds appropriately to changes in volatility, making it a valuable addition to a trader's toolkit.
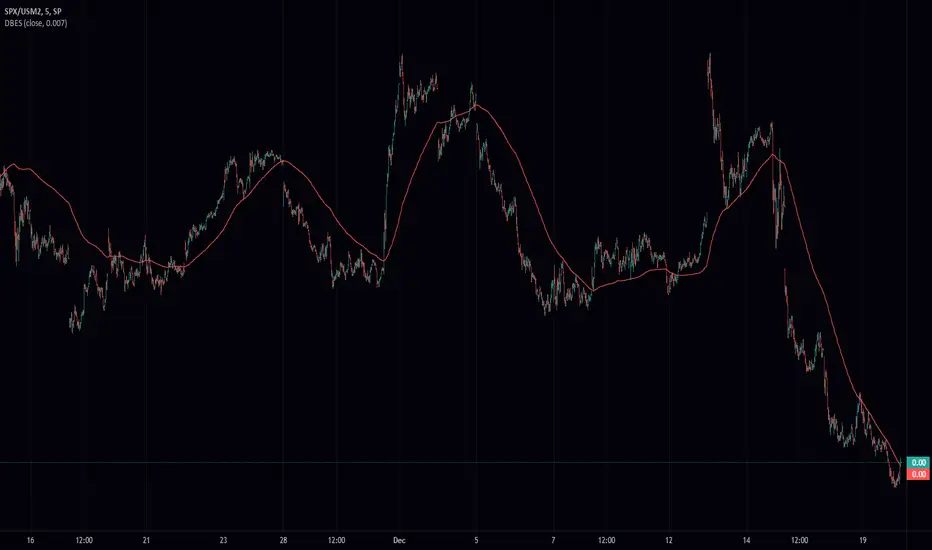
Double Brown's Exponential Smoother (DBES)The Double Browns Exponential Smoother (DBES) is a trend-following indicator that reduces the lag present in other moving averages by using a double exponential smoothing technique. It takes in the source data and a smoothing factor as input and produces a smoothed version of the source data. The DBES is then calculated as the difference between twice the output of the first smoothing calculation and the output of the second smoothing calculation. The DEMA is useful for traders looking to identify trends in the markets.
Volume Weighted Exponential Moving AverageThis is a volume weighted exponential moving average. uses exponential weighting and considers volume in the consideration of the average price. This makes for a more accurate "average" than a standard moving average.

Hull Weighted Exponential Moving AverageBINANCE:BTCUSDT
Open source version of the Hull Weighted Exponential Moving Average as described by Vincent Charles in [ Hull-WEMA: A Novel Zero-Lag Approach in the Moving Average Family ]
█ OVERVIEW
The study takes into considerations two variants of MA.
Namely:
Weighted Exponential Moving Average (WEMA)
Hull Moving Average (HMA)
WEMA, which was introduced in 2013, has been widely used in different scenarios but still suffers from lags.
To address this shortcoming, a novel zero-lag Hull-WEMA method is proposed that combines HMA and WEMA.
Results show that the new approach achieves a better accuracy level than both HMA and WEMA.
█ SIGNALS
The indicator generates:
a LONG signal when switching color from RED to GREEN
a SHORT signal when switching color from GREEN to RED
Additionally is available an option to color the candles on your chart to confirm the signals and filter ranges.

Moving Average Exponential CrossA simple indicator that shows a 16 day exponential MA and a 31 day exponential MA. This is used with other various indicators to confirm trend formation and continuation.

3 Moving Average Exponential with multi TFThis is a simple Exponential Moving Average indicator. It allows you to have 3 Exponential Moving Averages and set a specific TimeFrame for each. Feel free to cope code LOL!

SMA Simple, EMA Exponential Moving Averages with high lowThis is a rewrite of my previous moving average script.
In this version, I have added the 3 day high and low as these are often used as short term trend following entry points
Traders often try to buy the 3 day average of lows in an uptrend and sell the 3 day average of highs in a downtrend
In the same fashion, I have added the 3 week high and low averages for longer term trend following for swing trading
I have added the 18 day, week, month simple moving averages ( SMA ) as I follow these from Ira Epsteins free you tube trading videos).
His 50 years of experience has taught him these are best
I have also added some longer term SMA , 100 day, 200 day, 100w, and 200w
Exponential EMA averages for longer term charts are included 100d, 200d, 100w, 100m, 200m
You can configure the script in the options to remove the ones you don't want to follow
I have removed the micro averages from my previous script since they are for short term scalping day trading hyper-trading which I don't do
Exponential averages are shown as crosses
some of the longer term averages are circles just to set them apart
Elder impulse system with double exponential moving average dema
This version of impulse uses the double exponential moving average instead of the typical ema both to calculate macd and the moving slow and fast moving average that are plotted.
The impulse system :
The Impulse System combines two simple but powerful indicators.
One measures market inertia, the other its momentum. When both
point in the same direction, they identify an impulse worth following.
We get an entry signal when both indicators get in gear.
The Impulse System uses an exponential moving average to find
uptrends and downtrends. When the EMA rises, it shows that inertia
favors the bulls. When EMA falls, inertia works for the bears. The sec-
ond component is MACD-Histogram, an oscillator whose slope reflects
changes of power among bulls or bears. When MACD-Histogram rises,
it shows that bulls are becoming stronger. When it falls, it shows that
bears are growing stronger.
The Impulse System flags those bars where both the inertia and the
momentum point in the same direction. When both the EMA and
MACD-Histogram rise, they show that bulls are roaring and the uptrend
is accelerating.
3 EMAS strategy to define trendsBasic script that allows you to have 3 scripts all in one EMA (exponential moving averages). They are useful to know the general trends of your chart: current long-term trend, short-term (or immediately) and general.
1 ° EMA 36 serves to define or mark action of the market trend price.
At the moment of crossing EMA 36 with EMA 200 upwards it indicates continuation to level 2 ...
2 ° EMA 200 serves as support or resistance according to the case, confirms continuation of trend in medium or long term when crossing with EMA 500, upward trend probability level 3 confirmed. As the case may be, cross up or down.
3 ° EMA 500 serves as support or resistance of the price action.
EMAS 200 and 500 give you a probability of Starting Area ...
Confirming with support or resistance.
Complementation with Stochastics ..
MACD
Note: Remember that "exponential" means that these indicators give more weight to the most recent data, making them more reactive to price changes (react faster to changes in recent prices than simple moving averages)
GROWINGS CRYPTOTRADERS

Binque's Multi-Moving Average Binque's Multi-Moving Average - One indicator with four simple moving average and four exponential moving averages, plus as a bonus a Day High moving average and a Day Low Moving Average.
Simple Moving Average or MA(14), MA(50), MA(100) and MA(200) all in one indicator
Exponential Moving Average or EMA(8), EMA(14), EMA(20) and EMA(33) all in one indicator
Day High Moving Average - Tracks the Daily High versus most moving averages track the daily close.
Day Low Moving Average - Tracks the Daily Low versus most moving average track the daily close.
To Disable moving averages, Set the color to the chart background and then set the length to 1 and uncheck.
I Use the Daily High Moving Average to track upward resistance in a stock movement for Swing Trading.
I Use the Daily Low Moving Average to track my trailing stop in a stock movement for Swing Trading.

x5-smooth-ema[t90]Overview
The x5 Smoothed EMA Flow is a trend-visualization tool designed to filter out market "noise" by applying a secondary smoothing layer to a base Exponential Moving Average (EMA).
How to Use
Trend Filtering: The "Flow" helps identify the true trend. When the ribbon is expanding and colored for a bullish trend, it signals strong, sustained momentum.
Noise Reduction: Unlike a standard EMA which can "whipsaw" during consolidation, the double-smoothed layers stay smoother for longer, helping traders stay in a position during minor pullbacks.
Trend Confirmation: Use the alignment of all smoothing layers to confirm a trend. When all layers transition to the same color, it indicates a high-probability trend shift.
Dynamic Support/Resistance: The ribbon acts as a depth-based support or resistance zone. Price often reacts to the "core" of the flow before continuing its primary move.
Settings
Source: Choose the price source (Close, HL2, etc.) for the initial calculation.
Base Length: Adjust the sensitivity. Shorter lengths are better for scalping; longer lengths are optimized for swing trading.
Color Settings: Fully customizable Bull and Bear colors to match your chart theme.
Disclaimer: This indicator is for educational purposes only. Moving averages are lagging indicators and should be used in conjunction with other forms of analysis. Past performance is not indicative of future results.

Moving Average ExponentialThe EMA 50 Trend Filter At the heart of the Sniper system lies the 50-period Exponential Moving Average. Unlike simple moving averages, the EMA applies a weighting factor to recent price data, significantly reducing lag. Role in Strategy:
Trend Identification: Serves as the binary divider between Long and Short bias.
Dynamic Structure: Acts as dynamic support in uptrends and resistance in downtrends.
Signal Filtering: The algorithm automatically suppresses any 'Buy' signals below the line and 'Sell' signals above it, ensuring you never trade against the institutional momentum.

3 Moving Average Exponential3 Moving Average Exponential, up to 10 ema with the possibility to personalize the lenght of each of them
10 Moving Average ExponentialHaving the possibility to add multiple Moving Average Exponential up to 10 with one indicator
Bitcoin Exponential Profit Strategy### Strategy Description:
The **Bitcoin Trading Strategy** is an **Exponential Moving Average (EMA) crossover strategy** designed to identify bullish trends for Bitcoin.
1. **Indicators**:
- **Fast EMA (default 9 periods)**: Represents the short-term trend.
- **Slow EMA (default 21 periods)**: Represents the longer-term trend.
2. **Entry Condition**:
- A **bullish crossover** occurs when the Fast EMA crosses above the Slow EMA.
- The strategy enters a **long position** with a user-defined order size (default 0.01 BTC).
3. **Exit Conditions**:
- **Take Profit**: Closes the position when the profit target is reached (default $100).
- **Stop Loss**: Closes the position when the price drops below the stop loss level (default $50).
- **Bearish Crossunder**: Closes the position when the Fast EMA crosses below the Slow EMA.
4. **Visual Signals**:
- **BUY signals**: Displayed when a bullish crossover occurs.
- **SELL signals**: Displayed when a bearish crossunder occurs.
This strategy is optimized for trend-following behavior, ensuring positions are aligned with upward-moving trends while managing risk through clear stop-loss and take-profit levels.

Volatility Exponential Moving AverageVEMA is a custom indicator that enhances the traditional moving average by incorporating market volatility. Unlike standard moving averages that rely solely on price, VEMA integrates both the Simple Moving Average (SMA) and the Exponential Moving Average (EMA) of the closing price, alongside a measure of market volatility.
The unique aspect of VEMA is its approach. It calculates the standard deviation of the closing price and also computes the simple moving average of this volatility. This dual approach to understanding market fluctuations allows for a more nuanced understanding of market dynamics.
Key to VEMA's functionality is the dynamic weighting factor, which adjusts the influence of SMA and EMA based on current market volatility. This factor increases the weight of the EMA, which is more responsive to recent price changes, during periods of high volatility. Conversely, during periods of lower volatility, the SMA, which offers a smoother view of price trends, becomes more prominent.
The resultant is a hybrid moving average that responds adaptively to changes in market volatility. This adaptability makes VEMA particularly useful in dynamic markets, potentially offering more insightful trend analysis and reversal signals compared to traditional moving averages.

Moving Average Exponential Angle DetectionMoving Average exponential angle detection use to find the angle of moving average so we can take trade according to our strategy.
Hope you like this.
Thanks and Regards,
TradingTail

True Range Adjusted Exponential Momentum [CC]-[burgered]Original Script by CheatCountry, used with permission (chill guy):
I have made a sort of conversion of CheatCountries implementation of the True Range Adjusted Exponential Moving Average into a momentum oscillator.
Being True Range based, it the bounds vary based on the chart.
Includes a Bollinger Band for bounds that forms a trend follower based on the 0 point.
Includes CheatCountry color code signals, different color scheme. Bright colors are strong signals, ark are weak, green bull, red bear, the basics.
This oscillator can be used for divergences, trends, signal strength, confirmation, volatility readings, you name it.
Works well on smoothed/filtered signals as well.
Give CheatCountry a follow, hes one of the MVPs of Tradingview Pinescripters, constantly giving us access to novel new concepts as they are published by professionals.
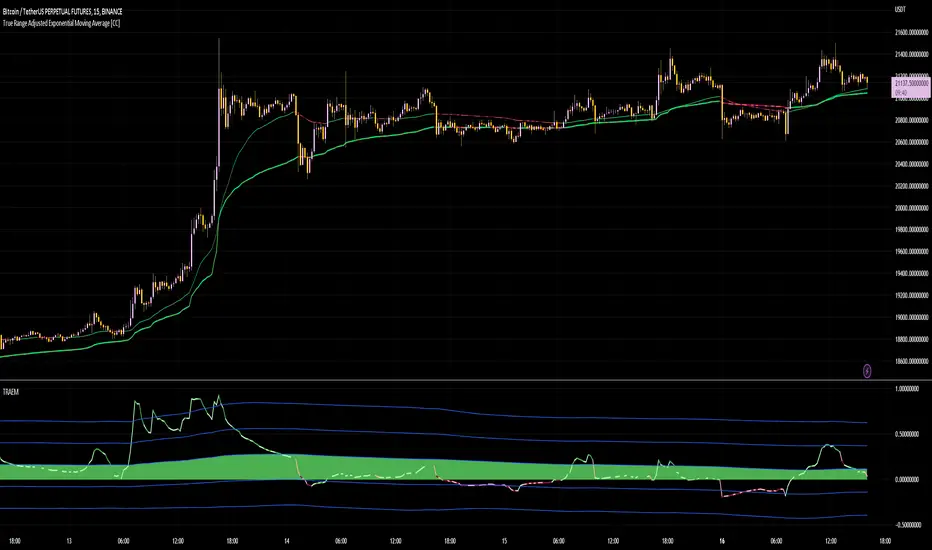
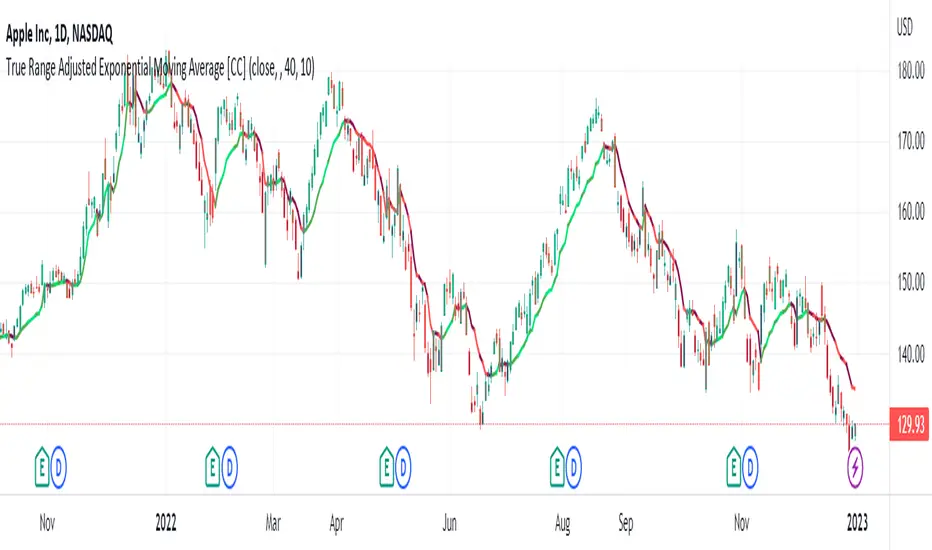
True Range Adjusted Exponential Moving Average [CC]The True Range Adjusted Exponential Moving Average was created by Vitali Apirine (Stocks and Commodities Jan 2023 pgs 22-27) and this is the latest indicator in his EMA variation series. He has been tweaking the traditional EMA formula using various methods and this indicator of course uses the True Range indicator. The way that this indicator works is that it uses a stochastic of the True Range vs its highest and lowest values over a fixed length to create a multiple which increases as the True Range rises to its highest level and decreases as the True Range falls. This in turn will adjust the Ema to rise or fall depending on the underlying True Range. As with all of my indicators, I have color coded it to turn green when it detects a buy signal or turn red when it detects a sell signal. Darker colors mean it is a very strong signal and let me know if you find any settings that work well overall vs the default settings.
Let me know if you would like me to publish any other scripts that you recommend!
Volume Weighted Exponential Moving Average Suite (VWEMA)This is a volume weighted exponential moving average (EMA) script that allows users to customize various parameters to fit their specific needs.
The script includes four different EMA styles: EMA, DEMA, TEMA, and EHMA. Users can choose which style they would like to use by selecting it in the input field. The script also allows users to customize the length of the EMA, with options for both a maximum and minimum length. Users can also choose to use a manual length or to use the dominant cycle within a range as the length.
In addition to these options, the script also includes the ability to turn on or off volume weighting and a daily reset feature that resets the EMA every day. There is also an option to turn on deviation bands, which show the standard deviation of the selected EMA.
Overall, this script offers a wide range of customization options to help users find the best EMA settings for their needs. It is an advanced tool that can be very helpful for traders looking to optimize their EMA strategy.
Cumulative length instead of cycle length
Double EMA Volume Weighted
Triple EMA Volume Weighted
EHMA Volume Weighted
Higher time frame
Deviation Bands
