Trailing Resistance Indicator by KıvanÇ fr3762TRAILING RESISTANCE INDICATOR is a helpful tool for traders to help one of the common problems that they face: where to buy/sell?
by using trailing resistance you can easily decide and see possible upward movements and understand if you are in a safe zone.
Using Trailing Resistance is just simple:
Go long/ Buy when price crosses above the indicator,
Stay on short position if prices are below the indicator.
The indicator is calculated from previous Lows and doesn't the value won't change until prices makes higher lows.
Cerca negli script per "FR3762"

A2MK Mavilim by KıvanÇ fr3762A2MK is a two lined indicator which gives Short and Long signals...
Go long when GREEN line crosses ABOVE YELLOW
Go short when YELLOW line crosses ABOVE GREEN
(the default version of the indicator has the Yellow line although I personally changed the color to Orange to recognise better)
You can change the length of the two lines but creator (@mavilim0732 on twitter ) explained: there's no need to change the YELLOW line's length. (default value=10)
Green line has the length of a default value of 6, you can set it to lower lengths to provide earlier signals but keep in mind that if you do that you'll have more signals
The main feature of A2MK is the few number of false signals.
signals are very reliable when comparing lots of other indicators
creator: @mavilim0732 on twitter
İndikatörü geliştiren: @mavilim0732 on twitter

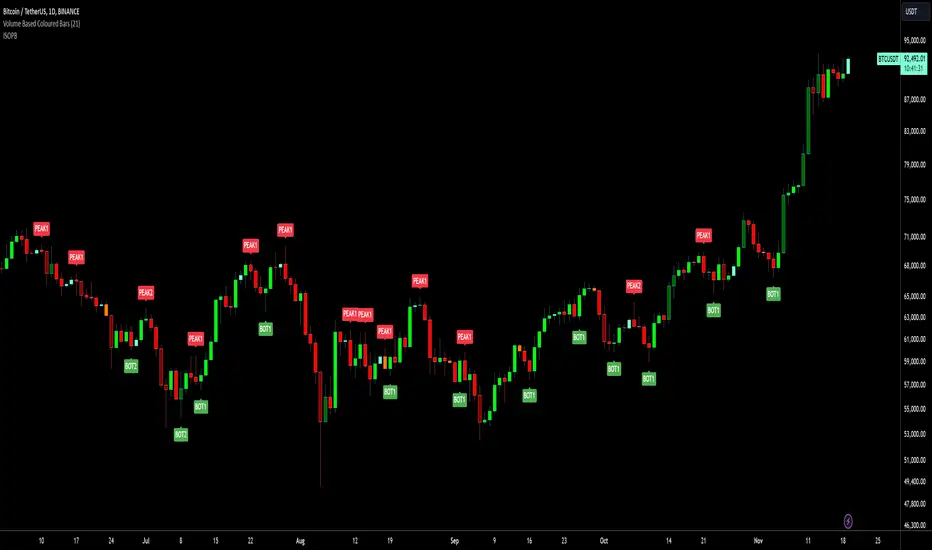
Isolated Peak and Bottom (Tuncer ŞENGÖZ) by KıvanÇ fr3762This Technique is created by Tuncer Şengöz @TuncerSengoz on twitter
An uptrend with higher highs might not make new highs everyday. So how could we define the end of an uptrend? How could we tell the difference between the end of an uptrend and a temporary correction? This isolated high/low technique aims to help us in this kind of situations.
We call the highest point of an uptrend until the particular day “an isolated Peak” and consider the lowest point of the day before as a signal level. If the signal level is broken in 2 days, we assume the uptrend to be over. If it is not broken in 2 days, the uptrend continues. The same technique also applies to a downtrend and the only difference would be the direction.
conversely it has the same logic of finding an end of a downtrend, called "Isolated Bottom" which can be considered the highest point of the day before as a signal level the same way.
The success rate of this technique is quite high (around 85%). There is no required term for this technique and it can be used in yearly, daily or ticker charts, because the market moves in fractals and repeats itself in every scale.
As in every technique, it might also give false signals in some situations like extreme volatility or emotional decisions of masses. However, it will be very helpful for us to indicate the direction of a trend.
Creator: Tuncer ŞENGÖZ @TuncerSengoz on twitter
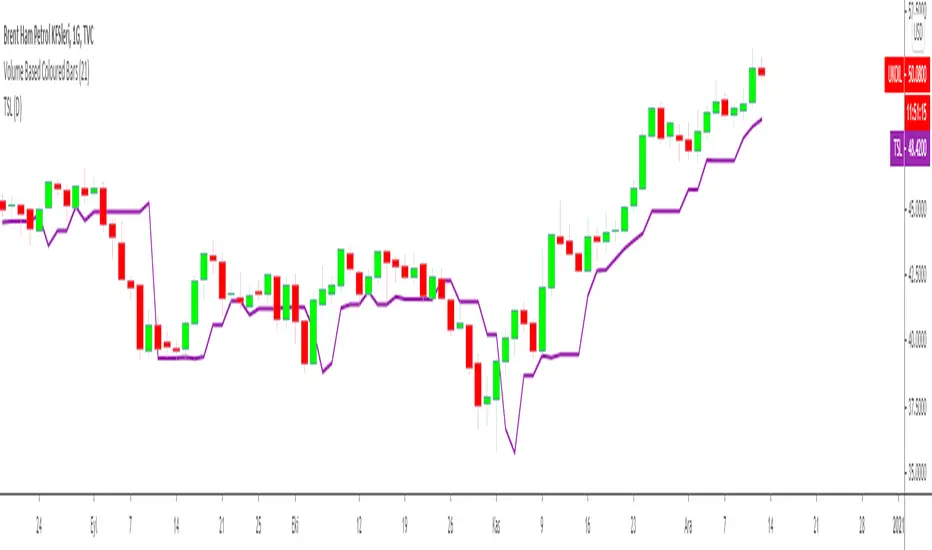
Trailing Stop Loss Indicator by KıvanÇ fr3762TRAILING STOP LOSS INDICATOR is a helpful tool for traders to help one of the greatest problems that they face: where to sell?
by using trailing stop loss you can easily decide and see possible downward movements and understand if you are in a safe zone.
Using Trailing Stop Loss is just simple:
Go short/ Sell when price crosses down the indicator,
Stay on long position if prices are above the indicator.
The indicator is calculated from previous Lows and doesn't the value won't change until prices makes higher lows.
TURKISH EXPLANATION:
İz Süren Stop Loss İndikatörü
Adım 1- bu günün düşük fiyatından geriye doğru, daha düşük fiyatlı bir günle karşılaşıncaya kadar yatay bir çizgi çizin
bu sizin birinci countback’ iniz olacak.
Adım 2- bu yeni düşük günün düşük fiyatından geriye doğru tekrar bir başka düşük güne gelene kadar yatay bir çizgi
çekin. Bu sizin ikinci countback’ iniz olacak.
Adım 3- bu ikinci düşük günün düşüğünden ileri bu günkü tarihe kadar yatay bir çizgi çekin bu sizin talimat
verdiğinizde stop-loss noktanız oluyor.
Kural 1- asla aşağıya doğru stop koymayın. Eğer yeni stop-loss noktanız öncekinden daha düşükse onu atıyorsunuz.
Bu kural asla bozulmamalı.
Kural 2- countback çizginiz üzerindeki aynı düşük fiyata denk gelen günleri yok sayın. İkinci contback çizginizi çekmek
için ilkinden daha düşük bir nokta bulmalısınız. Eğer aynı düşük fiyata sahip bir çubuğa denk gelirseniz daha düşüğünü
buluncaya kadar devam edin. Gerçekten hepsi bu kadar. Bu kuralları uygulayarak stop-loss noktamızı her yeni günün
datası eklendikçe uzatabiliriz.
drive.google.com
TKE INDICATOR by KıvanÇ fr3762TKE INDICATOR is created by Dr Yasar ERDINC (@yerdinc65 on twitter )
It's exactly the arithmetical mean of 7 most commonly used oscillators which are:
RSI
STOCHASTIC
ULTIMATE OSCILLATOR
MFI
WIILIAMS %R
MOMENTUM
CCI
the calculation is simple:
TKE=(RSI+STOCHASTIC+ULTIMATE OSCILLATOR+MFI+WIILIAMS %R+MOMENTUM+CCI)/7
Buy signal: when TKE crosses above 20 value
Oversold region: under 20 value
Overbought region: over 80 value
Another usage of TKE is with its EMA ,
You can add the EMA line of TKE in the settings menu by clicking the "Show EMA Line" button:
the default value is defined as 5 bars of EMA of the TKE line,
Go long: when TKE crosses above EMALine
Go short: when TKE crosses below EMALine

Inverse Fisher Transform COMBO STO+RSI+CCIv2 by KIVANÇ fr3762A combined 3in1 version of pre shared INVERSE FISHER TRANSFORM indicators on RSI , on STOCHASTIC and on CCIv2 to provide space for 2 more indicators for users...
About John EHLERS:
From California, USA, John is a veteran trader. With 35 years trading experience he has seen it all. John has an engineering background that led to his technical approach to trading ignoring fundamental analysis (with one important exception).
John strongly believes in cycles. He’d rather exit a trade when the cycle ends or a new one starts. He uses the MESA principle to make predictions about cycles in the market and trades one hundred percent automatically.
In the show John reveals:
• What is more appropriate than trading individual stocks
• The one thing he relies upon in his approach to the market
• The detail surrounding his unique trading style
• What important thing underpins the market and gives every trader an edge
About INVERSE FISHER TRANSFORM:
The purpose of technical indicators is to help with your timing decisions to buy or
sell. Hopefully, the signals are clear and unequivocal. However, more often than
not your decision to pull the trigger is accompanied by crossing your fingers.
Even if you have placed only a few trades you know the drill.
In this article I will show you a way to make your oscillator-type indicators make
clear black-or-white indication of the time to buy or sell. I will do this by using the
Inverse Fisher Transform to alter the Probability Distribution Function ( PDF ) of
your indicators. In the past12 I have noted that the PDF of price and indicators do
not have a Gaussian, or Normal, probability distribution. A Gaussian PDF is the
familiar bell-shaped curve where the long “tails” mean that wide deviations from
the mean occur with relatively low probability. The Fisher Transform can be
applied to almost any normalized data set to make the resulting PDF nearly
Gaussian, with the result that the turning points are sharply peaked and easy to
identify. The Fisher Transform is defined by the equation
1)
Whereas the Fisher Transform is expansive, the Inverse Fisher Transform is
compressive. The Inverse Fisher Transform is found by solving equation 1 for x
in terms of y. The Inverse Fisher Transform is:
2)
The transfer response of the Inverse Fisher Transform is shown in Figure 1. If
the input falls between –0.5 and +0.5, the output is nearly the same as the input.
For larger absolute values (say, larger than 2), the output is compressed to be no
larger than unity . The result of using the Inverse Fisher Transform is that the
output has a very high probability of being either +1 or –1. This bipolar
probability distribution makes the Inverse Fisher Transform ideal for generating
an indicator that provides clear buy and sell signals.
Creator: John EHLERS
Zero Lag EMA v2 by KIVANÇ fr3762A different version of ZERO LAG EMA indicator by John Ehlers and Ric Way...
In this cover, Zero Lag EMA is calculated without using the PREV function.
The main purpose is that to provide BUY/SELL signals earlier than classical EMA's.
You can see the difference of conventional and Zero Lag EMA in the chart.
The red line is classical EMA and the blue colored line is ZEMA ( Zero Lag Ema ).
Turkish Explanation:
Ehlers ve Way'in ZERO LAG ,ndikatörünün Prev (previous value) kullanılmadan yorumlanarak hesaplanmış hali.
Amaç klasik Üssel Ortalamaya göre daha hızlı tepki verip, Al/Sat sinyallerini daha erken alabilmek.
Grafikte kırmızı renkle görülen normal Üssel HO ve mavi renkli olan Zero Lag (gecikmesiz) Üssel HO

MACDeA different style of MACD indicator with different period values of WEIGHTED and EXPONENTIAL MOVING AVERAGES INSTEAD OF only EXPONENTIAL.
Default MOVING AVERAGES ARE
faster period: 8bars EMA
slower period: 13 bars EMA
signal period: 5 bars WMA
TURKISH EXPLANATION:
MACD indikatörünün sadece üssel yerine AĞIRLIKLI ve ÜSSEL hareketli ortalamalar kullanılarak daha erken sinyaller alabilmek için daha kısa periyotlarla yorumlanması
fikir @kenyaborsa on twitter
yazar: KIVANÇ @fr3762 on twitter

AWESOME OSCILLATOR V2 by KIVANCfr3762AWESOME OSCILLATOR V2 by KIVANC @fr3762
CONVERTING THE OSCILLATOR to a curved line and added a 7 period SMA as a signal line,
crosses are BUY or SELL signals like in MACD
Buy: when AO line crosses above signal line
Sell: when Signal line crosses above AO line
AP IFTCCIv2/IFTStoch/IFTRSI Multi-TimeframeMulti-Timeframe IFT-CCI/Stoch/RSI Composite
This enhanced indicator combines three powerful oscillators—Inverse Fisher Transform (IFT) versions of the Commodity Channel Index (CCI), Stochastic, and Relative Strength Index (RSI)—into a unified multi-timeframe analysis tool. Originally developed by John Ehlers (pioneer of cyclical analysis and signal processing in trading systems) and adapted by KIVANC (@fr3762), this version adds dual-timeframe capability to compare indicator values across different chart resolutions.
Key Features:
Triple Oscillator Composite
IFT-CCI: Smoothed CCI values transformed via Ehlers' Inverse Fisher Transform (blue-gold)
IFT-Stochastic: Classic stochastic oscillator processed through IFT (blue)
IFT-RSI: RSI oscillator converted to IFT format (magenta)
Composite Average Line: Combined average of all three indicators (green)
Multi-Timeframe Analysis
Compare primary and secondary timeframes (e.g., 1H vs. 4H, daily vs. weekly)
Primary timeframe plots use solid lines with 80% opacity
Secondary timeframe (optional) uses dashed/circle markers with 40% opacity
Key Levels
Overbought (+0.75) and oversold (-0.75) reference lines
Zero-centerline for momentum direction bias
Applications:
Trend Confirmation: Align higher timeframe signals with lower timeframe entries
Divergence Detection: Spot inter-timeframe discrepancies in momentum
Regime Filter: Use higher timeframe composite values to filter trades
Technical Basis:
Inverse Fisher Transform: Compresses oscillator values into bounded (-1 to +1) range while emphasizing extreme moves
Dual WMA Smoothing: Combines initial calculation smoothing (WMA1) with final output smoothing (WMA2)
Exponential Scaling: (e^2x - 1)/(e^2x + 1) formula converts Gaussian-like distributions to bounded outputs
Credits:
Original Concept: John Ehlers (IFT methodology, cyclical analysis foundations)
Initial Implementation: KIVANC (@fr3762 on Twitter) for the base IFT-CCI/Stoch/RSI script
Multi-Timeframe Adaptation: for cross-resolution analysis capabilities
This tool is particularly effective for traders seeking to align multiple timeframes while using Ehlers' noise-reduction techniques. The composite average line provides a consensus view, while the individual oscillators help identify component strength/weakness.

Hareketli Ortalama COMBO + PLUSIn addition to author KıvanÇ @fr3762 "Hareketli Ortalama COMBO" script, I have added 4 more lines to to guess for future market direction.
Lines below are moving averages 10. 22, 35
///MOVING AVERAGE
length5 = input(10, "Ema Length5")
plot(ema(src, length5), color=purple, linewidth=2, title="MOV5")
//MOVING AVERAGE
length6 = input(22, "Ema Length6")
plot(ema(src, length6), color=green, linewidth=2, title="MOV6")
//MOVING AVERAGE
length7 = input(35, "Ema Length7")
plot(ema(src, length7), color=lime, linewidth=2, title="MOV7")
Line below is RSI MOVING AVERAGE
length8 = input(100, "RSI MA Length8")
plot(rma(src, length8), color=aqua, linewidth=2, title="MOV8")
Kıvanç @fr3762 "Hareketli Ortalama COMBO" suna ek olarak 4 farklı hareketli ortalama daha ekledim.
Hareketli ortalamalar, 5 , 6 , 7 değer olarak sırası ile 10, 22 ve 35
RSI hareketli ortalama olarak ise 100 değeri aldım 8. satırda

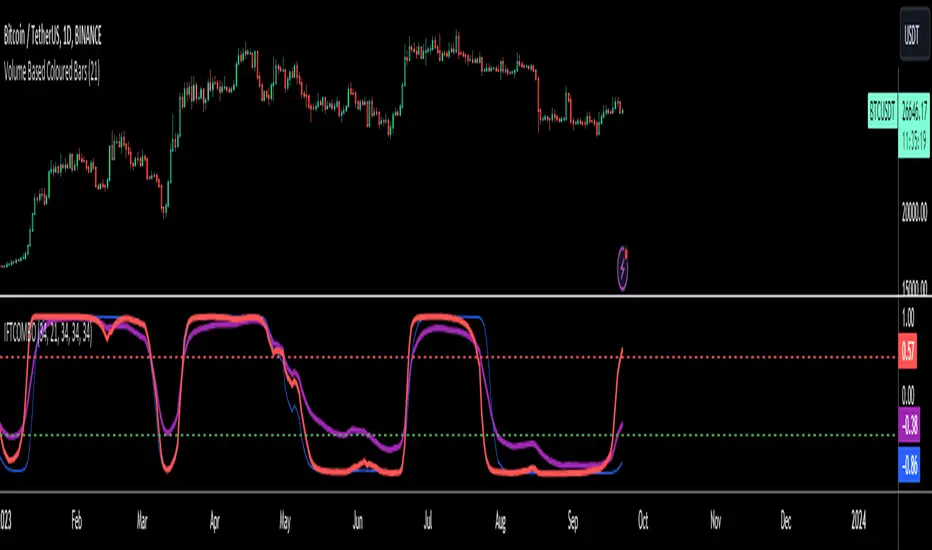
Inverse Fisher Transform COMBOThis indicator is the one scripted and published by KIVANCfr3762 (fr3762 @twitter), only difference is the IFT Stochastic Momentum line to be added and also included for average IFT line calculation. Both IFT CCI and IFT CCI V2 lines are included within this script. With the options/settings menu, the lines can be added/removed for displaying on the chart up to preferences.
İndikatör , Kıvanç ( KIVANCfr3762 (fr3762 @twitter) ) hocamızın daha önceden yayınladığı indikatördür, Buna, IFT Stochastic Momentumu ekledim, ve tabi bu hesaplamayı ortalama IFT çizgisi hesabına da dahil ettim. IFT CCI ve IFT CCI V2 iki çizgi de ayrı ayrı indikatörün içinde bulunmaktadır. İstenilenler ayarlar kısmındaki kutucuklardan işaretlenerek/kaldırılarak grafiğin üzerinde gösterimi sağlanabilir.

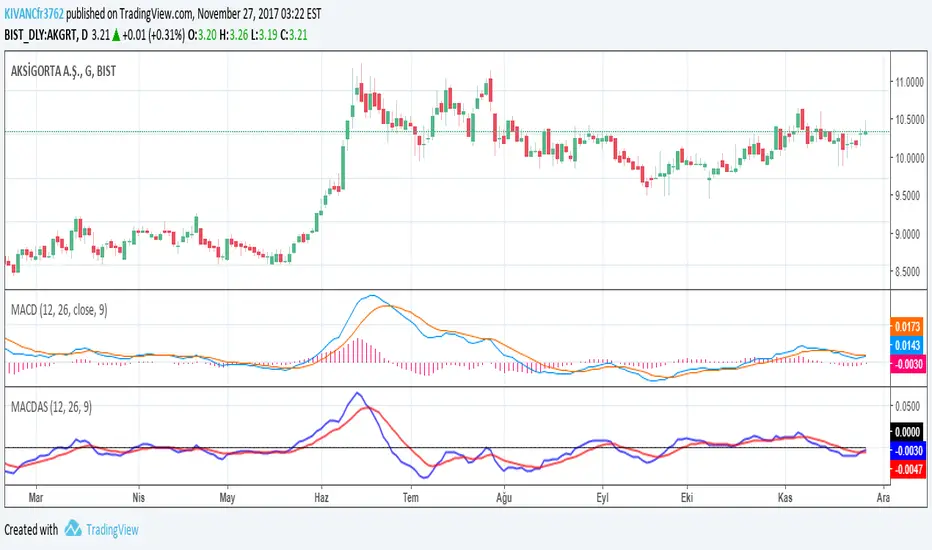
MACDASTHOMAS ASPRAY'S MACD by KIVANC @fr3762 on twitter
drive.google.com
This indicator is simply based on MACD HISTOGRAM'S 9 period EMA signal line
MACDAS = MACD HISTOGRAM= MACD - SIGNAL LINE of MACD
MACDAS SIGNAL LINE = 9 Period EMA of MACD
Note: Macd is originally calculated by using SMA but in this version both MACD and MACDAS and their signal lines are calculated by using EMA.
MACDAS provides earlier BUY / SELL signals than MACD.
TURKISH EXPLANATION:
Thomas Aspray'in bulduğu KIVANC @fr3762 tarafından yazılan versiyon
MACDnin Triggerı ile farkı (Histogram) ile bu farkın 9 günlük üssel hareketli ortalaması alınarak hesaplanmıştır
drive.google.com
Macd indikatörüne göre daha erken AL / SAT sinyalleri üretmektedir.
Kazançlı günlerde kullanmanız dileğiyle...
KıvanÇ
Follow LineFollow Line is a common MT4 FX indicator based on trend following.
The main idea behind the calculation is volatility:
-Indicator Line increases as price goes above Bollinger Bands but with 1 standard deviation.
-Likewise when price moves below the lower Bollinger Band with 1 Standard deviation, Follow -Line decreases down.
-As you can imagine, indicator stays as a flat line when price moves between the bands.
There are two critical settings about the indicator:
1- Bollinger Bands Deviation is set to 1 as default but if you want to have early signals you have to decrease that amount. Also you'd better increase that to have flat values on sideways market conditions for not getting chopped by the early but false signals.
2- ATR Filter is activated in default settings and the indicator follows the trend with a distance from Highs and Lows considering ATR (default length 5) values. If you turn off the ATR filter, the indicator line only takes into account the Highs and the Lows. Indicator will get more agile but the risk of choppy signals can be taken that time. I personally advise you to increase the Bollinger Band Deviation from 1 to between 1.5-2 to stabilize the fake signals when ATR filter is turned off.
Signals can be shown on the graph:
BUY: when Follow Line changes direction from red to blue.(which means Price is above Bollinger Upper Band with 1 standard deviation)
SELL: when Follow Line changes direction from blue to red. (which means Price moves below Bollinger Lower Band with 1 standard deviation)
Finally, some of you may know there are also several Follow Line indicators on TradingView but unfortunately they don't show the same exact values (close but not same) comparing with original version of MT4 and the Metastock version that I've coded recently. So, I shared this stuff to have the exact same values on graphs on all platforms.

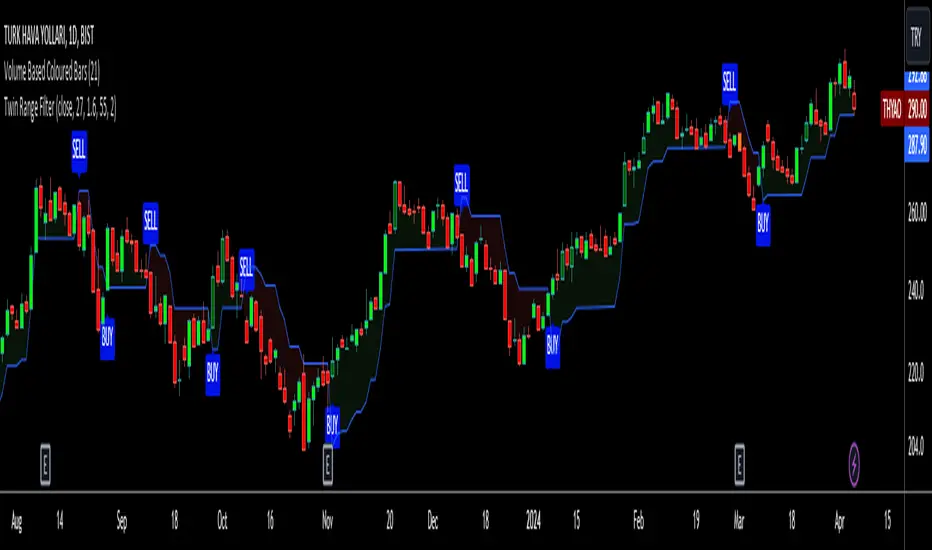
Twin Range Filter VisualizedVisulaized version of @colinmck's Twin Range Filter version on TradingView.
On @colinmck's Twin Range Filter version, you can only see Long and Short signals on the chart.
But in this version of TRF, users can visually see the BUY and SELL signals on the chart with an added line of TRF.
TRF is an average of two smoothed Exponential Moving Averages, fast one has 27 bars of length and the slow one has 55 bars.
The purpose is to obtain two ranges that price fluctuates between (upper and lower range) and have LONG AND SHORT SIGNALS when close price crosses above the upper range and conversely crosses below lower range.
I personally combine the upper and lower ranges on one line to see the long and short signals with my own eyes so,
-BUY when price is higher or equal to the upper range level and the indicator line turns to draw the lower range to follow the price just under the bars as a trailing stop loss indicator like SuperTrend.
-SELL when price is lower or equal to the lower range levelline under the bars and then the indicator line turns to draw the upper range to follow the price just over the bars in that same trailing stop loss logic.
There are also two coefficients that adjusts the trailing line distance levels from the price multiplying the effect of the faster and slower moving averages.
The default values of the multipliers:
Fast range multiplier of Fast Moving Average(27): 1.6
Slow range multiplier of fSlow Moving Average(55): 2
Remember that if you enlarge these multipliers you will enlarge the ranges and have less but lagging signals. Conversely, decreasing the multipliers will have small ranges (line will get closer to the price and more signals will occur)
Bollinger OTT SpreadBollinger OTT Spread (BOOTS) is a development combining Bollinger Bands with Optimized Trend Tracker (OTT) Indicator by Anıl Özekşi.
Bollinger Bands have originally 3 lines: Simple Moving Average (Middle Line), Upper Band and Lower Band.
BOOTS concentrates on the upper and lower Bollinger band lines.
First, it calculates the OTT using the UPPER and LOWER Bollinger Bands in a period of time (default lengths are 2) instead of closing prices.
After that, Upper and lower bands have more constant values.
There are 2 lines in BOOTS:
-The top (cyan) line is originally an OTT of the Upper Bollinger Band. (BOOTShigh)
-The bottom line (purple) is also an OTT line but conversely uses Lower Bollinger Band in the same period. (BOOTSlow)
Default values:
Bollinger Bands Moving AveragePeriod: 2 Bars
OTT Length: 2 Bars
OTT Optimizing coefficient (percent): %10
Bollinger Bands Standart Deviation Multiplier: 2 (not adjustable)
These values are designed for daily time frame, so they have to be optimized in other timeframes by the user. (Ex: Higher values can be considered in lower time frames)
Originally, Bollinger Bands used a Simple Moving Average in their calculation, but this time, Anıl Özekşi prefers VIDYA (Variable Dynamic Moving Average = VAR) instead of a Simple Moving Average.
Bollinger Bands cannot create significant BUY & SELL signals considering their original logic, but the primary purpose of BOOTS is to have substantial trading signals:
BUY when the price crosses above the BOOTSLower line (purple line)
STOP when the price crosses back below the BOOTSLower line (purple line)
SELL when the price crosses below the BOOTSUpper line (cyan line)
STOP when the price crosses back above the BOOTSUpper line (cyan line)
The price zone between the two lines is the flat zone; traders don't consider taking new positions in that area between the two lines.
Developer Anıl Özekşi advises that traders may have more accurate signals when using a short-period moving average instead of closing prices. So, I added a moving average with the same default length of 2 , which was used in Bollinger Bands calculation. You can check the "SHOW MOVING AVERAGE?" box on the settings tab of the indicator.

Multiple OTTMultiple OTT (MOTT) is a development on the Optimized Trend Tracker (OTT) indicator of Anıl Özekşi that is shared in his algorithmic trading courses by himself.
There are 5 lines in MOTT:
-The top (cyan) line is originally an OTT line, which uses the Highest price values in a default length of 80 bars in its calculation.
-The bottom line (purple) is also an OTT line but conversely uses the Lowest prices in the same period.
-The dotted third line in the middle (green) is the exact average of the top and bottom lines.
-The dotted Cyan line: (Top+Middle)/2 and
dotted Purple line: (Bottom+Middle)/2 are also the averages of their two neighbors.
Default values:
Length of the Highest and Lowest Price period (High & Low Period): 80
OTT optimizing percent: 1.4
OTT Length: 2 (Also Moving Average Length when displayed)
Default Moving Average Type of OTT Calculation: VIDYA(VAR) VARIABLE INDEX DYNAMIC MOVING AVERAGE
These values are designed for daily time frame, so they have to be optimized in other timeframes by the user. (Ex: Higher values can be considered in lower time frames)
BUY when the price crosses above the MOTT lines.
STOP when the price crosses back below the same MOTT line.
SELL when the price crosses below the MOTT lines.
STOP when the price crosses back above the same MOTT line.
As you can see, every line can be considered a trade signal like Fibonacci Levels. If optimized meaningfully, lines can also show users significant support and resistance levels. Traders can use those levels in partial buys and sells.
Developer Anıl Özekşi advises that traders may have more accurate signals when using a short-period moving average instead of closing prices. So, I added the VIDYA moving average with the same default length ( 2 ) used in OTT calculation. You can check the "SHOW MOVING AVERAGE?" box on the settings tab of the indicator.

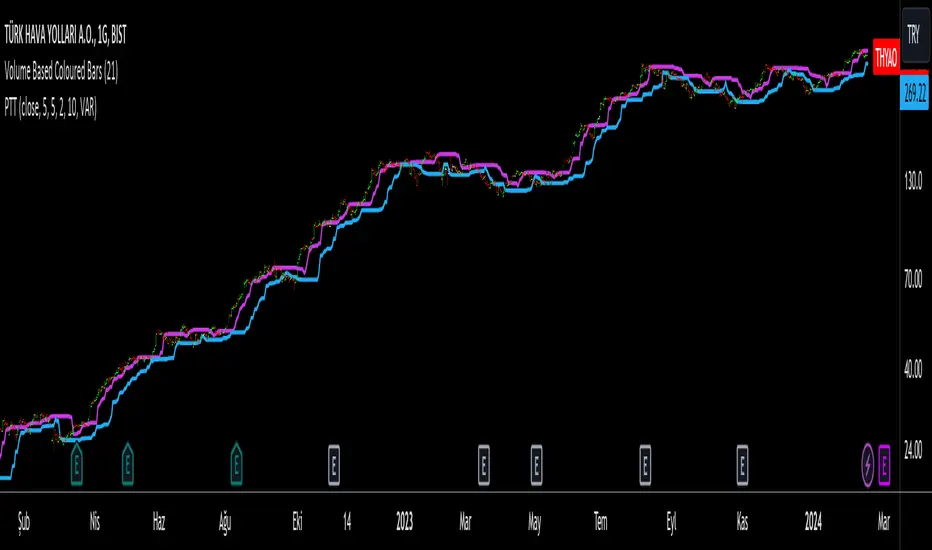
Progressive Trend TrackerProgressive Trend Tracker (PTT) is a development combining Bollinger Bands with Highest Highs and Lowest Lows by K.Hasan Alpay & Anıl Özekşi.
Bollinger Bands have originally 3 lines: Simple Moving Average (Middle Line), Upper Band and Lower Band.
PTT concentrates on the upper and lower Bollinger band lines.
First, it calculates the bands using the Highest & Lowest prices in a period of time (Faster period and period) instead of closing prices.
Then, PTT takes the lowest values of the calculated upper band and, conversely, the highest values of the calculated lower band in a Slower period.
Default values:
Faster Period: 5
Period: 5
Bollinger Band Moving Average Period: 2
Slower Period: 10
These values are designed for daily time frame, so they have to be optimized in other timeframes by the user. (Ex: Higher values can be considered in lower time frames)
One more significant difference considering original Bollinger Bands is that PTT uses VIDYA (Variable Dynamic Moving Average = VAR) in the calculation instead of a Simple Moving Average.
Bollinger Bands cannot create significant BUY & SELL signals considering their original logic, but the primary purpose of PTT is to have substantial trading signals:
BUY when the price crosses above the PTT Lower line (cyan line)
STOP when the price crosses back below the PTT Lower line (cyan line)
SELL when the price crosses below the PTT Upper line (cyan line)
STOP when the price crosses back above the PTT Upper line (cyan line)
Developer Anıl Özekşi advises that traders may have more accurate signals when using a short-period moving average instead of closing prices, so I added the VIDYA moving average with the same default length ( 2 ), which is used in Bollinger Bands calculation. You can check the "SHOW MOVING AVERAGE?" box on the settings tab of the indicator.
Auto Fibo on IndicatorsThis drawing tool aims to draw auto Fibonacci Retracement Levels on desired indicators.
Users can define the target indicator to draw Auto Fibo Lines, from the "settings tab":
There are six commonly used indicators below the charts that can be selected to draw Fibonacci Retracement lines on:
RSI : Relative Strength Index
CCI : Commodity Channel Index
MFI : Money Flow Index
STOCHASTIC : Stochastic Oscillator
CMF : Chaikin Money Flow
CMO : Chande Momentum Oscillator
Fibonacci Retracement Levels will appear automatically after applying the indicator.
The "Auto Fibo on Indicators" tool looks back. It checks the indicator levels for a desired number of bars and then draws the Fibonacci Levels automatically in the right way, considering the final movements of the indicator.
There are five commonly used Fibonacci Levels added between the Highest and Lowest values such as:
%23.6
%38.2
%50 (Not precisely a Fibonacci Level, indeed)
%61.8 (Golden Ratio)
%78.6
Four extra levels can be added from the settings tab by checking their boxes:
%127.2 (adjustable level)
%161.8
%261.8
%361.8
Default lookback bars of Auto Fibo Levels: 144 (which is also a Fibonacci number)
Default Indicator: RSI
Default Indicator length: 14
Default data source: CLOSE
Users can also define and show overbought and oversold levels by unchecking the "Do not Show Indicator Overbought / Oversold Levels?" button from the settings menu.
In technical analysis, Fibonacci Levels on price can guide valuable trading signals for investors.
Levels can be significant support and resistance levels for breakouts and turning points.
This drawing tool aims to follow those necessary levels on indicators to observe critical levels and breakouts.

MOST + Moving Average ScreenerScreener version of Anıl Özekşi's Moving Stop Loss (MOST) Indicator:
USERS MAY SCREEN MOST WITH 11 DIFFERENT TYPES OF MOVING AVERAGES + THEY CAN ALSO SCREEN SIGNALS WITH THAT 11 MOVING AVERAGES INSTEAD OF USING MOST LINE.
Adjustable Moving Average Types:
SMA : Simple Moving Average
EMA : Exponential Moving Average
WMA : Weighted Moving Average
DEMA : Double Exponential Moving Average
TMA : Triangular Moving Average
VAR : Variable Index Dynamic Moving Average aka VIDYA
WWMA : Welles Wilder's Moving Average
ZLEMA : Zero Lag Exponential Moving Average
TSF : True Strength Force
HULL : Hull Moving Average
TILL : Tillson T3 Moving Average
About Screener Panel:
Users can explore 20 different and user-defined tickers, which can be changed from the SETTINGS (shares, crypto, commodities...) on this screener version.
The screener panel shows up right after the bars on the right side of the chart.
-In this screener version of MOST, users can define the number of demanded tickers (symbols) from 1 to 20 by checking the relevant boxes on the settings tab.
-All selected tickers can be screened in different timeframes.
-Also, different timeframes of the same Ticker can be screened.
IMPORTANT NOTICE:
Screener shows the results in 3 different logic:
1st LOGIC (Default Settings):
BUY AND SELL SIGNALS of MOST and MOVING AVERAGE LINE
Most Buy Signal: Moving Average Crosses ABOVE the MOST LINE
Most Sel Signal: Moving Average Crosses BELOW the MOST LINE
Tickers seen in green are the ones that are in an uptrend, according to MOST.
The ones that appear in red are those in the SELL signal, in a downtrend.
The numbers before each Ticker indicate how many bars passed after MOST's last BUY or SELL signal.
For example, according to the indicator, when BTCUSDT appears (3) in GREEN, Bitcoin switched to a BUY signal 3 bars ago.
2nd LOGIC (Moving Average & Price Flips Screener Mode):
This mode can only be activated by checking the 'Activate Moving Average Screening Mode' box on the settings menu.
MOST line will be disappeared after checking the box.
Buy Signal: When the Selected Price crosses ABOVE the selected Moving Average.
Sell Signal: When the Selected Price crosses BELOW the selected Moving Average.
Tickers seen in green are the ones that are in an uptrend, according to Moving Average & Price Flips.
The ones that appear in red are those in the SELL signal, in a downtrend.
The numbers before each Ticker indicate how many bars passed after the last BUY or SELL signal of Moving Average & Price Flips.
For example, according to the indicator, when BTCUSDT appears (3) in GREEN, Bitcoin switched to a BUY signal 3 bars ago.
3rd LOGIC (Moving Average Color Change Screener Mode):
Both 'Activate Moving Average Screening Mode' and 'Activate Moving Average Color Change Screening Mode' boxes must be checked in the settings tab.
Moving Average Line will turn out into two colors.
Green color means the moving average value is greater than the previous bar's value.
Red color means the moving average value is smaller than the previous bar's value.
Buy Signal: After the Selected Moving Average turns GREEN from red.
Sell Signal: After the Selected Moving Average turns RED from green.
-Screener shows the information about the color changes of the selected Moving Average with default settings.
If this option is preferred, users are advised to enlarge the length to have better signals.
Tickers seen in green are the ones that are in an uptrend, according to Moving Average Color.
The ones that appear in red are those in the SELL signal, in a downtrend.
The numbers before each Ticker indicate how many bars passed after the last BUY or SELL signal of Moving Average Color Change.
For example, according to the indicator, when BTCUSDT appears (3) in GREEN, Bitcoin switched to a BUY signal 3 bars ago.

Tillson T3 Moving Average - ScreenerScreener version of Tillson T3 Moving Average:
The T3 Moving Average generally produces entry signals similar to other moving averages and, thus, is mainly traded in the same manner. Here are several assumptions:
Suppose the price action is above the T3 Moving Average, and the indicator is upward. In that case, we have a bullish trend and should only enter long trades (advisable for novice/intermediate traders). If the price is below the T3 Moving Average and edging lower, we have a bearish trend and should limit entries to short.
About Screener Panel:
Users can explore 20 different and user-defined tickers, which can be changed from the SETTINGS (shares, crypto, commodities...) on this screener version.
The screener panel shows up right after the bars on the right side of the chart.
Tickers seen in green are the ones that are in an uptrend, according to T3.
The ones that appear in red are those in the SELL signal, in a downtrend.
The numbers in front of each Ticker indicate how many bars passed after the last BUY or SELL signal of T3.
For example, according to the indicator, when BTCUSDT appears (3) in GREEN, Bitcoin switched to a BUY signal 3 bars ago.
-In this screener version of Tillson T3 Moving Average, users can define the number of demanded tickers (symbols) from 1 to 20 by checking the relevant boxes on the settings tab.
-All selected tickers can be screened in different timeframes.
-Also, different timeframes of the same Ticker can be screened.
IMPORTANT NOTICE:
Screener shows the results in 2 different logic:
-Screener shows the information about the color changes of the T3 Moving Average with default settings.
-Users can check the "Change Screener to show T3 & Price Flips" button to activate the screener giving information about price flips.
If this option is preferred, users are advised to enlarge the length to have better signals.

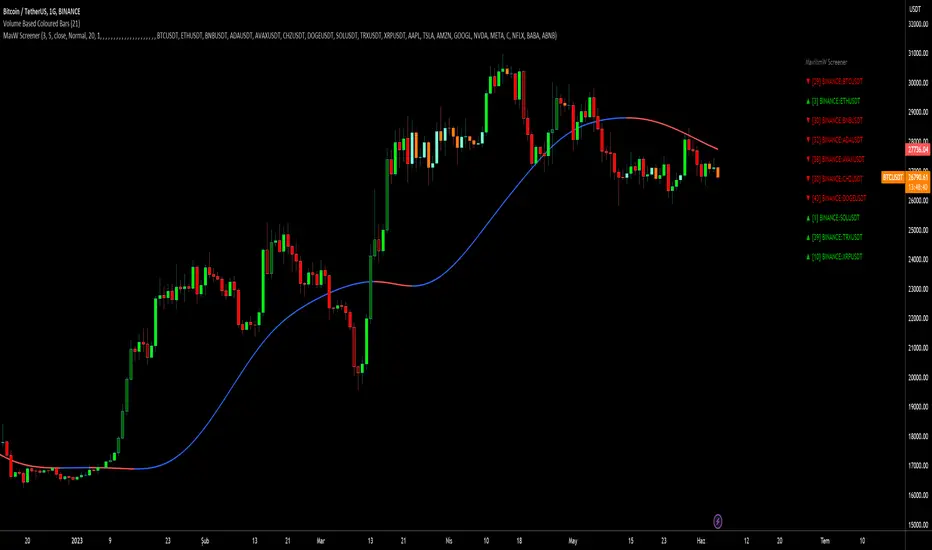
MavilimW ScreenerScreener version of MavilimW Moving Average :
Short-Term Examples (by decreasing 3 and 5 default values to have trading signals from color changes)
BUY when MavilimW turns blue from red.
SELL when MavW turns red from blue.
Long-Term Examples (with Default values 3 and 5)
BUY when the price crosses over the MavilimW line
SELL when the price crosses below the MavW line
MavilimW can also define significant SUPPORT and RESISTANCE levels in every period with its default values 3 and 5.
Screener Panel:
You can explore 20 different and user-defined tickers, which can be changed from the SETTINGS (shares, crypto, commodities...) on this screener version.
The screener panel shows up right after the bars on the right side of the chart.
Tickers seen in green are the ones that are in an uptrend, according to MavilimW.
The ones that appear in red are those in the SELL signal, in a downtrend.
The numbers in front of each Ticker indicate how many bars passed after the last BUY or SELL signal of MavW.
For example, according to the indicator, when BTCUSDT appears (3) in GREEN, Bitcoin switched to a BUY signal 3 bars ago.
-In this screener version of MavilimW, users can define the number of demanded tickers (symbols) from 1 to 20 by checking the relevant boxes on the settings tab.
-All selected tickers can be screened in different timeframes.
-Also, different timeframes of the same Ticker can be screened.
IMPORTANT NOTICE:
-Screener shows the information about the color changes of MavilimW Moving Average with default settings (as explained in the Short-Term Example section).
-Users can check the "Change Screener to show MavilimW & Price Flips" button to activate the screener as explained in the Short-Term Example section. Then the screener will give information about price flips.
AlphaTrend - ScreenerScreener version of AlphaTrend indicator:
BUY / LONG when AlphaTrend line crosses above its 2 bars offsetted line, and there would be a green filling between them
SELL / SHORT when AlphaTrend line crosses below its 2 bars offsetted line, and filling would be red then.
Default values:
Coefficient: 1, which is the factor of the trailing ATR value
Common Period: 14, which is the length of ATR MFI and RSI
AlphaTrend default uses MFI in the calculation, and MFI (Money Flow Index) needs the volume data of the chart.
If your chart doesn't have the volume data, please select the "Change Calculation" option to use RSI instead of MFI.
Screener Panel:
You can explore 20 different and user-defined tickers, which can be changed from the SETTINGS (shares, crypto, commodities...) on this screener version.
The screener panel shows up right after the bars on the right side of the chart.
Tickers seen in green are the ones that are in an uptrend, according to AlphaTrend.
The ones that appear in red are those in the SELL signal, in a downtrend.
The numbers in front of each Ticker indicate how many bars passed after the last BUY or SELL signal of AlphaTrend.
For example, according to the indicator, when BTCUSDT appears in (3) and in GREEN, Bitcoin switched to BUY signal 3 bars ago.
