AlphaTrend StrategyThe strategy version of AlphaTrend indicator for backtesting and optimisation purposes for TradingView users:
Screener / Explorer version and an English explantion video will be published soon...
AlphaTrend's parameters are designed for daily and 4H charts, feel free to optimize on all time frames.
Hope you all use Alphatrend in your profitable trades.
Kıvanç
Cerca negli script per "FR3762"

AlphaTrendAlphaTrend is a brand new indicator which I've personally derived from Trend Magic and still developing:
In Magic Trend we had some problems, Alpha Trend tries to solve those problems such as:
1-To minimize stop losses and overcome sideways market conditions.
2-To have more accurate BUY/SELL signals during trending market conditions.
3- To have significant support and resistance levels.
4- To bring together indicators from different categories that are compatible with each other and make a meaningful combination regarding momentum, trend, volatility, volume and trailing stop loss.
according to those purposes Alpha Trend:
1- Acts like a dead indicator like its ancestor Magic Trendin sideways market conditions and doesn't give many false signals.
2- With another line with 2 bars offsetted off the original one Alpha Trend have BUY and SELL signals from their crossovers.
BUY / LONG when Alpha Trend line crosses above its 2 bars offsetted line and there would be a green filling between them
SELL / SHORT when Alpha Trend line crosses below its 2 bars offsetted line and filling would be red then.
3- Alpha Trend lines
-act as support levels when an uptrend occurs trailing 1*ATR (default coefficient) distance from bar's low values
-conversely act as resistancelevels when a downtrend occurs trailing 1*ATR (default coefficient) distance from bar's high values
and acting as trailing stop losses
the more Alpha Trend lines straighter the more supports and resistances become stronger.
4- Trend Magic has CCI in calculation
Alpha Trend has MFI as momentum, but when there's no volume data MFI has 0 values, so there's abutton to change calculation considering RSI after checking the relevant box to overcome this problem when there is no volume data in that chart.
Momentum: RSI and MFI
Trend: Magic Trend
Volatility: ATR,
Trailing STOP: ATR TRAILING STOP
Volume: MFI
Alpha trend is really a combination of different types...
default values:
coefficient: 1 which is the factor of trailing ATR value
common period: 14 which is the length of ATR MFI and RSI
Wish you all use AlphaTrend in profitable trades.
Kıvanç Özbilgiç

Optimized Trend Tracker Oscillator OTTOOTTO - Optimized Trend Tracker Oscillator is a derivative of Anıl Özekşi's OTT - Optimized Trend Tracker:
It is more sensitive to price movements when compared to its ancestor OTT.
There are 2 more parameters of VIDYA moving average lengths FAST and SLOW.
Fast VIDYA has length of 10 bars and Slow VIDYA has 25.
Correction Constant is a crucial parameter to make the calculation more stable.
you can use 1000 to 100000000 by the powers of ten to obtain more accurate graphic values.
Buy and Sell signals make indicator more meaningful.

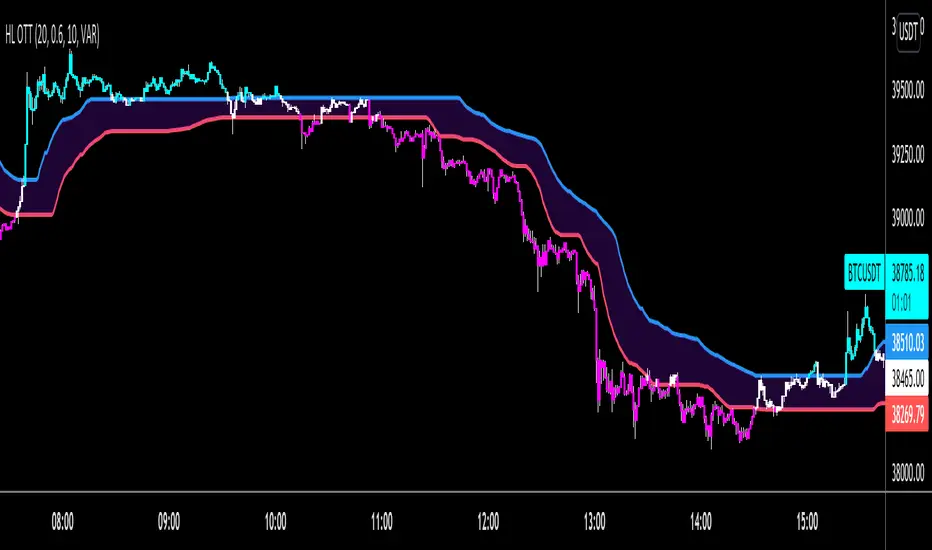
HIGH and LOW Optimized Trend Tracker HOTT LOTTAnıl Özekşi's latest development on his precious OTT - Optimized Trend Tracker:
In this version, there are two lines of OTT which are derived from HIGHEST price values (HOTT) and LOVEST price values (LOTT) which were originally sourced to CLOSE values on default OTT.
Another significant difference is there is no Support Line (Moving Average) in this version.
The area between HOTT and LOTT is FLAT ZONE which developer advises to do nothing.
Bars will be highlighted to Turquoise when candles close over HOTT, means an UPTREND SIGNAL
and to Fuchia when candles begin closing under LOTT line to indicate a DOWNTREND SIGNAL.
FLAT ZONE is highlighted also to have the maximum concentration on sideways market conditions.
There are three quantitative parameters in this indicator:
The first parameter in the OTT indicator set by the two parameters is the period/length.
OTT lines will be much sensitive to trend movements if it is smaller.
And vice versa, will be less sensitive when it is longer.
As the period increases it will become less sensitive to little trends and price actions.
In this way, your choice of period, will be closely related to which of the sort of trends you are interested in.
The OTT percent parameter in OTT is an optimization coefficient. Just like in the period
small values are better at capturing short term fluctuations, while large values
will be more suitable for long-term trends.
The final adjustable quantitative parameter is HIGHEST and LOWEST length which is the source of calculations.
Anıl Özekşi generally works on 1 minute charts so I personally advise traders to optimize parameters to have more accurate signals. Just concentrate on FLAT price zones and indicator will do the rest in trends.
Built in Moving Average type defaultly set as VAR but users can choose from 10 different Moving Average types like:
SMA : Simple Moving Average
EMA : Exponential Moving Average
DEMA : Double Exponential Moving Average
WMA : Weighted Moving Average
TMA : Triangular Moving Average
VAR : Variable Index Dynamic Moving Average a.k.a. VIDYA
WWMA : Welles Wilder's Moving Average
ZLEMA : Zero Lag Exponential Moving Average
TSF : True Strength Force
HULL : Hull Moving Average
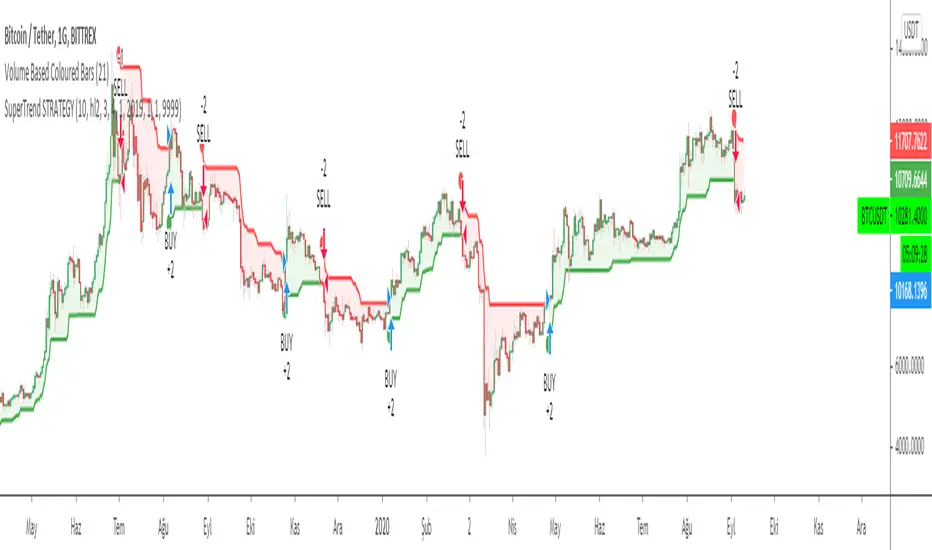
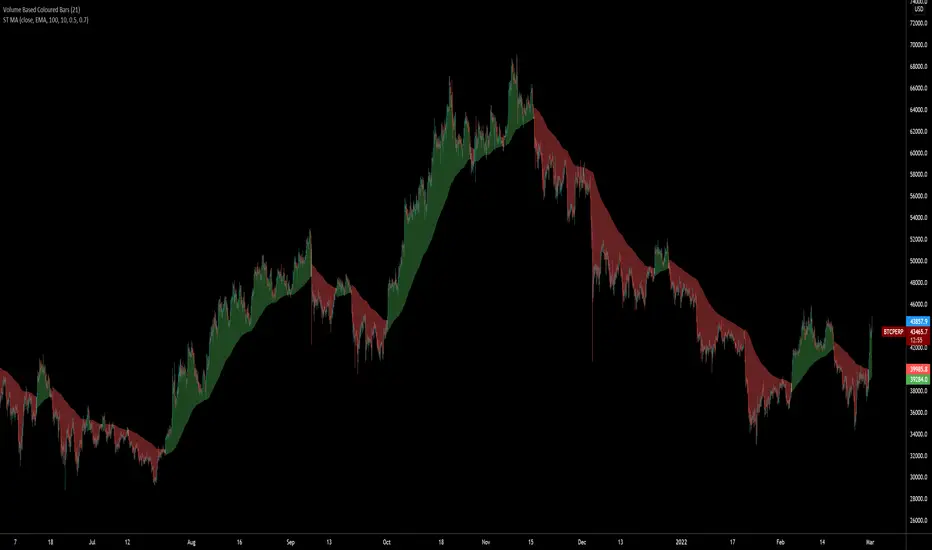
SuperTrended Moving AveragesA different approach to SuperTrend:
adding 100 periods Exponential Moving Average in calculation of SuperTrend and also 0.5 ATR Multiplier to have a clear view of the ongoing trend and also provides significant Supports and Resistances.
Default Moving Average type set as EMA (Exponential Moving Average) but users can choose from 11 different Moving Average types as:
SMA : Simple Moving Average
EMA : Exponential Moving Average
WMA : Weighted Moving Average
DEMA : Double Exponential Moving Average
TMA : Triangular Moving Average
VAR : Variable Index Dynamic Moving Average a.k.a. VIDYA
WWMA : Welles Wilder's Moving Average
ZLEMA : Zero Lag Exponential Moving Average
TSF : True Strength Force
HULL : Hull Moving Average
TILL : Tillson T3 Moving Average
Credits going to @CryptoErge for sharing his development to public.
Elevated Leverage index System - ELiSELEVATED LEVERAGE index SYSTEM (ELiS) tries to solve the problem of adjusting meaningful leverage in futures and margin trading.
The biggest problem for traders is adjusting the leverage level manually.
Concerning about the volatilities it's very hard to set a meaningful leverage level.
ELiS includes 4 different volatility component which are:
1- nATR: Normalized Average True Range which is actually ATR/price to stabilize ATR's value differences when price changes are high on long term periods.
2- Standard Deviation
3- Kairi based nATR
4- Bollinger %B
which are scaled from 0 to 100 and takes different averages with different combinations & ratios and combines them as an index.
This index calculates an average volatility to set the true leverage level when trading futures especially in Crypto and FX markets.
There are 5 risk levels of "GEARS" like on automobiles to set the max leverage for risk management.
Gear 1 - CONSERVATIVE: max leverage level can be 20 for swing traders and beginners
Gear 2 - STANDARD: max leverage level can be 25 (default) for day traders
Gear 3 - AVERAGE: max leverage level can be 33 for day traders
Gear 4 - RISKY: max leverage level can be 50 for scalpers
Gear 5 - AGRESSIVE: max leverage level can be 100 for advanced scalpers
default length for ATR, Standard Deviation and %B are all 50
Simply:
When markets aren't volatile: ELiS indicateshigher leverage values to maximize profits.
When markets are volatile enough: ELiS indicates lower values to reduce risk level.
hope you all enjoy ELiS on profitable trades.

Darvas box (with alerts)Darvas box by Nicholas Darvas, extended original script by KıvanÇ @fr3762 to use new PineScript v4 function box.new()
You can create alerts with this script when price break to the upside or downside from Darvas box

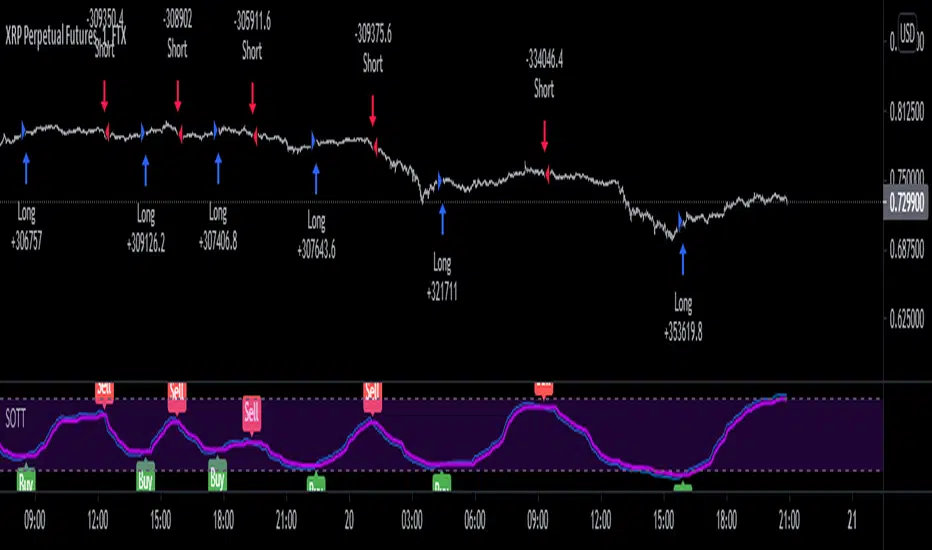
Stochastic Optimized Trend Tracker *Strategy*Stochastic OTT is Anıl Özekşi's latest derived version of Optimized Trend Tracker on Stochastic Oscillator.
He tried to solve the fake signals of Stochastic Oscillator by adopting OTT on the indicator.
He advised users to set the stochastic smoothing parameters to 500 and 200 on his latest video about SOTT.
He personally uses 1 min charts on stock market so the parameters of the indicator might have to be optimized for other time frames nad markets.
He exaggerated the Stochastic to 1000's to have better signals of percent values of OTT .
Also hes used VIDYA in both calculations of OTT and Stochastic smoothing.
Said, Kıvanç Özbilgiç.
I just made a Strategy version of the script so that we lads can backtest it. The codes for that are yet again from Kıvanç Özbilgiç :) I just copy-pasted a few and did some adjustments. Hope you enjoy!
#betonyetmez
Stochastic OTTStochastic OTT is Anıl Özekşi's latest derived version of Optimized Trend Tracker on Stochastic Oscillator.
You might like to view the original version of the indicator if you don't know about OTT yet:
He tried to solve the fake signals of Stochastic Oscillator by adopting OTT on the indicator.
He advised users to set the stochastic smoothing parameters to 500 and 200 on his latest video about SOTT.
He personally uses 1 min charts on stock market so the parameters of the indicator might have to be optimized for other time frames nad markets.
He exaggerated the Stochastic to 1000's to have better signals of percent values of OTT.
Also hes used VIDYA in both calculations of OTT and Stochastic smoothing.
Hope you'll enjoy the SOTT in your profitable trades.
Kıvanç

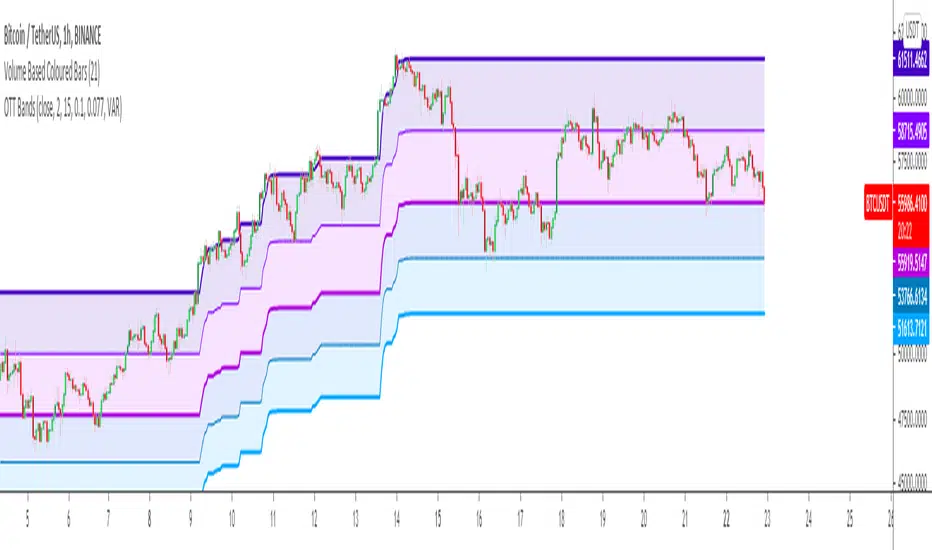
Optimized Trend Tracker BandsDerived from Anıl Özekşi's Optimized trend tracker Indicator OTT:
by himself on his last youtube video with subtitles.
OTT Bands tries to determine accurate support and resistance levels after users manually set the 2 optimization coefficients (for UPPER AND LOWER BANDS) just by having the highest and lowest price levels inside the OTT Bands.
After that user can enjoy the fibonacci coefficiented levels just by selecting from indicator settings.
A message from the developer Anıl Özekşi to all traders:
"Hope you are always on the winning side ..."
Kıvanç Özbilgiç
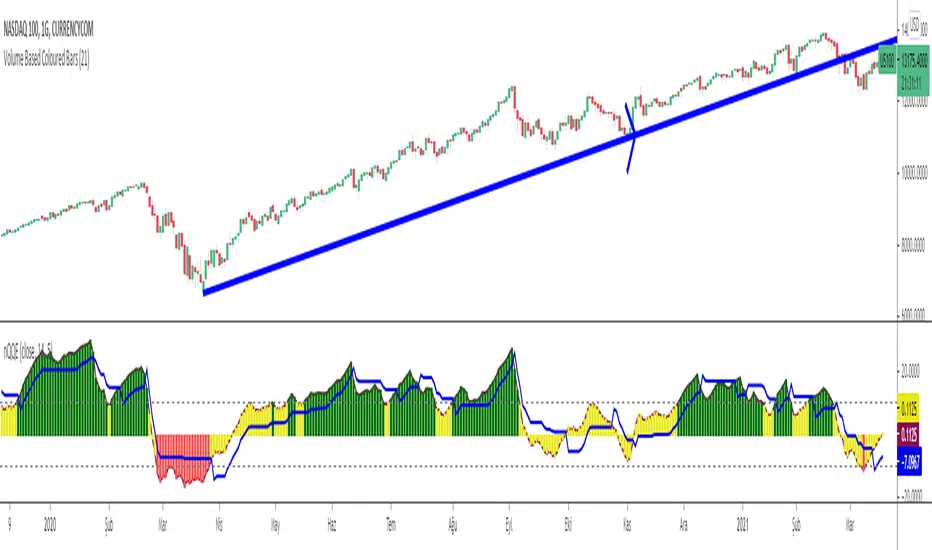
Normalized Quantitative Qualitative Estimation nQQENormalized version of Quantitative Qualitative Estimation QQE:
Normalized QQE tries to overcome the problems of false signals due to RSI divergences on the original QQE indicator.
The main purpose is to determine and ride the trend as far as possible.
So users can identify:
UPTREND : when nQQE Histogram is GREEN (nQQE is above 10)
DOWNTREND : when nQQE Histogram is RED (nQQE is below -10)
SIDEWAYS: when nQQE Histogram is YELLOW (nQQE is between -10 and 10)
Calculation is very simple;
RSI based QQE oscillates between 0-100
nQQE is simply calculated as:
nQQE=QQE-50
to make the indicator fluctuate around 0 level to get more accurate signals.
Various alarms added.
Kıvanç Özbilgiç
Quantitative Qualitative Estimation QQE
The QQE indicator is a momentum based indicator to determine trend and sideways.
The Qualitative Quantitative Estimation (QQE) indicator works like a smoother version of the popular Relative Strength Index (RSI) indicator. QQE expands on RSI by adding two volatility based trailing stop lines. These trailing stop lines are composed of a fast and a slow moving Average True Range (ATR). These ATR lines are smoothed making this indicator less susceptible to short term volatility.
The most common method of using QQE is to look for crosses of the fast and slow moving trailing stop lines during periods when the QQE line reflects overbought or oversold conditions
Qualitative Quantitative Estimation made up of a smoothed Relative Strength Index (RSI) indicator plus fast and slow volatility-based trailing levels.
Qualitative Quantitative Estimation can be used in two directions:
1.Determine the trend, i.e. if the line is above the 50 level, the trend is ascending, if below - descending;
2.Search for signals at the moment of crossing of the QQE FAST (maroon) and QQE SLOW (blue) lines.
The QQE itself is generally considered to indicate an up-trend ifQQE FAST is above QQE SLOW, and a down-trend if below QQE SLOW.
Often a middle-range between 40 and 60 is set and if the indicator is in that range, then the market is considered to be tracking sideways, or in no trend.
You will need to set only one parameter – “SF” "RSI SMoothing Factor", an analogue of the period in RSI.
By the way, judging from the open source information, the algorithm used the standard strength index with a period of 14 for calculations.
Various signals can be created from the indicator such as:
-Buy when QQE FAST crosses above QQE SLOW below 50 level or just buy when QQE lines crosses above 50 level.
-Sell when QQE FAST crosses below QQE SLOW above 50 level or just sell when QQE lines crosses below 50 level.
WARNING: QQE IS A RSI BASED INDICATOR SO THAT IT CAN TRIGGER FALSE SIGNALS DURING DIVERGENCES!
Kıvanç Özbilgiç

Trend MagicTrend Magic is originally a MT platform (MetaTrader) indicator and it can be used with any forex trading systems / strategies for additional confirmation of trading entries or exits. Converted the MT platform code to TradingView Pine version 4. Also you can use Multiple Time Frame.
It also works well with Crypto and Stock Markets.
Trend Magic consists of two main calculation parts as momentum and volatility:
First part is ATR based (like ATR Trailing Stop) logic, second part is all about CCI which also determines the color of Trend Magic.
Blue: when CCI is positive
Red: when CCI is negative
Also added alert condition regarding price crosses :
when LOW CrossesAbove TM
and HIGH CrossesBelow TM
Enjoy
Kıvanç Özbilgiç

Forecast OscillatorThe Forecast Oscillator is a technical indicator that compares a security close price to its time series forecast. The time series forecast function name is "tsf" and it calculates the projection of the price trend for the next bar.
The Forecast Oscillator and therefore the time series forecast are based on linear regression. The time series forecast indicator is equal to the sum of two other indicators: the linear regression (LinearReg) and the linear regression slope (LinearReg_Slope).
If the Forecast Oscillator stays above the zero line for an extended period, then it signals that the price may rise in the future and if it stays below the zero line for an extended period, then it signals a coming fall in the security price.
The indicator name is "Forecast Oscillator" and it accepts two arguments. The first argument is the time series that is used in the next bar forecast (It is usually the close price) and the second one is the period that will be passed to the time series forecast function during calculation . The technical analysis indicator returns a value in percentage that corresponds to the close price minus the previous value of the time series forecast, multiplied by 100 and divided by the close price.
Author's Note:
Just look at the exaggerated movements of the oscillator especially in trend changes . Some examples can be experienced on the chart in rectangles.
Kıvanç Özbilgiç

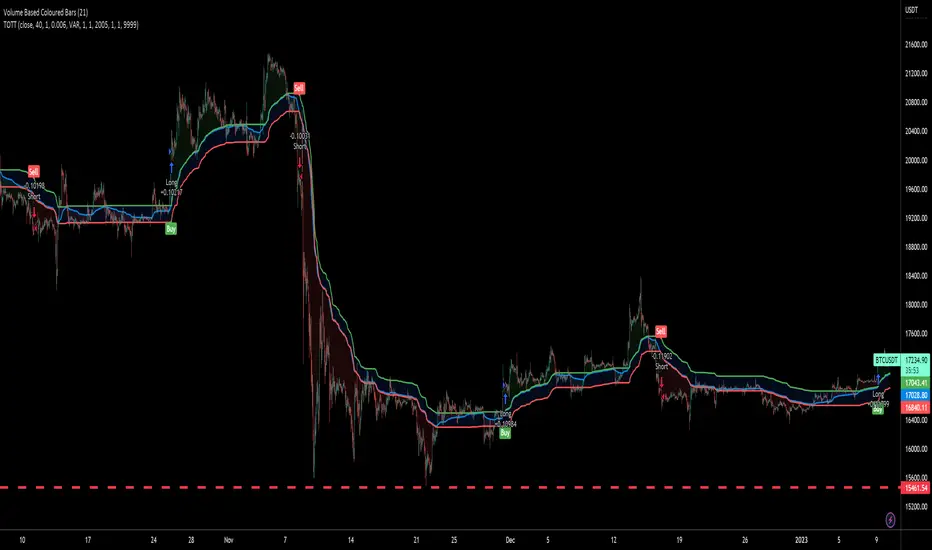
Twin Optimized Trend Tracker Strategy TOTTAnıl Özekşi's new strategy which is a combination of 2 Optimized Trend Tracker lines which are vertical displaced from original version with a COEFFICIENT to cope with sideways' false signals which he explained in "Toy Borsacı İçin OTT Kullanım Kılavuzu 2"
original version of OTT:
OTT Strategy and Screener:
You can find a detailed explanation with subtitles from the developer of OTT Anıl Özekşi himself as: "Toy Borsacı İçin OTT Kullanım Kılavuzu 2"
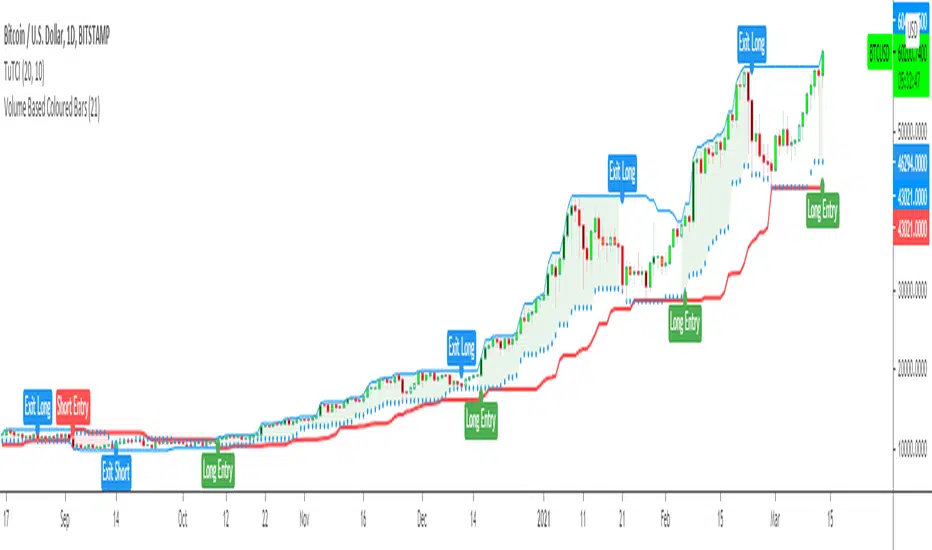
Turtle Trade Channels Indicator TUTCILegendary trade system which proved that great traders can be made, not born.
Turtle Trade Experiment made 80% annual return for 4 years and made 150 million $
Turtle Trade trend following system is a complete opposite to the "buy low and sell high" approach.
This trend following system was taught to a group of average and normal individuals, and almost everyone turned into a profitable trader.
They used the basis logic of well known DONCHIAN CHANNELS which developed by Richard Donchian.
The main rule is "Trade an 20-day breakout and take profits when an 10-day high or low is breached ". Examples:
Buy a 20-day breakout and close the trade when price action reaches a 10-day low.
Go short a 20-day breakout and close the trade when price action reaches a 10-day high.
In this indicator,
The red line is the trading line which indicates the trend directio n:
Price bars over the trend line indicates uptrend
Price bars under the trend line means downtrend
The dotted blue line is the exit line.
Original system is:
Go long when the price High is equal to or above previous 20 day Highest price.
Go short when the price Low is equal to or below previous 20 day Lowest price.
Exit long positions when the price touches the exit line
Exit short positions when the price touches the exit line
Recommended initial stop-loss is ATR * 2 from the opening price.
Default system parameters were 20,10 and 55,20.
Original Turtle Rules:
To trade exactly like the turtles did, you need to set up two indicators representing the main and the failsafe system.
Set up the main indicator with EntryPeriod = 20 and ExitPeriod = 10 (A.k.a S1)
Set up the failsafe indicator with EntryPeriod = 55 and ExitPeriod = 20 using a different color. (A.k.a S2)
The entry strategy using S1 is as follows
Buy 20-day breakouts using S1 only if last signaled trade was a loss.
Sell 20-day breakouts using S1 only if last signaled trade was a loss.
If last signaled trade by S1 was a win, you shouldn't trade -Irregardless of the direction or if you traded last signal it or not-
The entry strategy using S2 is as follows:
Buy 55-day breakouts only if you ignored last S1 signal and the market is rallying without you
Sell 55-day breakouts only if you ignored last S1 signal and the market is pluging without you
You can Highlight the chart with provided trade signals:
Green background color when Long
Red background color when Short
No background color when flat
WARNING: TURTLE TRADE STOP or ADDING more UNITS RULES ARE NOT INCLUDED.
Author: Kıvanç Özbilgiç
Also you can show or hide trade signals with the button on the settings menu
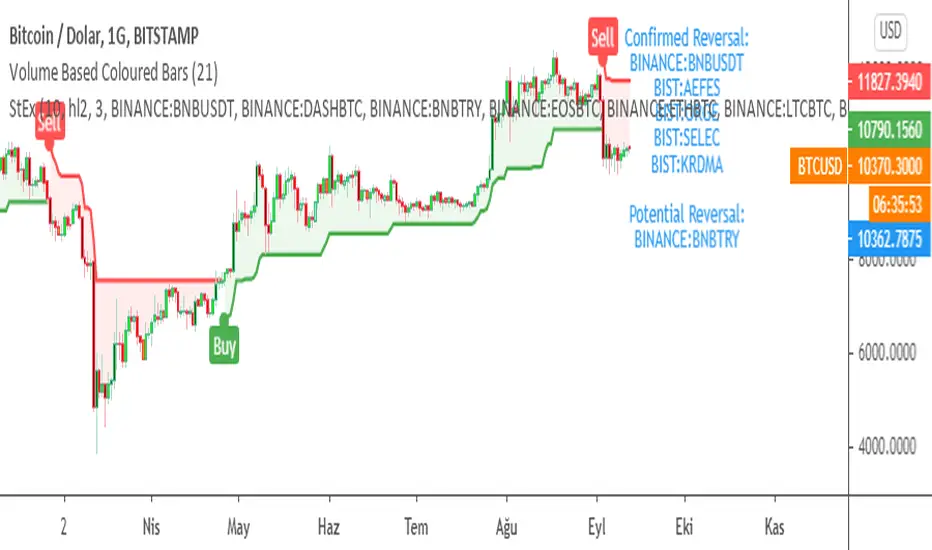
Optimized Trend Tracker STRATEGY & SCREENEROptimized Trend Tracker - OTT STRATEGY & SCREENER screens the BUY and SELL signals (trend reversals) for 20 user defined different tickers in Tradingview charts.
Simply input the name of the ticker in Tradingview that you want to screen.
Terminology explanation:
Confirmed Reversal: OTT reversal that happened in the last bar and cannot be repainted.
Potential Reversal: OTT reversal that might happen in the current bar but can also not happen depending upon the timeframe closing price.
Downtrend: Tickers that are currently in the sell zone
Uptrend: Tickers that are currently in the buy zone
Screener has also got a built in OTT indicator which users can confirm the reversals on graphs.
Screener explores the 20 tickers in current graph's time frame and also in desired parameters of the OTT indicator.
Also you can optimize the parameters manually with the built in STRATEGY version.
Optimized Trend Tracker indicator :
Built in Moving Average type defaultly set as VAR but users can choose from 8 different Moving Average types like:
SMA : Simple Moving Average
EMA : Exponential Movin Average
WMA : Weighted Moving Average
TMA : Triangular Moving Average
VAR : Variable Index Dynamic Moving Average aka VIDYA
WWMA : Welles Wilder's Moving Average
ZLEMA : Zero Lag Exponential Moving Average
TSF : True Strength Force
Tip: In sideways VAR would be a good choice
You can use OTT default alarms and Buy Sell signals like:
1-
BUY when Prices are above OTT
SELL when Prices are below OTT
2-
BUY when OTT support Line crosses over OTT line.
SELL when OTT support Line crosses under OTT line.
3-
BUY when OTT line is Green and makes higher highs.
SELL when OTT line is Red and makes lower lows.
IMPORTANT: SCREENER ONLY EXPLORES AND SCREENS FOR THE 2nd SIGNAL TYPE:
BUY when OTT support Line crosses over OTT line.
SELL when OTT support Line crosses under OTT line.

PMax on RSI with Tillson T3Profit Maximizer Indicator on RSI with Tillson T3 Moving Average:
PMax uses ATR calculation inside, for this reason users couldn't manage to use PMax on RSI because RSI indicator doesn't have High and Low values in bars, but ATR needs that values. So I personally calculate RSI in a different way to have High and Low values of RSI wrt price bars.
IMPORTANT:
Because of the sudden movements and divergences on RSI, this indicator must firstly optimized for the charts before using. Optimization can be held by users for the meaningful parameters for each chart.
3 parameters are critical when optimizing:
First: Multiplier
Second: Tillson T3 Length
Third: T3 Volume Factor
Here are some information about Profit Maximizer:
PMax Indicator:
PMax Screener and Strategy:

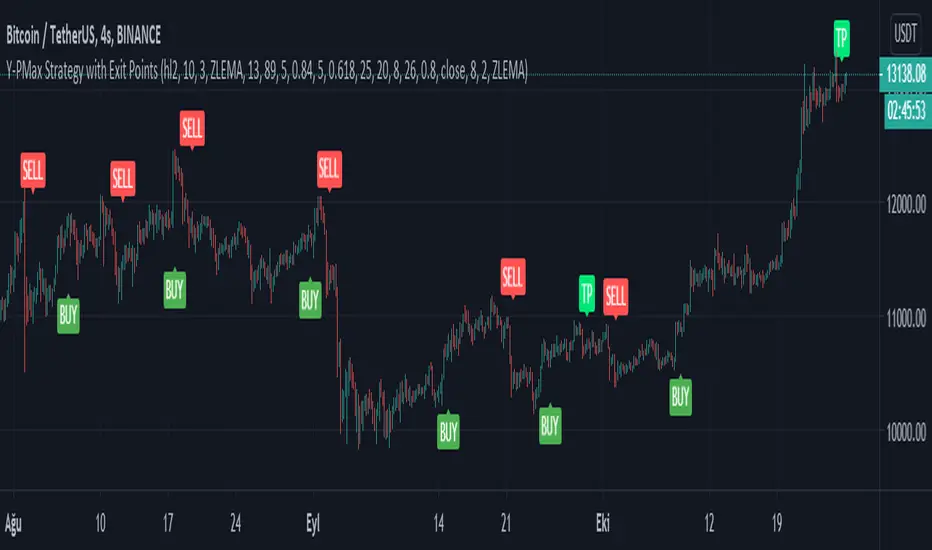
Y-Profit Maximizer Strategy with Exit PointsThis script based on KivancOzbilgic 's PMax indicator. I modified a bit. Added Filters, Exit (TP) Levels and few indicator in it. This script opening only Long Positions.
I have used this indicators in this strategy:
-Moving Stop Loss (Most) by ceyhun
-PMax Explorer STRATEGY & SCREENER
-Bollinger Bands on Macd
-Tillson T3 Moving Average by KIVANÇ fr3762
I am open to suggestions for improve this script.
PS: Script is in Turkish Language.
PMax Explorer STRATEGY & SCREENERProfit Maximizer - PMax Explorer STRATEGY & SCREENER screens the BUY and SELL signals (trend reversals) for 20 user defined different tickers in Tradingview charts.
Simply input the name of the ticker in Tradingview that you want to screen.
Terminology explanation:
Confirmed Reversal: PMax reversal that happened in the last bar and cannot be repainted.
Potential Reversal: PMax reversal that might happen in the current bar but can also not happen depending upon the timeframe closing price.
Downtrend: Tickers that are currently in the sell zone
Uptrend: Tickers that are currently in the buy zone
Screener has also got a built in PMax indicator which users can confirm the reversals on graphs.
Screener explores the 20 tickers in current graph's time frame and also in desired parameters of the SuperTrend indicator.
Also you can optimize the parameters manually with the built in STRATEGY version.
PMax indicator :
Profit Maximizer - PMax is a brand new indicator developed by me.
It's a combination of two trailing stop loss indicators;
One is Anıl Özekşi's MOST (Moving Stop Loss) Indicator
and the other one is well known ATR based SuperTrend
Profit Maximizer - PMax tries to solve this problem. PMax combines the powerful sides of MOST (Moving Average Trend Changer) and SuperTrend (ATR price detection) in one indicator.
Backtest and optimization results of PMax are far better when compared to its ancestors MOST and SuperTrend. It reduces the number of false signals in sideways and give more reliable trade signals.
PMax is easy to determine the trend and can be used in any type of markets and instruments. It does not repaint.
The first parameter in the PMax indicator set by the three parameters is the period/length of ATR.
The second Parameter is the Multiplier of ATR which would be useful to set the value of distance from the built in Moving Average.
I personally think the most important parameter is the Moving Average Length and type.
PMax will be much sensitive to trend movements if Moving Average Length is smaller. And vice versa, will be less sensitive when it is longer.
As the period increases it will become less sensitive to little trends and price actions.
In this way, your choice of period, will be closely related to which of the sort of trends you are interested in.
We are under the effect of the uptrend in cases where the Moving Average is above PMax;
conversely under the influence of a downward trend, when the Moving Average is below PMax.
Built in Moving Average type defaultly set as EMA but users can choose from 8 different Moving Average types like:
SMA : Simple Moving Average
EMA : Exponential Movin Average
WMA : Weighted Moving Average
TMA : Triangular Moving Average
VAR : Variable Index Dynamic Moving Average aka VIDYA
WWMA : Welles Wilder's Moving Average
ZLEMA : Zero Lag Exponential Moving Average
TSF : True Strength Force
Tip: In sideways VAR would be a good choice
You can use PMax default alarms and Buy Sell signals like:
1-
BUY when Moving Average crosses above PMax
SELL when Moving Average crosses under PMax
2-
BUY when prices jumps over PMax line.
SELL when prices go under PMax line.

Profit Maximizer PMaxPMax is a brand new indicator developed by KivancOzbilgic in earlier 2020.
It's a combination of two trailing stop loss indicators;
One is Anıl Özekşi's MOST (Moving Stop Loss) Indicator
and the other one is well known ATR based SuperTrend.
Both MOST and SuperTrend Indicators are very good at trend following systems but conversely their performance is not bright in sideways market conditions like most of the other indicators.
Profit Maximizer - PMax tries to solve this problem. PMax combines the powerful sides of MOST (Moving Average Trend Changer) and SuperTrend (ATR price detection) in one indicator.
Backtest and optimization results of PMax are far better when compared to its ancestors MOST and SuperTrend. It reduces the number of false signals in sideways and give more reliable trade signals.
PMax is easy to determine the trend and can be used in any type of markets and instruments. It does not repaint.
The first parameter in the PMax indicator set by the three parameters is the period/length of ATR.
The second Parameter is the Multiplier of ATR which would be useful to set the value of distance from the built in Moving Average.
I personally think the most important parameter is the Moving Average Length and type.
PMax will be much sensitive to trend movements if Moving Average Length is smaller. And vice versa, will be less sensitive when it is longer.
As the period increases it will become less sensitive to little trends and price actions.
In this way, your choice of period, will be closely related to which of the sort of trends you are interested in.
We are under the effect of the uptrend in cases where the Moving Average is above PMax;
conversely under the influence of a downward trend, when the Moving Average is below PMax.
Built in Moving Average type defaultly set as EMA but users can choose from 8 different Moving Average types like:
SMA : Simple Moving Average
EMA : Exponential Movin Average
WMA : Weighted Moving Average
TMA : Triangular Moving Average
VAR : Variable Index Dynamic Moving Average aka VIDYA
WWMA : Welles Wilder's Moving Average
ZLEMA : Zero Lag Exponential Moving Average
TSF : True Strength Force
Tip: In sideways VAR would be a good choice
You can use PMax default alarms and Buy Sell signals like:
1-
BUY when Moving Average crosses above PMax
SELL when Moving Average crosses under PMax
2-
BUY when prices jumps over PMax line.
SELL when prices go under PMax line.

SuperTrend EXPLORER / SCREENERSUPERTREND EXPLORER / SCREENER screens the BUY and SELL signals (trend reversals) for 38 user defined different tickers in Tradingview charts.
Simply input the short name of the ticker in Tradingview that you want to screen.
Script is derived from zzzcrypto123 's work. Thanks for the permission letting me to use his logic.
Terminology explanation:
Confirmed Reversal: Supertrend reversal that happened in the last bar and cannot be repainted.
Potential Reversal: Supertrend reversal that might happen in the current bar but can also not happen depending upon the timeframe closing price.
Screener has also got a built in SuperTrend indicator which users can confirm the reversals on graphs.
Screener explores the 38 tickers in current graph's time frame and also in desired parameters of the SuperTrend indicator.
SUPERTREND INDICATOR:
STRATEGY version of SuperTrend Indicator:
SuperTrend is one of the most common ATR based trailing stop indicators.
In this version you can change the ATR calculation method from the settings. Default method is RMA, when the alternative method is SMA .
The indicator is easy to use and gives an accurate reading about an ongoing trend. It is constructed with two parameters, namely period and multiplier. The default values used while constructing a superindicator are 10 for average true range or trading period and three for its multiplier.
The average true range (ATR) plays an important role in 'Supertrend' as the indicator uses ATR to calculate its value. The ATR indicator signals the degree of price volatility .
The buy and sell signals are generated when the indicator starts plotting either on top of the closing price or below the closing price. A buy signal is generated when the ‘Supertrend’ closes above the price and a sell signal is generated when it closes below the closing price.
It also suggests that the trend is shifting from descending mode to ascending mode. Contrary to this, when a ‘Supertrend’ closes above the price, it generates a sell signal as the colour of the indicator changes into red.
A ‘Supertrend’ indicator can be used on equities, futures or forex, or even crypto markets and also on daily, weekly and hourly charts as well, but generally, it fails in a sideways-moving market.
Source function added to use the indicator as the ATR Trailing Stop indicator.
Just change source type hl2 to close.
different variations might be useful.
SuperTrend STRATEGYSTRATEGY version of SuperTrend Indicator:
SuperTrend is one of the most common ATR based trailing stop indicators.
In this version you can change the ATR calculation method from the settings. Default method is RMA, when the alternative method is SMA .
The indicator is easy to use and gives an accurate reading about an ongoing trend. It is constructed with two parameters, namely period and multiplier. The default values used while constructing a superindicator are 10 for average true range or trading period and three for its multiplier.
The average true range (ATR) plays an important role in 'Supertrend' as the indicator uses ATR to calculate its value. The ATR indicator signals the degree of price volatility .
The buy and sell signals are generated when the indicator starts plotting either on top of the closing price or below the closing price. A buy signal is generated when the ‘Supertrend’ closes above the price and a sell signal is generated when it closes below the closing price.
It also suggests that the trend is shifting from descending mode to ascending mode. Contrary to this, when a ‘Supertrend’ closes above the price, it generates a sell signal as the colour of the indicator changes into red.
A ‘Supertrend’ indicator can be used on equities, futures or forex, or even crypto markets and also on daily, weekly and hourly charts as well, but generally, it fails in a sideways-moving market.
Source function added to use the indicator as the ATR Trailing Stop indicator.
Just change source type hl2 to close.
different variations might be useful.