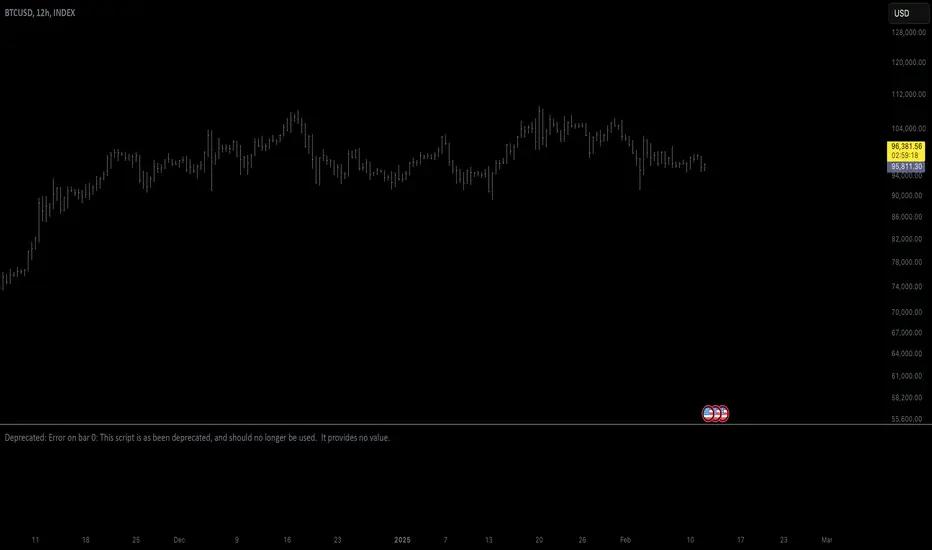
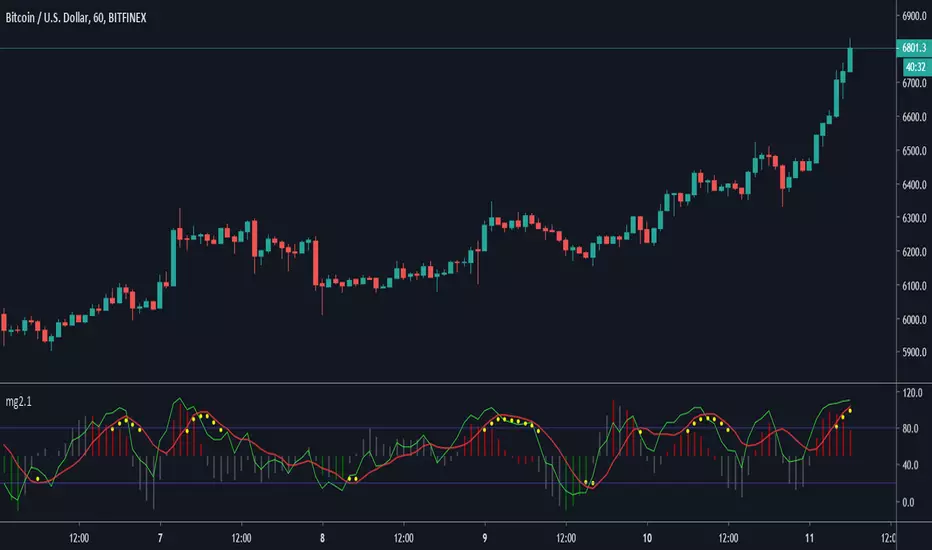
Money Flow Trend Strength [CraftyChaos]I devised this indicator because I wanted to find a way to track the Money Flow Trend to exhaustion for both directions.
Overview:
I use two MFI series and an EMA of the faster MFI series to derive when the Money Flow is trending in one direction or another.
What does this indicator not do:
This indicator does not give buy and sell signals.
What does this indicator do:
This indicator offers confluence with your other indicators to determine when a reversal is approaching after a sustained trend of money flowing in or out of an asset.
This indicator can help time your trades near reversal points, so you are not entering trades in the middle of some trending move.
How to Tune
I would not recommend changing the settings. I have exposed them for people that want to experiment. The short lengths are key to reducing lag
How to read the indicator:
When a red cross appears at the top, this indicates money flow into the asset is strong. Do not short an asset while there are red crosses. You will get REKT
When a green cross appears at the bottom, this indicates money flow exiting the asset is strong. DO NOT buy an asset while there are green crosses. You will get REKT.
When the white step line enters the top, but no crosses appear, this indicates money is flowing into the asset, but is weak. The trend will either gain strength soon or will collapse.
When the white step line enters the bottom, but no crosses appear, this indicates money is flowing out of the asset, but is weak. The trend will either gain strength soon or will collapse.
The green line is the slower MFI. I would not use any crosses with the white step line and the green line. These two lines can cross frequently and show divergences with price. very frequent crossing may indicate sideways movement with no real price movement.
I often see the white step line enter the bottom and top zones under two primary conditions:
Secondary tests of support and resistance zone which fail
Failed breakouts/pullbacks after a pump or dump
Additionally, I use my indicator with the following indicators. You may find them useful:
Jurik Filtered, Composite Fractal Behavior (CFB) Channels (on current timeframe). Note: I often find strong trends trace the upper/lower bands, and end when the upper or lower band flattens
Jurik Filtered, Composite Fractal Behavior (CFB) Channels (on smaller timeframe, i.e., 2hr on a 4h or 15m on the 1hr). Note: I often find weak trend pullbacks/breakouts touch the channel bands
Session Volume Profile. Note: find trend completion corresponds to price above/below VAL areas
Cerca negli script per "Fractal"
Moving Averages RefurbishedIntroduction
This is a collection of multiple moving averages, where you can have a rainbow of moving averages with different types that can be defined by the user.
There are already other indicators in this rainbow style, however certain averages are absent in certain indicators and present in others,
needing the merge to have a more complete solution.
Resources
Here there is the possibility to individually define each moving average.
In addition, it is possible to adjust some details, such as themes, coloring and periods.
Regarding the calculation of averages, credit goes to the following authors.
What I've done here is to group these averages together and allow them to combine.
Credits
TradingView
PineCoders
CrackingCryptocurrency
MightyZinger
Alex Orekhov (everget)
alexgrover
paragjyoti2012
Moving averages available
1. Exponential Moving Average
2. Simple Moving Average
3. Relative Moving Average
4. Weighted Moving Average
5. Ehlers Dynamic Smoothed Moving Average
6. Double Exponential Moving Average
7. Triple Exponential Moving Average
8. Smoothed Moving Average
9. Hull Moving Average
10. Fractal Adaptive Moving Average
11. Kaufman's Adaptive Moving Average
12. Volatility Adjusted Moving Average
13. Jurik Moving Average
14. Optimized Exponential Moving Average
15. Exponential Hull Moving Average
16. Arnaud Legoux Moving Average
17. Coefficient of Variation Weighted Exponential Moving Average
18. Coefficient of Variation Weighted Moving Average
19. * Ehlrs Modified Fractal Adaptive Moving Average
20. Exponential Triangular Moving Average
21. Least Squares Moving Average
22. RSI Moving average
23. Simple Triangular Moving Average
24. Triple Hull Moving Average
25. Variable Index Dynamic Average
26. Volume-weighted Moving Average
27. Zero-Lag Exponential Moving Average
28. Zero-Lag Simple Moving Average
29. Elastic Volume Weighted Moving Average
30. Tillson T3
31. Geometric Moving Average
32. Welles Wilder Moving Average
33. Adjusted Moving Average
34. Corrective Moving average
35. Exponentially Deviating Moving Average
36. EMA Range
37. Sine-Weighted Moving Average
38. Adaptive Moving Average TABLE
39. Following Adaptive Moving Average
40. Hilbert based Kaufman's Adaptive Moving Average
41. Median
42. * VWAP
43. * Rolling VWAP
44. Triangular Simple Moving Average
45. Triangular Exponential Moving Average
46. Moving Average Price Correlation
47. Regularized Exponential Moving Average
48. Repulsion Moving Average
49. * Symmetrically Weighted Moving Average
* fixed period averages

Supply and Demand - Order Block - Energy CandlesSupply and Demand - Order Block - Energy Candles
Description
An experimental script, designed as a visual aid, to highlight the last up or down candle before a fractal break. We can assume these candles where the point of origin that generated enough strength to break recent structure. By using them as reference points, traders are expected to follow their own set of rules and mark higher probability supply and demand zones in the area.
How to use:
Expect a potential retest in these areas, and if they fail, a potential retest in the opposite direction. The greater the number of times a zone is tested, the more likely it is to break. A fresh zone that has not yet been tested will have a higher probability of a bounce.
Fractal period and candle break type can be personalised in settings. Can be used on all timeframes (higher the better).
Indicator in use:
Extras:
An option to flip candle colours if current price is above or below them has been added.

LengthAdaptationCollection of dynamic length adaptation algorithms. Mostly from various Adaptive Moving Averages (they are usually just EMA otherwise). Now you can combine Adaptations with any other Moving Averages or Oscillators (see my other libraries), to get something like Deviation Scaled RSI or Fractal Adaptive VWMA. This collection is not encyclopaedic. Suggestions are welcome.
chande(src, len, sdlen, smooth, power) Chande's Dynamic Length
Parameters:
src : Series to use
len : Reference lookback length
sdlen : Lookback length of Standard deviation
smooth : Smoothing length of Standard deviation
power : Exponent of the length adaptation (lower is smaller variation)
Returns: Calculated period
Taken from Chande's Dynamic Momentum Index (CDMI or DYMOI), which is dynamic RSI with this length
Original default power value is 1, but I use 0.5
A variant of this algorithm is also included, where volume is used instead of price
vidya(src, len, dynLow) Variable Index Dynamic Average Indicator (VIDYA)
Parameters:
src : Series to use
len : Reference lookback length
dynLow : Lower bound for the dynamic length
Returns: Calculated period
Standard VIDYA algorithm. The period oscillates from the Lower Bound up (slow)
I took the adaptation part, as it is just an EMA otherwise
vidyaRS(src, len, dynHigh) Relative Strength Dynamic Length - VIDYA RS
Parameters:
src : Series to use
len : Reference lookback length
dynHigh : Upper bound for the dynamic length
Returns: Calculated period
Based on Vitali Apirine's modification (Stocks and Commodities, January 2022) of VIDYA algorithm. The period oscillates from the Upper Bound down (fast)
I took the adaptation part, as it is just an EMA otherwise
kaufman(src, len, dynLow, dynHigh) Kaufman Efficiency Scaling
Parameters:
src : Series to use
len : Reference lookback length
dynLow : Lower bound for the dynamic length
dynHigh : Upper bound for the dynamic length
Returns: Calculated period
Based on Efficiency Ratio calculation orifinally used in Kaufman Adaptive Moving Average developed by Perry J. Kaufman
I took the adaptation part, as it is just an EMA otherwise
ds(src, len) Deviation Scaling
Parameters:
src : Series to use
len : Reference lookback length
Returns: Calculated period
Based on Derivation Scaled Super Smoother (DSSS) by John F. Ehlers
Originally used with Super Smoother
RMS originally has 50 bar lookback. Changed to 4x length for better flexibility. Could be wrong.
maa(src, len, threshold) Median Average Adaptation
Parameters:
src : Series to use
len : Reference lookback length
threshold : Adjustment threshold (lower is smaller length, default: 0.002, min: 0.0001)
Returns: Calculated period
Based on Median Average Adaptive Filter by John F. Ehlers
Discovered and implemented by @cheatcountry:
I took the adaptation part, as it is just an EMA otherwise
fra(len, fc, sc) Fractal Adaptation
Parameters:
len : Reference lookback length
fc : Fast constant (default: 1)
sc : Slow constant (default: 200)
Returns: Calculated period
Based on FRAMA by John F. Ehlers
Modified to allow lower and upper bounds by an unknown author
I took the adaptation part, as it is just an EMA otherwise
mama(src, dynLow, dynHigh) MESA Adaptation - MAMA Alpha
Parameters:
src : Series to use
dynLow : Lower bound for the dynamic length
dynHigh : Upper bound for the dynamic length
Returns: Calculated period
Based on MESA Adaptive Moving Average by John F. Ehlers
Introduced in the September 2001 issue of Stocks and Commodities
Inspired by the @everget implementation:
I took the adaptation part, as it is just an EMA otherwise
doAdapt(type, src, len, dynLow, dynHigh, chandeSDLen, chandeSmooth, chandePower) Execute a particular Length Adaptation from the list
Parameters:
type : Length Adaptation type to use
src : Series to use
len : Reference lookback length
dynLow : Lower bound for the dynamic length
dynHigh : Upper bound for the dynamic length
chandeSDLen : Lookback length of Standard deviation for Chande's Dynamic Length
chandeSmooth : Smoothing length of Standard deviation for Chande's Dynamic Length
chandePower : Exponent of the length adaptation for Chande's Dynamic Length (lower is smaller variation)
Returns: Calculated period (float, not limited)
doMA(type, src, len) MA wrapper on wrapper: if DSSS is selected, calculate it here
Parameters:
type : MA type to use
src : Series to use
len : Filtering length
Returns: Filtered series
Demonstration of a combined indicator: Deviation Scaled Super Smoother

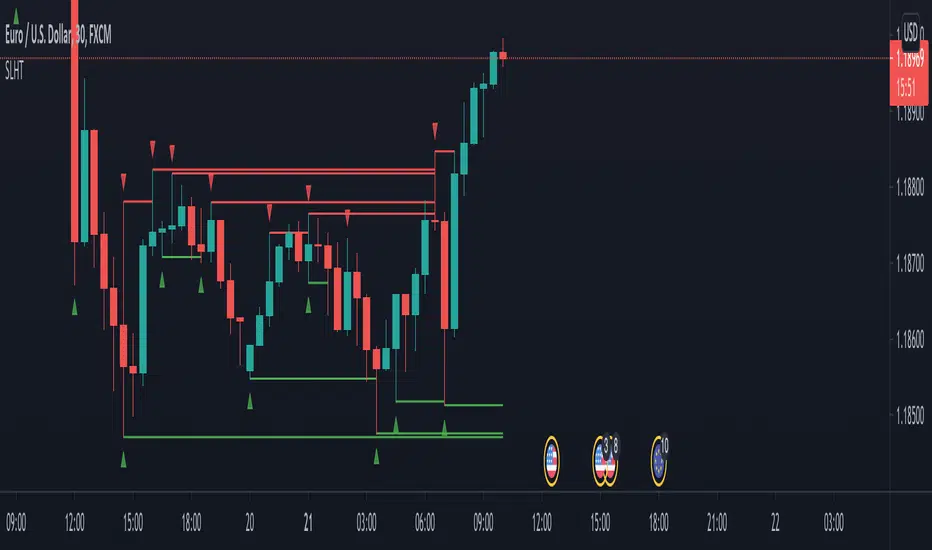
SL Hunter Tracker SL Hunter Tracker
coded by Bogdan Vaida
SL Hunter Tracker is a meticulous hunter that tracks SL hunters.
First it plots the fractals on the chart, then it draws lines from them
to the last wick that touched that height. You can add sweep alerts, once
per bar close, so that you get notified when a wick was touched.
Tested on: EURUSD 30'
Technical checklistNo one indicator is perfect. People always have their favorite indicators and maintain a bias on weighing them purely on psychological reasons other than mathematical. This technical checklist indicator collected 20 common indicators and custom ones to address the issue of a bias weighted decision.
Here, I apply machine learning using a simple sigmoid neuron network with one hidden layer and a single node to avoid artifacts. For the ease of data collection, the indicator matrix is first shown as a heatmap. Once an uptrend signal window is selected manually, an indicator matrix can be recorded in a binary format (i.e., 1 0 0 1 1 0, etc.).
For example, the following indicator matrix was retrieved from the MRNA chart (deciscion: first 5 rows, buying; last 5 rows, no buying):
1 1 0 0 0 1 1 1 1 1 0 1 0 0 1 1 0 1 1 1
1 1 0 0 1 1 1 0 0 0 1 0 1 1 0 1 0 1 1 1
0 0 1 1 0 1 0 0 0 1 1 1 0 0 1 0 0 1 0 0
1 1 0 0 0 1 1 1 1 1 1 0 1 0 0 1 0 1 0 0
0 0 1 1 0 1 1 1 0 1 1 1 0 1 1 1 0 1 0 0
1 1 0 0 1 0 1 0 0 0 0 1 0 0 0 1 0 0 1 1
1 1 0 0 0 0 1 0 0 0 0 1 0 0 1 1 0 1 1 1
0 0 0 0 1 0 1 0 0 1 1 0 0 0 0 0 0 1 0 0
0 0 0 0 0 0 1 0 0 0 1 0 0 1 0 0 0 1 1 1
0 0 0 0 1 0 1 0 0 0 1 0 1 0 0 0 0 1 1 1
This matrix is then used as an input to train the machine learning network. With a correlated buying decision matrix as an output:
1
1
1
1
1
0
0
0
0
0
After training, the corrected weight matrix can be applied back to the indicator. And the display mode can be changed from a heatmap into a histogram to reveal buying signals visually.
Usage:
python stock_ml.py mrna_input.txt output.txt
Weight matrix output:
1.37639407
1.67969656
1.0162141
1.3184323
-1.88888442
8.32928588
-5.35777295
3.08739916
3.06464844
0.82986227
-0.53092333
-1.95045383
4.14441698
2.99179435
-0.08379438
1.70379704
0.4173048
-1.51870972
-2.14284707
-2.08513252
Corresponding indicators to the weight matrix:
1. Breakout
2. Reversal
3. Crossover of ema20 and ema60
4. Crossover of ema20 and ema120
5. MACD golden cross
6. Long cycle (MACD crossover 0)
7. RSI not overbought
8. KD not overbought and crossover
9. OBV uptrend
10. Bullish gap
11. High volume
12. Breakout up fractal
13. Rebounce of down fractal
14. Convergence
15. Turbulence reversal
16. Low resistance
17. Bullish trend (blue zone)
18. Bearish trend (red zone)
19. VIX close above ema20
20. SPY close below ema20
PS. It is recommended not to use default settings but to train your weight matrix based on underlying and timeframe.
Breach v3 BetaThis is a script that allows you to toggle multiple indicators related to support and resistance, CCI, and Breaches (Crossovers based on William's Fractals).
How to use:
Custom Timeframe (Minutes) - To compare to current candles
Crossovers on custom - Crossovers and breaches on custom timeframe (Blue Triangle up)
Crossunders on custom - Crossunders and breaches on custom timeframe (Blue Triangle down)
Crossovers on current candles - Crossovers and breaches on current timeframe/Candlestick (Purple Triangle up)
Crossunder on current candles - Crossunders and breaches on current timeframe/Candlestick (Purple Triangle down)
CCI - CCI Trend indicator (red/green dots)
CCI - window - Input CCI window size in candlesticks (Integer)
Resistance on current candles - Resistance on current candles (Green Line)
Support on current candles - Support on current candles (Red Line)
Resistance - Custom - Resistance line based on Custom Timeframe (Blue Line)
Support - Custom - Support line based on Custom Timeframe (Purple Line)
Price on current support/resistance - Label displaying the price of current (candlestick) support/resistance
Price on custom support/resistance - Label displaying the price of custom (Custom Timeframe) support/resistance

Phoenix085-Studies-PerCentage Current Price ((fib-pivot-%))Misc Details :
Another Indicator and Totally my own concept...
If others have similar study already then Credit to them for coming up with this even before I did but this is just me fiddling with pinescript trying to paint my dream like a great man once said...
Background :
I am a strong believer of Market being Fractals and what best way to script it than Pivots.
So I just wanted to identify the Pivot High and Pivot Low of some period(in the script it is set to 500, please do play with it to get the best setting which captures atleast the major highs and lows of recent past)
I also think that Fibonacci levels are very crucial and so wanted to see how the market reacts at the Fibonacci ratios from Pivot High and Low.
Overview :
As said above the price at Pivot Low is considered as 0% on the graph and Value at Pivot High as the 100%.
Depending on the CMP, the thick white line is plotted...
The main thing of interest here is the Horizontal lines are Fib Levels and the market kinda reacts around those levels as the buyers and sellers have to come to equilibrium...
A price retracing from the 100% level just means Double Top = Sell(Probable) and a bounce from the 0% just means a double bottom = Buy(Probable)....
Also this indicator along with my other Public indicator() might give a better understanding of the price actions (I Hope)...
This is free to use and share with as many as you like...
Credits:
All the great people who have greatly influenced and still continue to do so...
@JustUncleL
@BigBitsIO
@TheArtofTrading
@QuantNomad
@SquigglesNiggles and many many many more

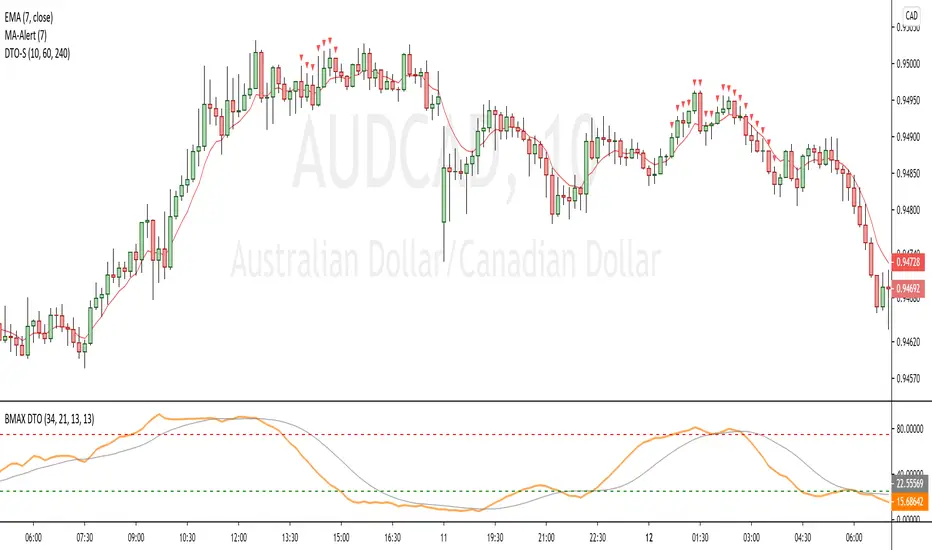
[BMAX] DTO Signal(ENGLISH)
This indicator is a variation of the original DT Oscillator that uses Stochastic and RSI calculations to find momentum opportunities. The purpose of it is to facilitate traking of multiple timeframes for overbought or oversold conditions.
As you can see on the example, we use the DT Oscillator in the selected timeframe, but in order to decide if we take a trade opportunity, we may want to see multiple timeframes in order to check a fractal scenario. DTO Signal indicates when 3 timeframes you select on the configurations are in the same condition, so overbought (above 75) or oversold (bellow 25).
(PORTUGUÊS)
Este indicador é uma variação do indicador DT Oscillator original que utiliza Estocástico e cálculos do RSI para encontrar oportunidades em "momentum". A proposta é facilitar o monitoramento de múltiplos tempos gráficos para condições de sobrecompra ou sobrevenda. Como você pode ver no example, com o uso do DT Oscillator no tempo gráfico escolhido, para que decidamos se tomamos uma posição no mercado, gostaríamos de verificar em múltiplos tempos gráficos uma condição fractal que construa um cenário provavel. DTO Signal indica quando 3 tempos gráficos escolhidos na configuração estão em uma mesma condição, de sobrecompra (acima de 75) ou de sobrevenda (abaixo de 25).
Ichimoku Kinko Hyo and moreI am publishing my updated Ichimoku ++ study with a more suitable title. Future updates will take place with this version.
Description:
The intention of this script is to build/provide a kind of work station / work bench for analysing markets and especially Bitcoin . Another goal is to get maximum market information while maintaining a good chart overview. A chart overloaded with indicators is useless because the structure of the chart is more difficult to see. The chart should be clear and market structure should be easy to see. The script allows you to add indicators and signals in different visualizations to better assess the quality of signals and the sentiment of the market.
A general advise:
Use the included indicators and signals in a confluent way to get stoploss, buy and sell entry points. SR clusters can be identified for use in conjunction with Fractals and other indicators as entry and exit pints. My other scripts can also help. Prefer 4 hours, daily and a longer time frame. There is no "Holy Grail" :).

Rain On Me PRO 2/3This is the part 2 of Rain On Me PRO. It follow my two other indicators "Rain On Me" and "Rain On Me V2". This version is called "PRO" because it is less "user-friendly" than the two previous versions. But it is more faster, and cleaner than ever!
This indicator is separated into 3 parts. You can find all parts into my profile in the « Scripts » section. Once the 3 parts together, the indicator is complete.
Here are the features for this part:
-Support/Resistance and Range lines (Red is Resistance, Yellow is Range, Green is Support).
-MTF Trend Line following the trend with red color for bearish trend and green color for bullish trend (Based on volume so it work only where the volume information flux is available).
-MTF Fractals with alerts. (Zigzag based on high and low).
Everything is fully customizable in settings.
To place an alert, always choose the "Once per bar" option.
Many functions are still to come. So don't hesitate to report bugs, suggestions and follow me to always be kept informed of the next updates to come!
//ALWAYS DELETE INDICATOR AND ALERTS AND RESET THEM AFTER AN UPDATE!
Thank again for your support!
Good trade everyone! And remember, money management is the most important!

Trend LineBasic Trend Line base on fractals (v0.1)
Can not draw a line on the future X axis, So just a line segment but not a ray.
I don't have a better idea to upgrade...

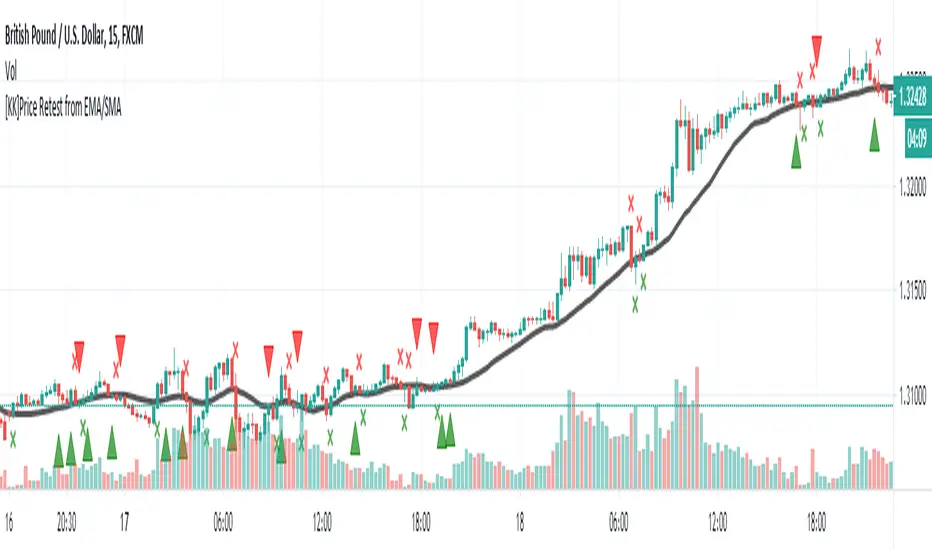
[KK]Price Retest from EMAScript show fractals on chart when price retest after breaking Exponential Moving Average.
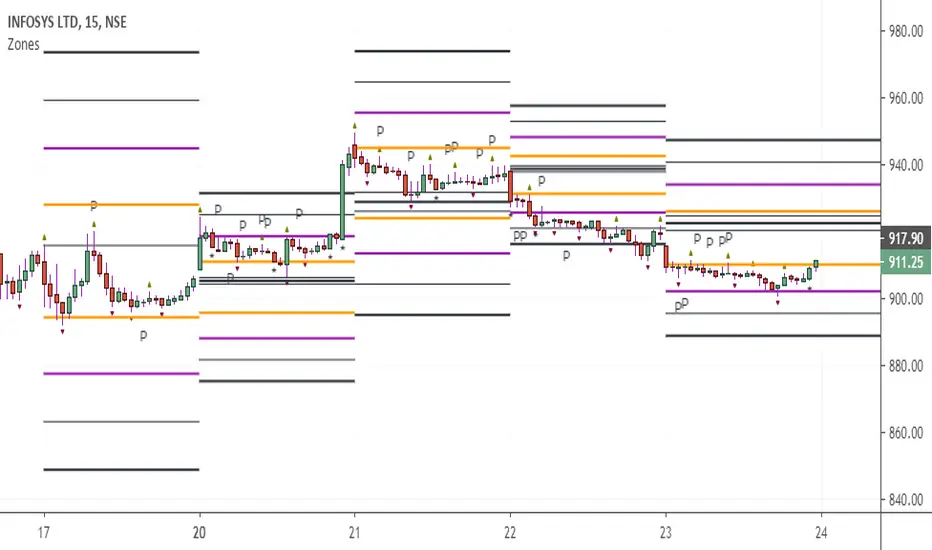
CAMZONEAdded Fractals which establishes high and low based on Bill Williams definition. Added one type of Pinbar (where the open and close is near extreme of the range and with long shadow that is at least 80% of the range). It is a powerful reversal pattern especially on the daily charts. These bars are identified with the character P. Also included dots below momentum candles.
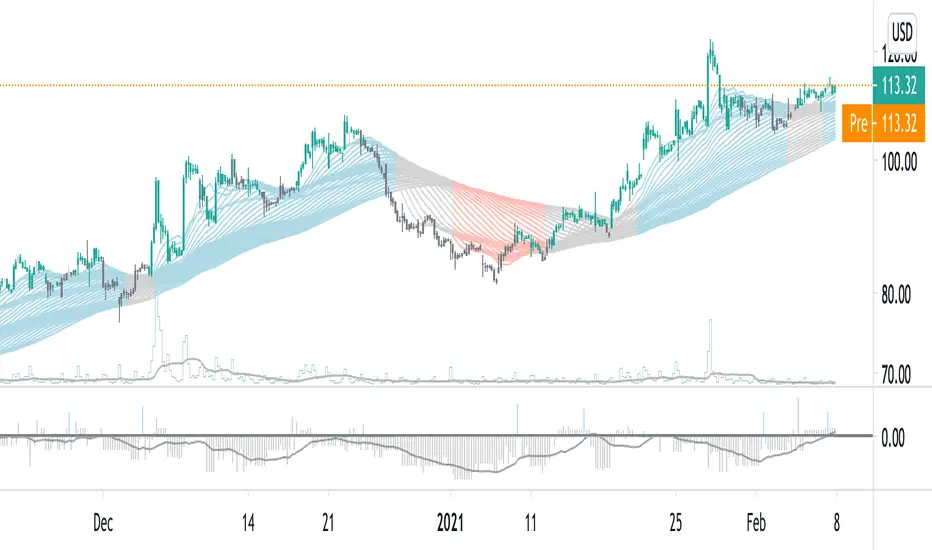
Moving Average Compendium===========
Moving Average Compendium (16 MA Types)
===========
A selection of the most popular, widely used, interesting and most powerful Moving Averages we can think of. We've compiled 16 MA's into this script, and allowed full access to the source code so you can use what you need, as you need it.
-----------
From very simple moving averages using built-in functions, all the way through to Fractal Adaptive Averages, we've tried to cover as much as we can think of! BUT, if you would like to make a suggestion or recommendation to be added to this compendium of MA's please let us know! Together we can get a complete list of many dozens of types of Moving Average.
Full List (so far)
---
SMA - Simple Moving Average
EMA - Exponential Moving Average
WMA - Weighted Moving Average
VWMA - Volume Weighted Moving Average
DEMA - Double Exponential Moving Average
TEMA - Triple Exponential Moving Average
SMMA - Smoothed Moving Average
HMA - Hull Moving Average
ZLEMA - Zero-Lag Exponential Moving Average
KAMA - Kaufman Adaptive Moving Average
JMA - Jurik Moving Average
SWMA - Sine-Weighted Moving Average
TriMA - Triangular Moving Average
MedMA - Moving Median Average
GeoMA - Geometric Mean Moving Average
FRAMA - Fractal Adaptive Moving Average
Line color changes from green (upward) to red (downward) - some of the MA types will "linger" without moving up or down and when they are in this state they should appear gray in color.
Thanks to all involved -
Good Luck and Happy Trading!

WMX Williams Fractals strategy V4There are some magic numbers out there! Guys, Check this out!
if you like it please support me with a like or leave your comments below

Zenith BladeThis script is based heavily on "Support/Resistance Zones x3" by Lij_MC
What I did is went and added alerts for when price breakouts the support line/zone.
You have the options to change if it is based on a zone breakout or a line breakout
You also can choose when it will go off, so for example you want an alert to trigger only between 7am and 8am then you can change that in the menu.
Lastly you can choose whither or not to show the Williams Alligator on the chart as I have found it beneficial in conjunction with the script since its based primarily on fractals to calculate Support and Resistance.

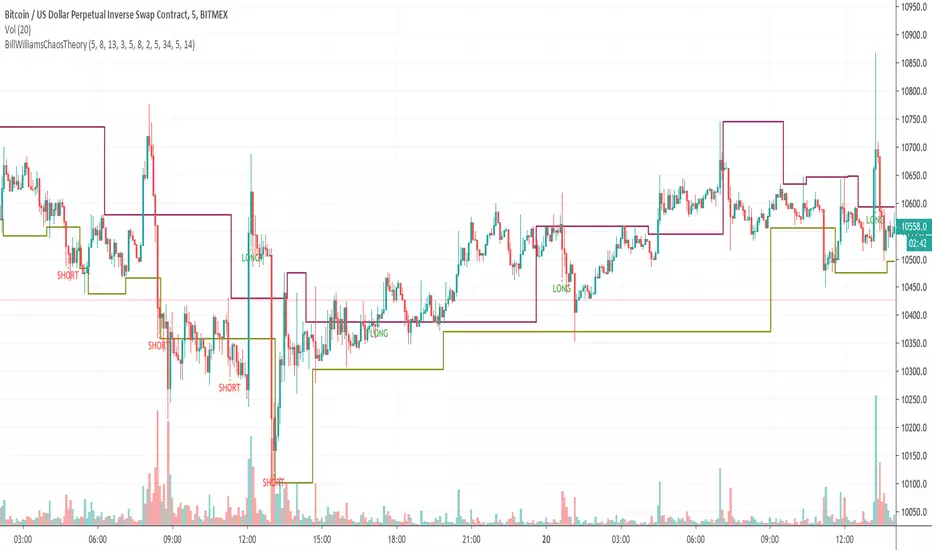
Bill Williams Chaos TheoryBill Williams Chaos Theory
- Alligator
- Fractals
- Accelerator Decelerator Oscillator
- Market Facilitation Index
Combining all of that to generate signal long or short.
Long entry when long signal appears.
Short entry when short signal appears.
For donations
BTC: 3E7rUPX7upS8iTj42JdLt7keJVbJLfvMoH
ETH: 0x094ed88e4c5a9b225e936586cbc2d61f4a027f68
Thank you & happy trading!
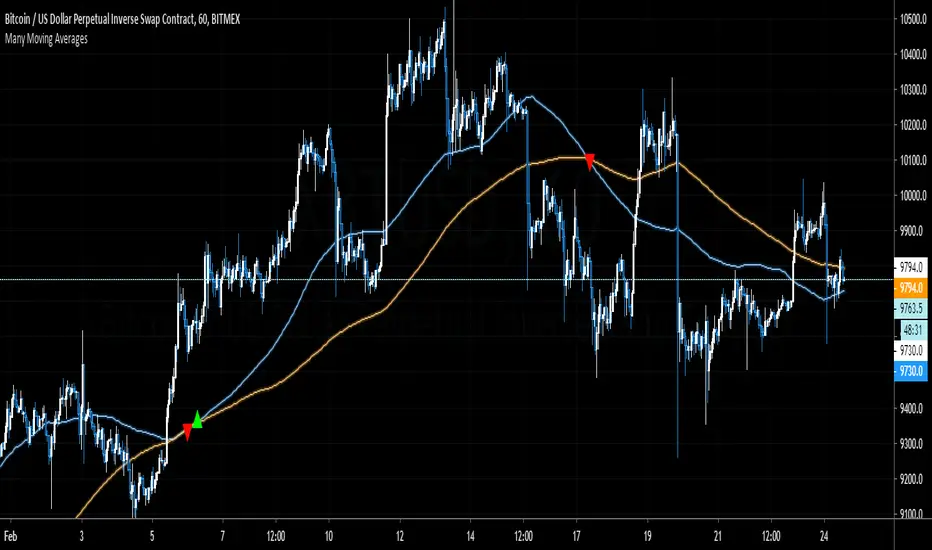
Many Moving AveragesThis script allows you to add two moving averages to a chart, where the type of moving average can be chosen from a collection of 15 different moving average algorithms. Each moving average can also have different lengths and crossovers/unders can be displayed and alerted on.
The supported moving average types are:
Simple Moving Average ( SMA )
Exponential Moving Average ( EMA )
Double Exponential Moving Average ( DEMA )
Triple Exponential Moving Average ( TEMA )
Weighted Moving Average ( WMA )
Volume Weighted Moving Average ( VWMA )
Smoothed Moving Average ( SMMA )
Hull Moving Average ( HMA )
Least Square Moving Average/Linear Regression ( LSMA )
Arnaud Legoux Moving Average ( ALMA )
Jurik Moving Average ( JMA )
Volatility Adjusted Moving Average ( VAMA )
Fractal Adaptive Moving Average ( FRAMA )
Zero-Lag Exponential Moving Average ( ZLEMA )
Kauman Adaptive Moving Average ( KAMA )
Many of the moving average algorithms were taken from other peoples' scripts. I'd like to thank the authors for making their code available.
JayRogers
Alex Orekhov (everget)
Alex Orekhov (everget)
Joris Duyck (JD)
nemozny
Shizaru
KobySK
Jurik Research and Consulting for inventing the JMA.
Pullback SP-Strategy#9This is my interpretation of Steven Primo's pull back strategy indicator # 9. Seems to work on any time frame or combination high and low. I prefer to use it with the regular fractals and a 20 or 50 SMA and 5 period RSI. I would prefer to have it only paint up arrows when bars close above the SMA and vise versa with down arrows. If someone can help me correct that please contact me.
Thanks, 1776er.

Minimal Godmode 2.1// Acknowledgments:
// Original Godmode Authors:
// @Legion, @LazyBear, @Ni6HTH4wK, @xSilas
// Drop a line if you use or modify this code.
// Godmode 3.1.4: @SNOW_CITY
// Godmode 3.2: @sco77m4r7in and @oh92
// Godmode3.2+LSMA: @scilentor
// Godmode 4.0.0-4.0.1: @chrysopoetics
// Jurik Moving Average: @everget
// Constance Brown Composite Index RSI: @LazyBear
// Wavetrend Oscillator: @fskrypt
// TTM Squeeze: @Greeny
// True TSI/RSI: @cI8DH and @chrysopoetics
// Laguerre RSI (Self-Adjusting Alpha with Fractals Energy): @everget
// RSI Shaded: @mortdiggiddy
// Minimal Godmode v2.0:
// 6 BTC pairs/exchanges (instead of 11) to reduce loading time from the pinescript security() function
// Volume Composite for engine calculation
// TTM Squeeze on Wavetrend Signal
// Constance Brown Composite Index RSI (CBCI)
// TrueTSI (Godmode 4.0.0 implementation)
// Laguerre RSI (LRSI)
// Minimal Godmode v2.1:
// Removed TTM Squeeze and Volume Composite
// EMA for Wavetrend Signal
// Multi-exchange for BTC no longer the default
// mg engine toggle for CBCI, Laguerre RSI, and TTSI
// Wavetrend Histogram component toggle
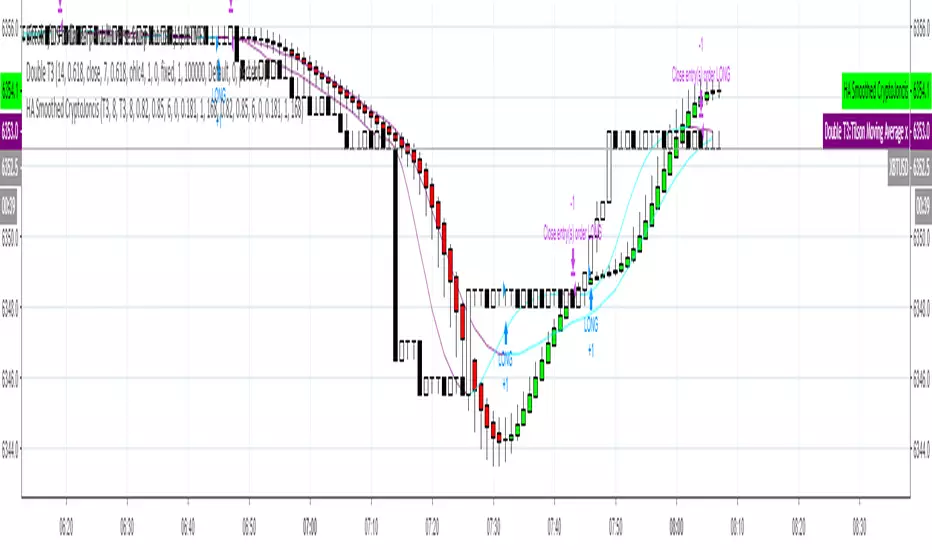
Heikin-Ashi Smoothed with option to change MA types CryptoJoncisPine Script version=3
Author CryptoJoncis
Heikin-Ashi Smoothed
The Heikin-Ashi Smoothed study is based upon the standard Heikin-Ashi study with additional moving average calculations. The following is the calculation formula for the bars:
1. The current bar Open, High, Low, Close values are smoothed individually by using the moving average type specified by the Moving Average Type 1 Input with a length/period specified by the Moving Average Period 1 Input.
2. The Heikin-Ashi bar Open, High, Low, Close values are set using the smoothed values from step 1. This is performed using the standard Heikin-Ashi formula.
3. The final Heikin-Ashi Open, High, Low, Close values are calculated by doing a second smoothing of the bar values from step 2 by using the moving average type specified by the Moving Average Type 2 Input with a length/period specified by the Moving Average Period 2 Input.
If you choose to tick the box where it offers to use only one smoothed HA then it skips the third/final step and you do not need to choose the second MA type for it to work.
Remember, using FRAMA, always make sure you use even number for length.
For simple Heikin-Ashi, please tick single smoothed and DEFAULT (Not smoothed as there are no MA used)
Heikin-Ashi bars are calculated:
1. Close = (Open + High + Low + Close) / 4
This is the average price of the current bar.
2. Open = (Open of Previous Bar + Close of Previous Bar) / 2
This is the midpoint of the previous bar.
3. High = Max of (High, Open, Close)
Highest value of the three.
4. Low = Min of (Low, Open, Close)
Lowest value of the three.
Any questions/suggestions/errors or spelling mistakes? Please leave a comment and let me know. I will try to fix it.
This took me few days to finish, so I hope you will find it useful.
Would you like to have more MA type choices? Please comment down with any other which aren't included in this indicator and I will research them and add.
MA included in this script:
Tillson Moving Average (T3)
Double Exponential Moving Average (DEMA)
Arnaud Legoux Moving Average (ALMA)
Least Squares Moving Average (LSMA)
Simple Moving Average (SMA)
Exponential Moving Average (EMA)
Weighted Moving Average (WMA)
Smoothed Moving Average (SMMA)
Triple Exponential Moving Average (TEMA)
Hull Moving Average (HMA)
Adaptive moving average (AMA)
Fractal Adaptive Moving Average (FAMA)
Variable Index Dynamic Average (VIDYA)
Triangular Moving Average (TRIMA)
You can use,publish,modify this code in any way as you wish, but only if you reference me after.
You are not allowed to sell it as it is.
If this code is useful to you, then consider to buy me a coffee (or better a pint of beer) by donating Bitcoin or Etherium to:
BTC: 3FiBnveHo3YW6DSiPEmoCFCyCnsrWS3JBR
ETH: 0xac290B4A721f5ef75b0971F1102e01E1942A4578
References:
www.sierrachart.com
www.investopedia.com
www.binarytribune.com
www.investopedia.com
www.stockfetcher.com
www.mql5.com
www.incrediblecharts.com
help.cqg.com
www.blastchart.com
ULTIMATE ICHIMOKU TRADING SUITEThis is an update of "Uncle Mo's Ultimate Ichimoku V1"
Main features:
2 x Ichimoku Cloud
5 x EMA
2 x MA
1 x HullMA
Williams Fractal
Bollinger Bands - ***NEW***
ATR - ***NEW***
PSAR - ***NEW***
Candlestick Patterns - ***NEW***
Price Action Bars- ***NEW***
List of credits:
@br0qn for the Ichimoku
@RicardoSantos for the Bill Williams Fractal
@EmilianoMesa for the EMAs/MAs
@mohamed982 for the HullMA
@ymaheshreddy4u for the Bollinger Bands
@ChrisMoody for the Price Action Bars and PSAR
@HPotter for the ATR
@repo32 for the Candlestick Patterns
The script is open source and free to use. Feel free to change it around to suit your needs.
***If you copy & paste code from other traders to make your own script, please do remember to give them credit for their amazing work.***
Happy trading!
