Vix_Fix Enhanced MTF [Cometreon]The VIX Fix Enhanced is designed to detect market bottoms and spikes in volatility, helping traders anticipate major reversals with precision. Unlike standard VIX Fix tools, this version allows you to control the standard deviation logic, switch between chart styles, customize visual outputs, and set up advanced alerts — all with no repainting.
🧠 Logic and Calculation
This indicator is based on Larry Williams' VIX Fix and integrates features derived from community requests/advice, such as inverse VIX logic.
It calculates volatility spikes using a customizable standard deviation of the lows and compares it to a moving high to identify potential reversal points.
All moving average logic is based on Cometreon's proprietary library, ensuring accurate and optimized calculations on all 15 moving average types.
🔷 New Features and Improvements
🟩 Custom Visual Styles
Choose how you want your VIX data displayed:
Line
Step Line
Histogram
Area
Column
You can also flip the orientation (bottom-up or top-down), change the source ticker, and tailor the display to match your charting preferences.
🟩 Multi-MA Standard Deviation Calculation
Customize the standard deviation formula by selecting from 15 different moving averages:
SMA (Simple Moving Average)
EMA (Exponential Moving Average)
WMA (Weighted Moving Average)
RMA (Smoothed Moving Average)
HMA (Hull Moving Average)
JMA (Jurik Moving Average)
DEMA (Double Exponential Moving Average)
TEMA (Triple Exponential Moving Average)
LSMA (Least Squares Moving Average)
VWMA (Volume-Weighted Moving Average)
SMMA (Smoothed Moving Average)
KAMA (Kaufman’s Adaptive Moving Average)
ALMA (Arnaud Legoux Moving Average)
FRAMA (Fractal Adaptive Moving Average)
VIDYA (Variable Index Dynamic Average)
This gives you fine control over how volatility is measured and allows tuning the sensitivity for different market conditions.
🟩 Full Control Over Percentile and Deviation Conditions
You can enable or disable lines for standard deviation and percentile conditions, and define whether you want to trigger on over or under levels — adapting the indicator to your exact logic and style.
🟩 Chart Type Selection
You're no longer limited to candlestick charts! Now you can use Vix_Fix with different chart formats, including:
Candlestick
Heikin Ashi
Renko
Kagi
Line Break
Point & Figure
🟩 Multi-Timeframe Compatibility Without Repainting
Use a different timeframe from your chart with confidence. Signals remain stable and do not repaint. Perfect for spotting long-term reversal setups on lower timeframes.
🟩 Alert System Ready
Configure alerts directly from the indicator’s panel when conditions for over/under signals are met. Stay informed without needing to monitor the chart constantly.
🔷 Technical Details and Customizable Inputs
This indicator includes full control over the logic and appearance:
1️⃣ Length Deviation High - Adjusts the lookback period used to calculate the high deviation level of the VIX logic. Shorter values make it more reactive; longer values smooth out the signal.
2️⃣ Ticker - Choose a different chart type for the calculation, including Heikin Ashi, Renko, Kagi, Line Break, and Point & Figure.
3️⃣ Style VIX - Change the visual style (Line, Histogram, Column, etc.), adjust line width, and optionally invert the display (bottom-to-top).
📌 Fill zones for deviation and percentile are active only in Line and Step Line modes
4️⃣ Use Standard Deviation Up / Down - Enable the overbought and oversold zone logic based on upper and lower standard deviation bands.
5️⃣ Different Type MA (for StdDev) - Choose from 15 different moving averages to define the calculation method for standard deviation (SMA, EMA, HMA, JMA, etc.), with dedicated parameters like Phase, Sigma, and Offset for optimized responsiveness.
6️⃣ BB Length & Multiplier - Adjust the period and multiplier for the standard deviation bands, similar to how Bollinger Bands work.
7️⃣ Show StdDev Up / Down Line - Enable or disable the visibility of upper and lower standard deviation boundaries.
8️⃣ Use Percentile & Length High - Activate the percentile-based logic to detect extreme values in historical volatility using a customizable lookback length.
9️⃣ Highest % / Lowest % - Set the high and low percentile thresholds (e.g., 85 for high, 99 for low) that will be used to trigger over/under signals.
🔟 Show High / Low Percentile Line - Toggle the visual display of the percentile boundaries directly on the chart for clearer signal reference.
1️⃣1️⃣ Ticker Settings – Customize parameters for special chart types such as Renko, Heikin Ashi, Kagi, Line Break, and Point & Figure, adjusting reversal, number of lines, ATR length, etc.
1️⃣2️⃣ Timeframe – Enables using SuperTrend on a higher timeframe.
1️⃣3️⃣ Wait for Timeframe Closes -
✅ Enabled – Displays Vix_Fix smoothly with interruptions.
❌ Disabled – Displays Vix_Fix smoothly without interruptions.
☄️ If you find this indicator useful, leave a Boost to support its development!
Every feedback helps to continuously improve the tool, offering an even more effective trading experience. Share your thoughts in the comments! 🚀🔥
Cerca negli script per "Fractal"

FVG Trailing Stop [LuxAlgo]The FVG Trailing Stop indicator tracks unmitigated Fair Value Gaps (FVG) data to produce a Trailing Stop indicator able to determine if the market is uptrending or downtrending easily.
🔶 USAGE
The FVG Trailing Stop is intended to identify trend directions through its position relative to the closing price:
Bullish: Price is located above the Trailing Stop, indicating that all Bearish FVGs have been mitigated and the trend is anticipated to continue upwards.
Bearish State: Price is located below the Trailing Stop, indicating that all Bullish FVGs have been mitigated and the trend is anticipated to continue downwards.
The Trailing Stop originates from two extremities obtained from the average of respective unmitigated FVGs. The specific directional average is also displayed as a more transparent secondary line, however, the trailing stop is derived from this value and a new trend will not be detected until the opposite directional average is crossed.
Price reaching the Trailing Stop is caused by retracements and can lead to the following scenarios:
Outcome 1: The directional average is crossed next, indicating a new trend direction.
Outcome 2: The directional average is held as support or resistance, leading to a new impulse and a continuation of the trend.
🔹 Reset on Cross
While price crossing the Trailing Stop should be considered as a sign of an upcoming trend change; it is possible for the price to still evolve outside it.
As a solution, we have included the "Reset on Cross" feature, which (as the name suggests) hides and resets the Trailing Stop each time it is crossed, leading to a "Neutral" state.
This opens the opportunity for the Trailing Stop to be displayed again once the price moves again in the direction of the pre-established trend. A trader might use this to accumulate positions within a specific trend.
🔶 DETAILS
The script uses a typical identification method for FVGs. Once identified, the script collects the point of the FVG farthest from the current price when formed.
For Upwards FVGs this is the bottom of the FVG.
For Downwards FVGs this is the top of the FVG.
The data is managed only to use the last input lookback of FVGs. If an FVG is mitigated, it frees up a spot in the memory for a new FVG, however, if the lookback is full, the oldest will be deleted.
From there, it uses a "trailing" logic only to move the Trailing Stop in one direction until the trailing stop resets or the direction flips.
The extremities used to calculate the Trailing Stop are created from 2 calculation steps, the first step involves taking the raw average of the FVG mitigation levels, and the second step applies a simple moving average (SMA) smoothing of the precedent-obtained averages.
🔶 SETTINGS
Unmitigated FVG Lookback: Sets the maximum number of Unmitigated FVGs that the script will use.
Smoothing Length: Sets the smoothing length for the Trailing Stop to reduce erratic results.
Reset on Cross: When enabled, hide and reset the Trailing Stop until the price starts moving in the pre-established trend direction again.

Dynamic Range Filter with Trend Candlesticks (Zeiierman)█ Overview
Dynamic Range Filter with Trend Candlesticks (Zeiierman) is a volatility-responsive trend engine that adapts in real-time to market structure, offering a clean and intelligent visualization of directional bias. It blends dynamic range calculation with customizable smoothing techniques and layered trend confirmation logic, making it ideal for traders who rely on clear trend direction, structural range analysis, and momentum-based candlestick signals.
By measuring scaled volatility over configurable lengths and applying advanced moving average techniques, this indicator filters out market noise while preserving true directional intent. Complementing this, a dual-trend system (range-based and candle-based) enhances clarity and responsiveness, particularly during shifting market conditions.
█ How It Works
⚪ Scaled Volatility Band Calculation
At the core lies a volatility engine that constructs adaptive range bands around price using smoothed high/low calculations. The bands are dynamically adjusted using:
High/Low Smoothing – Applies a moving average to the raw high and low data before calculating the range.
Scaled Range Volatility – A 2.618 multiplier scales the distance between smoothed highs and lows, forming a responsive volatility envelope.
Band Multiplier – Controls how wide the upper/lower range bands extend from the mean.
This filtering process minimizes false signals and highlights only structurally meaningful moves.
⚪ Multi-Type Smoothing Engine
Users can choose from a wide array of smoothing algorithms for trend construction, including:
HMA (default), SMA, EMA, RMA
KAMA – Adapts to market volatility using efficiency ratios.
VIDYA – Momentum-sensitive smoothing using CMO logic.
FRAMA – Dynamically adjusts to fractal dimension in price.
Super Smoother – Ideal for eliminating aliasing in range signals.
This provides the trader with fine-tuned control over reactivity vs. smoothness.
⚪ Trend Detection (Dual Engine)
The indicator includes two independent trend tracking systems:
Main Trend Filter – Based on adaptive volatility band shifts.
Candle Trend Filter – A second-tier confirmation using smoothed candle data, ideal for directional candles and confirmation entries.
█ How to Use
⚪ Trend Confirmation
Use the Trend Line and colored candlesticks for high-probability entries in the trend direction. The more trend layers that align, the higher the confidence.
⚪ Reversal Zones
When the price reaches the outer bands or fails to break them, look for candle color shifts or a crossover in the range to anticipate possible reversals or consolidations.
█ Settings
Scaled Volatility Length – Controls the lookback used to stabilize the base volatility band.
MA Type & Length – Choose and fine-tune the smoothing method (HMA, EMA, KAMA, etc.)
High/Low Smoother – Pre-smoothing for structural high/low banding.
Band Multiplier – Adjusts the width of the dynamic bands.
Trend Length (Candles) – Length used for candle-based trend confirmation.
-----------------
Disclaimer
The content provided in my scripts, indicators, ideas, algorithms, and systems is for educational and informational purposes only. It does not constitute financial advice, investment recommendations, or a solicitation to buy or sell any financial instruments. I will not accept liability for any loss or damage, including without limitation any loss of profit, which may arise directly or indirectly from the use of or reliance on such information.
All investments involve risk, and the past performance of a security, industry, sector, market, financial product, trading strategy, backtest, or individual's trading does not guarantee future results or returns. Investors are fully responsible for any investment decisions they make. Such decisions should be based solely on an evaluation of their financial circumstances, investment objectives, risk tolerance, and liquidity needs.

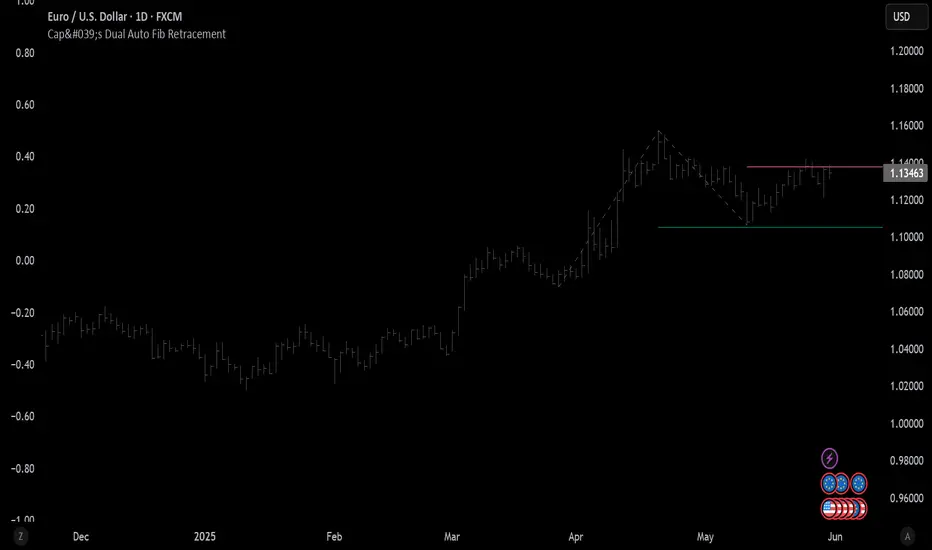
Cap's Dual Auto Fib RetracementThis will draw both a bullish retracement and a bearish retracement. It's defaulted to just show the 0.618 level as I feel like this is the "make or break" level.
- A close below the bullish 0.618 retracement would be considered very bearish.
- A close above the bearish 0.618 would be considered very bullish.
(You can still configure whichever levels you want, however.)
This script was removed by TradingView last time it was published. I couldn't find another script that would provide both bearish/bullish retracements, so I'm assuming this is "original" enough. Maybe it was removed because the description wasn't long enough, so...
Detailed Description:
This indicator automatically plots Fibonacci retracement levels based on zigzag pivot points for both bullish (low-to-high) and bearish (high-to-low) price movements. It identifies key pivot points using a customizable deviation multiplier and depth setting, then draws Fibonacci levels (0, 0.236, 0.382, 0.5, 0.618, 0.786, 1) with user-defined visibility and colors for each level.
Features:
Deviation: Adjusts sensitivity for detecting pivots (default: 2).
Depth: Sets minimum bars for pivot calculation (default: 10).
Extend Lines: Option to extend lines left, right, or both.
Show Prices/Levels: Toggle price and level labels, with options for value or percentage display.
Labels Position: Choose left or right label placement.
Background Transparency: Customize fill transparency between levels.
Alerts: Triggers when price crosses any Fibonacci level.
Usage: Apply to any chart to visualize potential support/resistance zones. Adjust settings to suit your trading style. Requires sufficient data; use lower timeframes or reduce depth if pivots are not detected.
Note: This is a technical analysis tool and does not provide trading signals or financial advice. Always conduct your own research.
Math by Thomas Swing RangeMath by Thomas Swing Range is a simple yet powerful tool designed to visually highlight key swing levels in the market based on a user-defined lookback period. It identifies the highest high, lowest low, and calculates the midpoint between them — creating a clear range for swing trading strategies.
These levels can help traders:
Spot potential support and resistance zones
Analyze price rejection near range boundaries
Frame mean-reversion or breakout setups
The indicator continuously updates and extends these lines into the future, making it easier to plan and manage trades with visual clarity.
🛠️ How to Use
Add to Chart:
Apply the indicator on any timeframe and asset (works best on higher timeframes like 1H, 4H, or Daily).
Configure Parameters:
Lookback Period: Number of candles used to detect the highest high and lowest low. Default is 20.
Extend Lines by N Bars: Number of future bars the levels should be projected to the right.
Interpret Lines:
🔴 Red Line: Swing High (Resistance)
🟢 Green Line: Swing Low (Support)
🔵 Blue Line: Midpoint (Mean level — useful for equilibrium-based strategies)
Trade Ideas:
Bounce trades from swing high/low zones.
Breakout confirmation if price closes strongly outside the range.
Reversion trades if price moves toward the midpoint after extreme moves.

Swing High/Low by %REnglish Description
Swing High/Low by %R
This indicator identifies potential swing high and swing low points by combining William %R overbought/oversold turning points with classic swing price structures.
Swing High: Detected when William %R turns down from overbought territory and the price forms a local high (higher than both neighboring bars).
Swing Low: Detected when William %R turns up from oversold territory and the price forms a local low (lower than both neighboring bars).
This tool is designed to help traders spot possible market reversals and better time their entries and exits.
Customizable parameters:
Williams %R period
Overbought & Oversold thresholds
The indicator plots clear signals above/below price bars for easy visualization.
For educational purposes. Please use with proper risk management!
คำอธิบายภาษาไทย
Swing High/Low by %R
อินดิเคเตอร์นี้ใช้ระบุจุด Swing High และ Swing Low ที่มีโอกาสเป็นจุดกลับตัวของตลาด โดยอาศัยสัญญาณจาก William %R ที่พลิกกลับตัวบริเวณ overbought/oversold ร่วมกับโครงสร้างราคาแบบ swing
Swing High: เกิดเมื่อ William %R พลิกกลับลงจากเขต Overbought และราคาแท่งกลางสูงกว่าทั้งสองแท่งข้างเคียง
Swing Low: เกิดเมื่อ William %R พลิกกลับขึ้นจากเขต Oversold และราคาแท่งกลางต่ำกว่าทั้งสองแท่งข้างเคียง
ช่วยให้เทรดเดอร์สามารถมองเห็นโอกาสในการกลับตัวของราคา และใช้ประกอบการวางแผนจังหวะเข้าหรือออกจากตลาดได้อย่างแม่นยำมากขึ้น
ตั้งค่าได้:
ระยะเวลา Williams %R
ค่าขอบเขต Overbought & Oversold
อินดิเคเตอร์จะแสดงสัญลักษณ์อย่างชัดเจนบนกราฟเพื่อความสะดวกในการใช้งาน
ควรใช้ร่วมกับการบริหารความเสี่ยง

IPDA with Order Blocks [Enhanced]Summary of the Code
This script plots IPDA Standard Deviations on a price chart, helping traders visualize potential support and resistance levels based on a series of user-defined deviations. It uses swing high/low points and time-based fractal lookbacks (monthly, weekly, daily, or intraday) to define price anchors and compute deviation lines.
Key features include:
Deviations: It calculates and plots deviation levels based on the distance between swing highs and lows, which traders can use as price targets or zones of interest.
Timeframes:
Monthly (higher timeframe analysis)
Weekly (medium-term analysis)
Daily and Intraday (shorter-term precision)
Customization:
Choose which deviation levels (e.g., 0, 1, -1, -2) to display.
Hide labels or adjust their sizes for cleaner charts.
Option to remove invalidated deviation levels dynamically.
Visual Cleanliness: Automatically removes clutter by hiding or deleting invalid deviation levels and focusing on active price zones.
How to Utilize It for Intraday Trading to Make $1,000
Here’s how to effectively use the indicator to optimize intraday trading:
1. Set the Right Timeframe:
Use the 15-minute or 1-hour chart for intraday setups.
Ensure the "Intraday" lookback option is enabled to focus on shorter-term swings.
2. Interpret the Levels:
Bearish Order Blocks: Look for red lines (bearish deviation) as potential resistance zones where the price may reverse downward.
Bullish Order Blocks: Look for green lines (bullish deviation) as potential support zones where the price may bounce upward.
3. Plan Entries and Exits:
Entry: Buy near a green order block or short near a red order block, confirming the trade with additional signals (e.g., candlestick patterns, momentum indicators).
Stop Loss: Place your stop below the green line (for buys) or above the red line (for shorts).
Profit Targets: Use deviation levels as targets (e.g., from the 0 level to +1 or -1).
4. Combine with Market Context:
Use the script alongside volume profile, trend indicators, or news events for confirmation.
Avoid trading during major news events unless aligned with deviations.
5. Position Sizing for $1,000 Goal:
Trade liquid instruments like Nasdaq futures (NQ) or major forex pairs.
Risk 1-2% of your capital on each trade and scale into positions if confirmed.
Target a profit of 10-20 points per trade on Nasdaq futures, with 1-2 trades daily.
6. Monitor Key Timeframes:
Pre-market (before 9:30 AM EST): Mark deviation levels to predict market open behavior.
Midday & Power Hour (3-4 PM EST): Watch for breakouts or retests around key deviation levels.
By combining this tool with disciplined risk management and a clear trading plan, you can systematically work toward your profit target while minimizing unnecessary risks

Enigma Sniper 369The "Enigma Sniper 369" is a custom-built Pine Script indicator designed for TradingView, tailored specifically for forex traders seeking high-probability entries during high-volatility market sessions.
Unlike generic trend-following or scalping tools, this indicator uniquely combines session-based "kill zones" (London and US sessions), momentum-based candle analysis, and an optional EMA trend filter to pinpoint liquidity grabs and reversal opportunities.
Its originality lies in its focus on liquidity hunting—identifying levels where stop losses are likely clustered (around swing highs/lows and wick midpoints)—and providing visual entry zones that are dynamically removed once price breaches them, reducing clutter and focusing on actionable signals.
The name "369" reflects the structured approach of three key components (session timing, candle logic, and trend filter) working in harmony to snipe precise entries.
What It Does
"Enigma Sniper 369" identifies potential buy and sell opportunities by drawing two types of horizontal lines on the chart during user-defined London and US
session kill zones:
Solid Lines: Mark the swing low (for buys) or swing high (for sells) of a trigger candle, indicating a potential entry point where stop losses might be clustered.
Dotted Lines: Mark the 50% level of the candle’s wick (lower wick for buys, upper wick for sells), serving as a secondary confirmation zone for entries or tighter stop-loss placement.
These lines are plotted only when specific candle conditions are met within the kill zones, and they are automatically deleted once the price crosses them, signaling that the liquidity at that level has likely been grabbed. The indicator also includes an optional EMA filter to ensure trades align with the broader trend, reducing false signals in choppy markets.
How It Works
The indicator’s logic is built on a multi-layered approach:
Kill Zone Timing: Trades are only considered during user-defined London and US session hours (e.g., London from 02:00 to 12:00 UTC, as seen in the screenshots). These sessions are known for high volatility and liquidity, making them ideal for capturing institutional moves.
Candle-Based Momentum Logic:
Buy Signal: A candle must close above its midpoint (indicating bullish momentum) and have a lower low than the previous candle (suggesting a potential liquidity grab below the previous swing low). This is expressed as close > (high + low) / 2 and low < low .
Sell Signal: A candle must close below its midpoint (bearish momentum) and have a higher high than the previous candle (indicating a potential liquidity grab above the previous swing high), expressed as close < (high + low) / 2 and high > high .
These conditions ensure the indicator targets candles that break recent structure to hunt stop losses while showing directional momentum.
Optional EMA Filter: A 50-period EMA (customizable) can be enabled to filter signals based on trend direction.
Buy signals are only generated if the EMA is trending upward (ema_value > ema_value ), and sell signals require a downward EMA trend (ema_value < ema_value ). This reduces noise by aligning entries with the broader market trend.
Liquidity Levels and Deletion Logic:
For a buy signal, a solid green line is drawn at the candle’s low, and a dotted green line at the 50% level of the lower wick (from the candle body’s bottom to the low).
For a sell signal, a solid red line is drawn at the candle’s high, and a dotted red line at the 50% level of the upper wick (from the body’s top to the high).
These lines extend to the right until the price crosses them, at which point they are deleted, indicating the liquidity at that level has been taken (e.g., stop losses triggered).
Alerts: The indicator includes alert conditions for buy and sell signals, notifying traders when a new setup is identified.
Underlying Concepts
The indicator is grounded in the concept of liquidity hunting, a strategy often employed by institutional traders. Markets frequently move to levels where stop losses are clustered—typically just beyond swing highs or lows—before reversing in the opposite direction. The "Enigma Sniper 369" targets these moves by identifying candles that break structure (e.g., a lower low or higher high) during high-volatility sessions, suggesting a potential sweep of stop losses. The 50% wick level acts as a secondary confirmation, as this midpoint often represents a zone where tighter stop losses are placed by retail traders. The optional EMA filter adds a trend-following element, ensuring entries are taken in the direction of the broader market momentum, which is particularly useful on lower timeframes like the 15-minute chart shown in the screenshots.
How to Use It
Here’s a step-by-step guide based on the provided usage example on the GBP/USD 15-minute chart:
Setup the Indicator: Add "Enigma Sniper 369" to your TradingView chart. Adjust the London and US session hours to match your timezone (e.g., London from 02:00 to 12:00 UTC, US from 13:00 to 22:00 UTC). Customize the EMA period (default 50) and line styles/colors if desired.
Identify Kill Zones: The indicator highlights the London session in light green and the US session in light purple, as seen in the screenshots. Focus on these periods for signals, as they are the most volatile and likely to produce liquidity grabs.
Wait for a Signal: Look for solid and dotted lines to appear during the kill zones:
Buy Setup: A solid green line at the swing low and a dotted green line at the 50% lower wick level indicate a potential buy. This suggests the market may have grabbed liquidity below the swing low and is now poised to move higher.
Sell Setup: A solid red line at the swing high and a dotted red line at the 50% upper wick level indicate a potential sell, suggesting liquidity was taken above the swing high.
Place Your Trade:
For a buy, set a buy limit order at the dotted green line (50% wick level), as this is a more conservative entry point. Place your stop loss just below the solid green line (swing low) to cover the full swing. For example, in the screenshots, the market retraces to the dotted line at 1.32980 after a liquidity grab below the swing low, triggering a buy limit order.
For a sell, set a sell limit order at the dotted red line, with a stop loss just above the solid red line.
Monitor Price Action: Once the price crosses a line, it is deleted, indicating the liquidity at that level has been taken. In the screenshots, after the buy limit is triggered, the market moves higher, confirming the setup. The caption notes, “The market returns and tags us in long with a buy limit,” highlighting this retracement strategy.
Additional Context: Use the indicator to identify liquidity levels that may be targeted later. For example, the screenshot notes, “If a new session is about to open I will wait for the grab liquidity to go long,” showing how the indicator can be used to anticipate future moves at session opens (e.g., London open at 1.32980).
Risk Management: Always set a stop loss below the swing low (for buys) or above the swing high (for sells) to protect against adverse moves. The 50% wick level helps tighten entries, improving the risk-reward ratio.
Practical Example
On the GBP/USD 15-minute chart, during the London session (02:00 UTC), the indicator identifies a buy setup with a solid green line at 1.32901 (swing low) and a dotted green line at 1.32980 (50% wick level). The market initially dips below the swing low, grabbing liquidity, then retraces to the dotted line, triggering a buy limit order. The price subsequently rises to 1.33404, yielding a profitable trade. The user notes, “The logic is in the last candle it provides new level to go long,” emphasizing the indicator’s ability to identify fresh levels after a liquidity sweep.
Customization Tips
Adjust the EMA period to suit your timeframe (e.g., a shorter period like 20 for faster signals on lower timeframes).
Modify the session hours to align with your broker’s timezone or specific market conditions.
Use the alert feature to get notified of new setups without constantly monitoring the chart.
Why It’s Useful for Traders
The "Enigma Sniper 369" stands out by combining session timing, momentum-based candle analysis, and liquidity hunting into a single tool. It provides clear, actionable levels for entries and stop losses, removes invalid signals dynamically, and aligns trades with high-probability market conditions. Whether you’re a scalper looking for quick moves during London open or a swing trader targeting session-based reversals, this indicator offers a structured, data-driven approach to trading.

Quarterly Theory ICT 05 [TradingFinder] Doubling Theory Signals🔵 Introduction
Doubling Theory is an advanced approach to price action and market structure analysis that uniquely combines time-based analysis with key Smart Money concepts such as SMT (Smart Money Technique), SSMT (Sequential SMT), Liquidity Sweep, and the Quarterly Theory ICT.
By leveraging fractal time structures and precisely identifying liquidity zones, this method aims to reveal institutional activity specifically smart money entry and exit points hidden within price movements.
At its core, the market is divided into two structural phases: Doubling 1 and Doubling 2. Each phase contains four quarters (Q1 through Q4), which follow the logic of the Quarterly Theory: Accumulation, Manipulation (Judas Swing), Distribution, and Continuation/Reversal.
These segments are anchored by the True Open, allowing for precise alignment with cyclical market behavior and providing a deeper structural interpretation of price action.
During Doubling 1, a Sequential SMT (SSMT) Divergence typically forms between two correlated assets. This time-structured divergence occurs between two swing points positioned in separate quarters (e.g., Q1 and Q2), where one asset breaks a significant low or high, while the second asset fails to confirm it. This lack of confirmation—especially when aligned with the Manipulation and Accumulation phases—often signals early smart money involvement.
Following this, the highest and lowest price points from Doubling 1 are designated as liquidity zones. As the market transitions into Doubling 2, it commonly returns to these zones in a calculated move known as a Liquidity Sweep—a sharp, engineered spike intended to trigger stop orders and pending positions. This sweep, often orchestrated by institutional players, facilitates entry into large positions with minimal slippage.
Bullish :
Bearish :
🔵 How to Use
Applying Doubling Theory requires a simultaneous understanding of temporal structure and inter-asset behavioral divergence. The method unfolds over two main phases—Doubling 1 and Doubling 2—each divided into four quarters (Q1 to Q4).
The first phase focuses on identifying a Sequential SMT (SSMT) divergence, which forms when two correlated assets (e.g., EURUSD and GBPUSD, or NQ and ES) react differently to key price levels across distinct quarters. For example, one asset may break a previous low while the other maintains structure. This misalignment—especially in Q2, the Manipulation phase—often indicates early smart money accumulation or distribution.
Once this divergence is observed, the extreme highs and lows of Doubling 1 are marked as liquidity zones. In Doubling 2, the market gravitates back toward these zones, executing a Liquidity Sweep.
This move is deliberate—designed to activate clustered stop-loss and pending orders and to exploit pockets of resting liquidity. These sweeps are typically driven by institutional forces looking to absorb liquidity and position themselves ahead of the next major price move.
The key to execution lies in the fact that, during the sweep in Doubling 2, a classic SMT divergence should also appear between the two assets. This indicates a weakening of the previous trend and adds an extra layer of confirmation.
🟣 Bullish Doubling Theory
In the bullish scenario, Doubling 1 begins with a bullish SSMT divergence, where one asset forms a lower low while the other maintains its structure. This divergence signals weakening bearish momentum and possible smart money accumulation. In Doubling 2, the market returns to the previous low and sweeps the liquidity zone—breaking below it on one asset, while the second fails to confirm, forming a bullish SMT divergence.
f this move is followed by a bullish PSP and a clear market structure break (MSB), a long entry is triggered. The stop-loss is placed just below the swept liquidity zone, while the target is set in the premium zone, anticipating a move driven by institutional buyers.
🟣 Bearish Doubling Theory
The bearish scenario follows the same structure in reverse. In Doubling 1, a bearish SSMT divergence occurs when one asset prints a higher high while the other fails to do so. This suggests distribution and weakening buying pressure. Then, in Doubling 2, the market returns to the previous high and executes a liquidity sweep, targeting trapped buyers.
A bearish SMT divergence appears, confirming the move, followed by a bearish PSP on the lower timeframe. A short position is initiated after a confirmed MSB, with the stop-loss placed
🔵 Settings
⚙️ Logical Settings
Quarterly Cycles Type : Select the time segmentation method for SMT analysis.
Available modes include : Yearly, Monthly, Weekly, Daily, 90 Minute, and Micro.
These define how the indicator divides market time into Q1–Q4 cycles.
Symbol : Choose the secondary asset to compare with the main chart asset (e.g., XAUUSD, US100, GBPUSD).
Pivot Period : Sets the sensitivity of the pivot detection algorithm. A smaller value increases responsiveness to price swings.
Pivot Sync Threshold : The maximum allowed difference (in bars) between pivots of the two assets for them to be compared.
Validity Pivot Length : Defines the time window (in bars) during which a divergence remains valid before it's considered outdated.
🎨 Display Settings
Show Cycle :Toggles the visual display of the current Quarter (Q1 to Q4) based on the selected time segmentation
Show Cycle Label : Shows the name (e.g., "Q2") of each detected Quarter on the chart.
Show Labels : Displays dynamic labels (e.g., “Q2”, “Bullish SMT”, “Sweep”) at relevant points.
Show Lines : Draws connection lines between key pivot or divergence points.
Color Settings : Allows customization of colors for bullish and bearish elements (lines, labels, and shapes)
🔔 Alert Settings
Alert Name : Custom name for the alert messages (used in TradingView’s alert system).
Message Frequenc y:
All : Every signal triggers an alert.
Once Per Bar : Alerts once per bar regardless of how many signals occur.
Per Bar Close : Only triggers when the bar closes and the signal still exists.
Time Zone Display : Choose the time zone in which alert timestamps are displayed (e.g., UTC).
Bullish SMT Divergence Alert : Enable/disable alerts specifically for bullish signals.
Bearish SMT Divergence Alert : Enable/disable alerts specifically for bearish signals
🔵 Conclusion
Doubling Theory is a powerful and structured framework within the realm of Smart Money Concepts and ICT methodology, enabling traders to detect high-probability reversal points with precision. By integrating SSMT, SMT, Liquidity Sweeps, and the Quarterly Theory into a unified system, this approach shifts the focus from reactive trading to anticipatory analysis—anchored in time, structure, and liquidity.
What makes Doubling Theory stand out is its logical synergy of time cycles, behavioral divergence, liquidity targeting, and institutional confirmation. In both bullish and bearish scenarios, it provides clearly defined entry and exit strategies, allowing traders to engage the market with confidence, controlled risk, and deeper insight into the mechanics of price manipulation and smart money footprints.

RSI Candlestick Oscillator [LuxAlgo]The RSI Candlestick Oscillator displays a traditional Relative Strength Index (RSI) as candlesticks. This indicator references OHLC data to locate each candlestick point relative to the current RSI Value, leading to a more accurate representation of the Open, High, Low, and Close price of each candlestick in the context of RSI.
In addition to the candlestick display, Divergences are detected from the RSI candlestick highs and lows and can be displayed over price on the chart.
🔶 USAGE
Translating candlesticks into the RSI oscillator is not a new concept and has been attempted many times before. This indicator stands out because of the specific method used to determine the candlestick OHLC values. When compared to other RSI Candlestick indicators, you will find that this indicator clearly and definitively correlates better to the on-chart price action.
Traditionally, the RSI indicator is simply one running value based on (typically) the close price of the chart. By introducing high, low, and open values into the oscillator, we can better gauge the specific price action throughout the intrabar movements.
Interactions with the RSI levels can now take multiple forms, whether it be a full-bodied breakthrough or simply a wick test. Both can provide a new analysis of price action alongside RSI.
An example of wick interactions and full-bodied interactions can be seen below.
As a result of the candlestick display, divergences become simpler to spot. Since the candlesticks on the RSI closely resemble the candlesticks on the chart, when looking for divergence between the chart and RSI, it is more obvious when the RSI and price are diverging.
The divergences in this indicator not only show on the RSI oscillator, but also overlay on the price chart for clearer understanding.
🔹 Filtering Divergence
With the candlesticks generating high and low RSI values, we can better sense divergences from price, since these points are generally going to be more dramatic than the (close) RSI value.
This indicator displays each type of divergence:
Bullish Divergence
Bearish Divergence
Hidden Bullish Divergence
Hidden Bearish Divergence
From these, we get many less-than-useful indications, since every single divergence from price is not necessarily of great importance.
The Divergence Filter disregards any divergence detected that does not extend outside the RSI upper or lower values.
This does not replace good judgment, but this filter can be helpful in focusing attention towards the extremes of RSI for potential reversal spotting from divergence.
🔶 DETAILS
In order to get the desired results for a display that resembles price action while following RSI, we must scale. The scaling is the most important part of this indicator.
To summarize the process:
Identify a range on Price and RSI
Consider them as equal to create a scaling factor
Use the scaling factor to locate RSI's "Price equivalent" Upper, Lower, & Mid on the Chart
Use those prices (specifically the RSI Mid) to check how far each OHLC value lies from it
Use those differences to translate the price back to the RSI Oscillator, pinning the OHLC values at their relative location to our anchor (RSI Mid)
🔹 RSI Channel
To better understand, and for your convenience, the indicator includes the option to display the RSI Channel on the chart. This channel helps to visualize where the scaled RSI values are relative to price.
If you analyze the RSI channel, you are likely to notice that the price movement throughout the channel matches the same movement witnessed in the RSI Oscillator below. This makes sense since they are the exact same thing displayed on different scales.
🔹 Scaling the Open
While the scaling method used is important, and provides a very close view of the real price bar's relative locations on the RSI oscillator… It is designed for a single purpose.
The scaling does NOT make the price candles display perfectly on the RSI oscillator.
The largest place where this is noticeable is with the opening of each candle.
For this reason, we have included a setting that modifies the opening of each RSI candle to be more accurate to the chart's price candles.
This setting positions the current bar's opening RSI candlestick value accurately relative to the price's open location to the previous closing price. As seen below.
🔶 SETTINGS
🔹 RSI Candles
RSI Length: Sets the Length for the RSI Oscillator.
Overbought/Oversold Levels: Sets the Overbought and Oversold levels for the RSI Oscillator.
Scale Open for Chart Accuracy: As described above, scales the open of each candlestick bar to more accurately portray the chart candlesticks.
🔹 Divergence
Show on Chart: Choose to display divergence line on the chart as well as on the Oscillator.
Divergence Length: Sets the pivot width for divergence detection. Normal Fractal Pivot Detection is used.
Divergence Style: Change color and line style for Regular and Hidden divergences, as well as toggle their display.
Divergence Filter: As described above, toggle on or off divergence filtering.
🔹 RSI Channel
Toggle: Display RSI Channel on Chart.
Color: Change RSI Channel Color

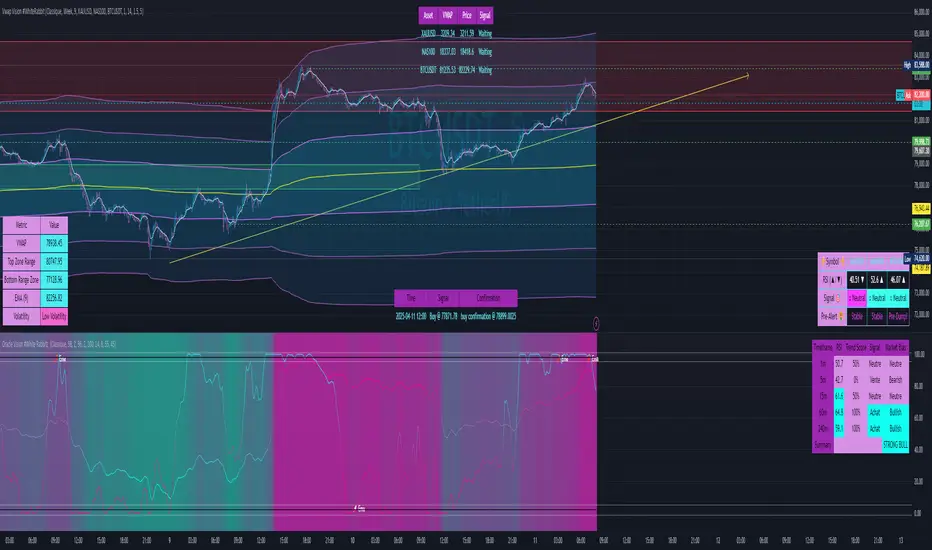
Vwap Vision #WhiteRabbitVWAP Vision #WhiteRabbit
This Pine Script (version 5) script implements a comprehensive trading indicator called "VWAP Vision #WhiteRabbit," designed for analyzing price movements using the Volume-Weighted Average Price (VWAP) along with multiple customizable features, including adjustable color themes for better visual appeal.
Features:
Customizable Color Themes:
Choose from four distinct themes: Classic, Dark Mode, Fluo, and Phil, enhancing the visual layout to match user preferences.
VWAP Calculation:
Uses standard VWAP calculations based on selected anchor periods (Session, Week, Month, etc.) to help identify price trends.
Band Settings:
Multiple bands are calculated based on standard deviations or percentages, with customization options to configure buy/sell zones and liquidity levels.
Buy/Sell Signals:
Generates clear buy and sell signals based on price interactions with the calculated bands and the exponential moving average (EMA).
Real-time Data Display:
Displays real-time signals and VWAP values for selected trading instruments, including XAUUSD, NAS100, and BTCUSDT, along with related alerts for trading opportunities.
Volatility Analysis:
Incorporates volatility metrics using the Average True Range (ATR) to assess market conditions and inform trading decisions.
Enhanced Table Displays:
Provides tables for clear visualization of trading signals, real-time data, and performance metrics.
This script is perfect for traders looking to enhance their analysis and gain insights for making informed trading decisions across various market conditions.
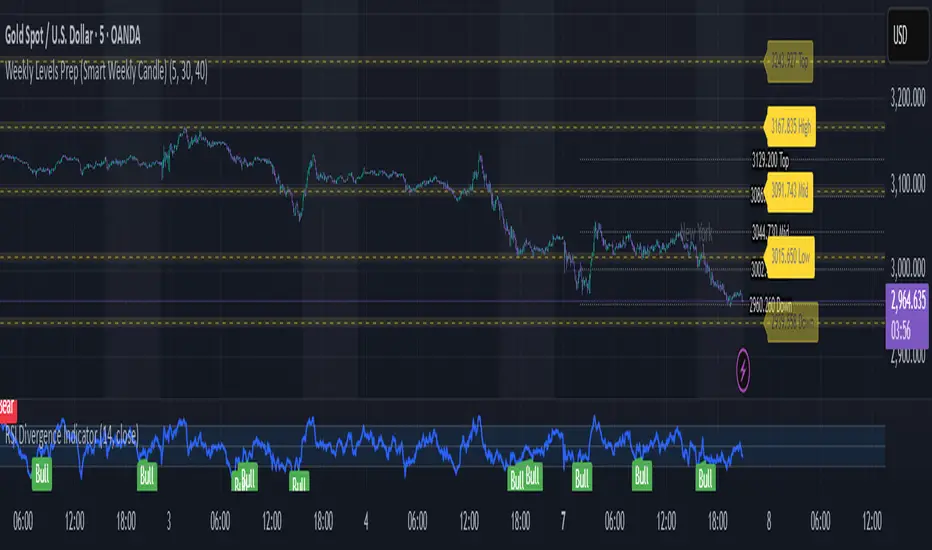
Weekly Levels Prep (Smart Weekly Candle)This script draws key weekly levels based on the most recent completed weekly candle (Monday–Friday). It automatically calculates and plots:
✅ Weekly High & Low
✅ Midpoint (50% level)
✅ Extension levels above and below
All levels are dynamically updated every new week and are visually marked with clean color-coded horizontal lines. Price values are shown near the price axis for clear visibility across all timeframes.
Great for:
Weekly preparation
Swing trading setups
Mean reversion and range breakouts
🔄 Works on all timeframes
🔍 Lightweight and non-intrusive
Built by a trader, for traders. 💼📈
TTM Squeeze Momentum MTF [Cometreon]TTM Squeeze Momentum MTF combines the core logic of both the Squeeze Momentum by LazyBear and the TTM Squeeze by John Carter into a single, unified indicator. It offers a complete system to analyze the phase, direction, and strength of market movements.
Unlike the original versions, this indicator allows you to choose how to calculate the trend, select from 15 different types of moving averages, customize every parameter, and adapt the visual style to your trading preferences.
If you are looking for a powerful, flexible and highly configurable tool, this is the perfect choice for you.
🔷 New Features and Improvements
🟩 Unified System: Trend Detection + Visual Style
You can decide which logic to use for the trend via the "Show TTM Squeeze Trend" input:
✅ Enabled → Trend calculated using TTM Squeeze
❌ Disabled → Trend based on Squeeze Momentum
You can also customize the visual style of the indicator:
✅ Enable "Show Histogram" for a visual mode using Histogram, Area, or Column
❌ Disable it to display the classic LazyBear-style line
Everything updates automatically and dynamically based on your selection.
🟩 Full Customization
Every base parameter of the original indicator is now fully configurable: lengths, sources, moving average types, and more.
You can finally adapt the squeeze logic to your strategy — not the other way around.
🟩 Multi-MA Engine
Choose from 15 different Moving Averages for each part of the calculation:
SMA (Simple Moving Average)
EMA (Exponential Moving Average)
WMA (Weighted Moving Average)
RMA (Smoothed Moving Average)
HMA (Hull Moving Average)
JMA (Jurik Moving Average)
DEMA (Double Exponential Moving Average)
TEMA (Triple Exponential Moving Average)
LSMA (Least Squares Moving Average)
VWMA (Volume-Weighted Moving Average)
SMMA (Smoothed Moving Average)
KAMA (Kaufman’s Adaptive Moving Average)
ALMA (Arnaud Legoux Moving Average)
FRAMA (Fractal Adaptive Moving Average)
VIDYA (Variable Index Dynamic Average)
🟩 Dynamic Signal Line
Apply a moving average to the momentum for real-time cross signals, with full control over its length and type.
🟩 Multi-Timeframe & Multi-Ticker Support
You're no longer limited to the chart's current timeframe or ticker. Apply the squeeze to any symbol or timeframe without repainting.
🔷 Technical Details and Customizable Inputs
This indicator offers a fully modular structure with configurable parameters for every component:
1️⃣ Squeeze Momentum Settings – Choose the source, length, and type of moving average used to calculate the base momentum.
2️⃣ Trend Mode Selector – Toggle "Show TTM Squeeze Trend" to select the trend logic displayed on the chart:
✅ Enabled – Shows the trend based on TTM Squeeze (Bollinger Bands inside/outside Keltner Channel)
❌ Disabled – Displays the trend based on Squeeze Momentum logic
🔁 The moving average type for the Keltner Channel is handled automatically, so you don't need to select it manually, even if the custom input is disabled.
3️⃣ Signal Line – Toggle the Signal Line on the Squeeze Momentum. Select its length and MA type to generate visual cross signals.
4️⃣ Bollinger Bands – Configure the length, multiplier, source, and MA type used in the bands.
5️⃣ Keltner Channel – Adjust the length, multiplier, source, and MA type. You can also enable or disable the True Range option.
6️⃣ Advanced MA Parameters – Customize the parameters for advanced MAs (JMA, ALMA, FRAMA, VIDYA), including Phase, Power, Offset, Sigma, and Shift values.
7️⃣ Ticker & Input Source – Select the ticker and manage inputs for alternative chart types like Renko, Kagi, Line Break, and Point & Figure.
8️⃣ Style Settings – Choose how the squeeze is displayed:
Enable "Show Histogram" for Histogram, Area, or Column style
Disable it to show the classic LazyBear-style line
Use Reverse Color to invert line colors
Toggle Show Label to highlight Signal Line cross signals
Customize trend colors to suit your preferences
9️⃣ Multi-Timeframe Options - Timeframe – Use the squeeze on higher timeframes for stronger confirmation
🔟 Wait for Timeframe Closes -
✅ Enabled – Prevents multiple signals within the same candle
❌ Disabled – Displays the indicator smoothly without delay
🔧 Default Settings Reference
To replicate the default settings of the original indicators as they appear when first applied to the chart, use the following configurations:
🟩 TTM Squeeze (John Carter Style)
Squeeze
Length: 20
MA Type: SMA
Show TTM Squeeze Trend: Enabled
Bollinger Bands
Length: 20
Multiplier: 2.0
MA Type: SMA
Keltner Channel
Length: 20
Multiplier: 1.0
Use True Range: ON
MA Type: EMA
Style
Show Histogram: Enabled
Reverse Color: Enabled
🟩 Squeeze Momentum (LazyBear Style)
Squeeze
Length: 10
MA Type: SMA
Show TTM Squeeze Trend: Disabled
Bollinger Bands
Length: 20
Multiplier: 1.5
MA Type: SMA
Keltner Channel
Length: 10
Multiplier: 1.5
Use True Range: ON
MA Type: SMA
Style
Show Histogram: Disabled
Reverse Color: Disabled
⚠️ These values are intended as a starting point. The Cometreon indicator lets you fully customize every input to fit your trading style.
🔷 How to Use Squeeze Momentum Pro
🔍 Identifying Trends
Squeeze Momentum Pro supports two different methods for identifying the trend visually, each based on a distinct logic:
Squeeze Momentum Trend (LazyBear-style):
Displays 3 states based on the position of the Bollinger Bands relative to the Keltner Channel:
🔵 Blue = No Squeeze (BB outside KC and KC outside BB)
⚪️ White = Squeeze Active (BB fully inside KC)
⚫️ Gray = Neutral state (none of the above)
TTM Squeeze Trend (John Carter-style):
Calculates the difference in width between the Bollinger Bands and the Keltner Channel:
🟩 Green = BB width is greater than KC → potential expansion phase
🟥 Red = BB are tighter than KC → possible compression or pre-breakout
📈 Interpreting Signals
Depending on the active configuration, the indicator can provide various signals, including:
Trend color → Reflects the current compression/expansion state (based on selected mode)
Momentum value (above or below 0) → May indicate directional pressure
Signal Line cross → Can highlight momentum shifts
Color change in the momentum → May suggest a potential trend reversal
🛠 Integration with Other Tools
Squeeze Momentum Pro works well alongside other indicators to strengthen market context:
✅ Volume Profile / OBV – Helps confirm accumulation or distribution during squeezes
✅ RSI – Useful to detect divergence between momentum and price
✅ Moving Averages – Ideal for defining primary trend direction and filtering signals
☄️ If you find this indicator useful, leave a Boost to support its development!
Every piece of feedback helps improve the tool and deliver an even better trading experience.
🔥 Share your ideas or feature requests in the comments!

ZRK 30m This TradingView indicator draws alternating 30-minute boxes aligned precisely to real clock times (e.g., 10:00, 10:30, 11:00), helping traders visually segment intraday price action. It highlights every other 30-minute block with customizable colors, line styles, and opacity, allowing users to clearly differentiate between trading intervals. The boxes automatically adjust based on the chart’s timeframe, maintaining accuracy on 1-minute to 60-minute charts. Optional time labels can also be displayed for additional context. This tool is useful for identifying patterns, measuring volatility, or applying breakout strategies based on defined, consistent time windows across global trading sessions.

SuperTrend MTF Pro [Cometreon]The SuperTrend MTF Pro takes the classic SuperTrend to a whole new level of customization and accuracy. Unlike the standard version, this indicator allows you to select different moving averages, apply it to various chart types, and fine-tune every key parameter.
If you're looking for an advanced, non-repainting, and highly configurable SuperTrend, this is the right choice for you.
🔷 New Features and Improvements
🟩 Multi-MA SuperTrend
Now you can customize the SuperTrend calculation by choosing from 15 different moving averages:
SMA (Simple Moving Average)
EMA (Exponential Moving Average)
WMA (Weighted Moving Average)
RMA (Smoothed Moving Average)
HMA (Hull Moving Average)
JMA (Jurik Moving Average)
DEMA (Double Exponential Moving Average)
TEMA (Triple Exponential Moving Average)
LSMA (Least Squares Moving Average)
VWMA (Volume-Weighted Moving Average)
SMMA (Smoothed Moving Average)
KAMA (Kaufman’s Adaptive Moving Average)
ALMA (Arnaud Legoux Moving Average)
FRAMA (Fractal Adaptive Moving Average)
VIDYA (Variable Index Dynamic Average)
🟩 Multiple Chart Types
You're no longer limited to candlestick charts! Now you can use SuperTrend with different chart formats, including:
Heikin Ashi
Renko
Kagi
Line Break
Point & Figure
🟩 Customizable Timeframe
Now you can adjust the SuperTrend timeframe without repainting issues, avoiding signal distortions.
🔷 Technical Details and Customizable Inputs
SuperTrend offers multiple customization options to fit any trading strategy:
1️⃣ ATR Period – Defines the ATR length, affecting the indicator’s sensitivity.
2️⃣ Source – Selects the price value used for calculations (Close, HL2, Open, etc.).
3️⃣ ATR Mult – Multiplies the ATR to determine band distance. Higher values reduce false signals, lower values make it more reactive.
4️⃣ Change ATR Calculation Method – When enabled, uses the default ATR method; when disabled, allows selecting another Moving Average with "Use Different Type".
5️⃣ Source Break – Defines the price source for trend changes (Close for more stability, High/Low for more reactivity).
6️⃣ Use Different Type – Allows selecting an alternative Moving Average for ATR calculation if "Change ATR Calculation Method" is disabled.
7️⃣ SuperTrend Type – Advanced options for specific MAs (JMA, ALMA, FRAMA, VIDYA), with dedicated parameters like Phase, Sigma, and Offset for optimized responsiveness.
8️⃣ Ticker Settings – Customize parameters for special chart types such as Renko, Heikin Ashi, Kagi, Line Break, and Point & Figure, adjusting reversal, number of lines, and ATR length.
9️⃣ Timeframe – Enables using SuperTrend on a higher timeframe.
🔟 Wait for Timeframe Closes -
✅ Enabled – Prevents multiple signals, useful for precise alerts.
❌ Disabled – Displays SuperTrend smoothly without interruptions.
🔷 How to Use SuperTrend MTF Pro
🔍 Identifying Trends
SuperTrend follows the ongoing trend and provides clear visual signals:
When the price is above the line, the trend is bullish.
When the price is below the line, the trend is bearish.
📈 Interpreting Signals
Line color and position change → Possible trend reversal
Bounce off the line → Potential trend continuation
Strong breakout of the line → Possible reversal
🛠 Integration with Other Tools
RSI or MACD to filter false signals
Moving Averages to confirm trend direction
Support and Resistance to improve entry points
☄️ If you find this indicator useful, leave a Boost to support its development!
Every feedback helps to continuously improve the tool, offering an even more effective trading experience. Share your thoughts in the comments! 🚀🔥

[blackcat] L3 Composite Trading System with ControlOVERVIEW
This indicator combines three distinct trading strategies into a unified decision-making framework. Utilizing KDJ oscillators, MACD divergence analysis, and adaptive signal filtering techniques, it provides actionable buy/sell signals validated against multi-period momentum trends and structural support/resistance levels.
FEATURES
Integrated KDJ oscillator with weighted moving average smoothing
Dynamic MACD difference visualization normalized against price volatility
Multi-layered confirmation process: • Momentum convergence/divergence tracking
• Candle pattern recognition (Yellow/Fuchsia flags)
• SMAs cross-validation (20/60-day thresholds)
Adaptive risk controls via tunable α parameter adjustment
HOW TO USE
Set Alpha Period parameter matching market cycle characteristics
Monitor primary trend direction via candle coloring (green/red zones)
Confirm directional bias using: ▪️ KDJ-J line position relative to zero axis ▪️ MACD histogram slope persistence (>3 bar validation)
Execute trades only when: • Buy/Sell labels align across both oscillator panels • Coincide with candle flag transitions (e.g., red→yellow) • Validate against concurrent SMA breakout conditions
LIMITATIONS
Lag inherent in EMA-based components during rapid reversals
Requires minimum 60-bar history for full functionality
Sensitive to fractal scaling due to normalization methods
Does not account for liquidity/volume dynamics
NOTES
• Yellow/Fuchsia flags reflect relative strength changes vs prior session
• SMA crossover validations have 16-bar lookback memory retention

Overlay Hourly Candle [odnac] * This script overlays 1-hour candlestick representations on the chart.
* It captures the open, close, high, and low prices for each hourly period.
* The script dynamically updates as new hourly candles form and adjusts the
* box and wick positions accordingly.
*
* Features:
* - Draws an hourly candle with body and wicks.
* - Colors bullish candles in green and bearish candles in red.
* - Updates dynamically as new hourly candles form.
* - Uses TradingView's box and line functions to represent candle structures.
*
* Usage:
* - Add the script to your TradingView chart as an overlay.
* - Observe how the hourly candles appear distinctly on any timeframe.
ICT Bread and Butter Sell-SetupICT Bread and Butter Sell-Setup – TradingView Strategy
Overview:
The ICT Bread and Butter Sell-Setup is an intraday trading strategy designed to capitalize on bearish market conditions. It follows institutional order flow and exploits liquidity patterns within key trading sessions—London, New York, and Asia—to identify high-probability short entries.
Key Components of the Strategy:
🔹 London Open Setup (2:00 AM – 8:20 AM NY Time)
The London session typically sets the initial directional move of the day.
A short-term high often forms before a downward push, establishing the daily high.
🔹 New York Open Kill Zone (8:20 AM – 10:00 AM NY Time)
The New York Judas Swing (a temporary rally above London’s high) creates an opportunity for short entries.
Traders fade this move, anticipating a sell-off targeting liquidity below previous lows.
🔹 London Close Buy Setup (10:30 AM – 1:00 PM NY Time)
If price reaches a higher timeframe discount array, a retracement higher is expected.
A bullish order block or failure swing signals a possible reversal.
The risk is set just below the day’s low, targeting a 20-30% retracement of the daily range.
🔹 Asia Open Sell Setup (7:00 PM – 2:00 AM NY Time)
If institutional order flow remains bearish, a short entry is taken around the 0-GMT Open.
Expect a 15-20 pip decline as the Asian range forms.
Strategy Rules:
📉 Short Entry Conditions:
✅ New York Judas Swing occurs (price moves above London’s high before reversing).
✅ Short entry is triggered when price closes below the open.
✅ Stop-loss is set 10 pips above the session high.
✅ Take-profit targets liquidity zones on higher timeframes.
📈 Long Entry (London Close Reversal):
✅ Price reaches a higher timeframe discount array between 10:30 AM – 1:00 PM NY Time.
✅ A bullish order block confirms the reversal.
✅ Stop-loss is set 10 pips below the day’s low.
✅ Take-profit targets 20-30% of the daily range retracement.
📉 Asia Open Sell Entry:
✅ Price trades slightly above the 0-GMT Open.
✅ Short entry is taken at resistance, targeting a quick 15-20 pip move.
Why Use This Strategy?
🚀 Institutional Order Flow Tracking – Aligns with smart money concepts.
📊 Precise Session Timing – Uses market structure across London, New York, and Asia.
🎯 High-Probability Entries – Focuses on liquidity grabs and engineered stop hunts.
📉 Optimized Risk Management – Defined stop-loss and take-profit levels.
This strategy is ideal for traders looking to trade with institutions, fade liquidity grabs, and capture high-probability short setups during the trading day. 📉🔥

Pipsttocra Technical Patterns: EV HV FVG & OBPipstocrat Technical Patterns , identifies and visualizes key technical analysis patterns and structures on a TradingView chart. Here's a simple breakdown of what it does:
Fair Value Gaps (FVG):
Detects and highlights bullish and bearish Fair Value Gaps as colored boxes.
Adds centerline markers to indicate potential price levels.
Order Blocks (OB):
Identifies bullish and bearish order blocks (areas of significant buying or selling).
Displays them as colored rectangles extending to the right of the chart.
Candlestick Patterns:
Detects Engulfing Patterns (bullish and bearish) with volume confirmation.
Highlights Hammer and Inverted Hammer patterns with customizable shapes and colors.
Customization Options:
Allows users to adjust colors, sizes, and styles for all patterns and structures.
Provides options to show/hide specific patterns like FVGs, engulfing candles, hammers, etc.
Alerts:
Generates alerts for detected patterns, such as FVGs, order blocks, engulfing candles, and confluence zones (combination of FVGs and order blocks).
Management Features:
Automatically removes older or "filled" patterns (optional).
Tracks and updates patterns dynamically as new bars form.
Purpose:
This tool helps traders spot high-probability trading opportunities by identifying key market structures (like FVGs and order blocks) and candlestick patterns. It combines multiple technical analysis concepts into one comprehensive indicator for better decision-making.

Rally Base Drop SND Pivots [LuxAlgo]The Rally Base Drop SND Pivots indicator uses "Rally", "Base", and "Drop" Candles to determine pivot points at which supply and demand (SND) levels are drawn.
🔶 USAGE
Rally, Base, and Drop (RBD) candles create a formula for seeing market structure through a fixed methodology. We are able to use this concept to point out pivot areas where Rallies and Drops directly meet.
The RBD SND Pivots are similar to traditionally identified "fractal" pivot points, with one key difference.
RBD SND Pivots detect a specific number of Rally and Drop candles directly back-to-back, requiring one side of the pivot to contain entirely green candles and the other to be entirely red candles or vice versa.
Since these pivot levels are based on Rally, Base, and Drop candles, the method directly implements rigid logic to further structure a trading system when utilizing these pivot levels with traditional SND concepts.
Furthermore, by implementing this logic when looking for pivots, a significant portion of potential noise is naturally filtered out.
🔶 DETAILS
In typical SND systems, the term "Base" is used for multiple meanings.
In this indicator, the base is a product of a pivot being formed. Once a Pivot is identified, the "Base" is marked as the first Rally or Drop of the second half of the pivot formation.
Once the pivot is identified, the high or low of the base candle is used to measure the pivot level.
🔶 SETTINGS
Length: Sets the number of Rally and Drop Candles that the script will require to identify pivots.
Ex. "3" = 3 Rally followed by 3 Drop
Historical Lookback: Hides historic levels based on a bar # Lookback from the current bar.
When set to 0, all Levels will display. (0 by default)

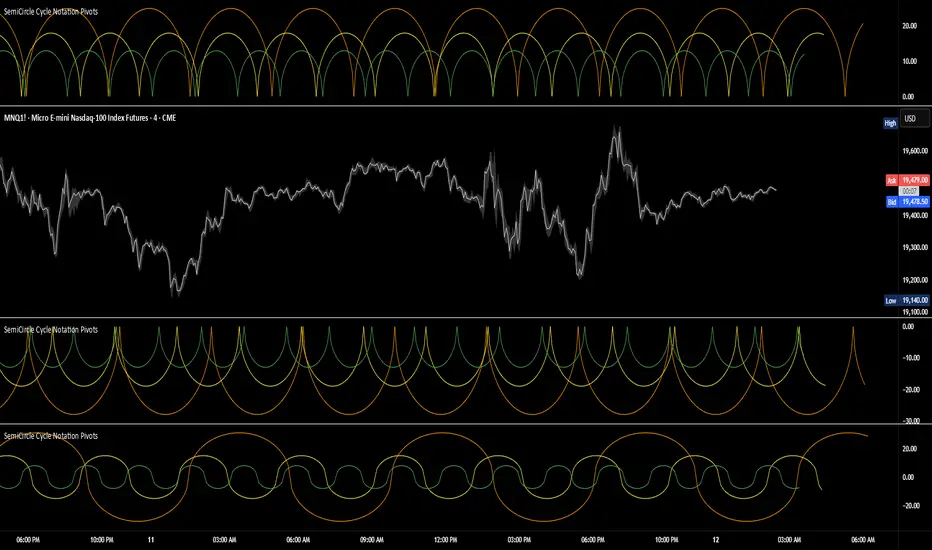
SemiCircle Cycle Notation PivotsFor decades, traders have sought to decode the rhythm of the markets through cycle theory. From the groundbreaking work of HM Gartley in the 1930s to modern-day cycle trading tools on TradingView, the concept remains the same: markets move in repeating waves with larger cycles influencing smaller ones in a fractal-like structure, and understanding their timing gives traders an edge to better anticipate future price movements🔮.
Traditional cycle analysis has always been manual, requiring traders to painstakingly plot semicircles, diamonds, or sine waves to estimate pivot points and time reversals. Drawing tools like semicircle & sine wave projections exist on TradingView, but they lack automation—forcing traders to adjust cycle lengths by eye, often leading to inconsistencies.
This is where SemiCircle Cycle Notation Pivots indicator comes in. Semicircle cycle chart notation appears to have evolved as a practical visualization tool among cycle theorists rather than being pioneered by a single individual; some key influences include HM Gartley, WD Gann, JM Hurst, Walter Bressert, and RayTomes. Built upon LonesomeTheBlue's foundational ZigZag Waves indicator , this indicator takes cycle visualization to the next level by dynamically detecting price pivots and then automatically plotting semicircles based on real-time cycle length calculations & expected rhythm of price action over time.
Key Features:
Automated Cycle Detection: The indicator identifies pivot points based on your preference—highs, lows, or both—and plots semicircle waves that correspond to Hurst's cycle notation.
Customizable Cycle Lengths: Tailor the analysis to your trading strategy with adjustable cycle lengths, defaulting to 10, 20, and 40 bars, allowing for flexibility across various timeframes and assets.
Dynamic Wave Scaling: The semicircle waves adapt to different price structures, ensuring that the visualization remains proportional to the detected cycle lengths and aiding in the identification of potential reversal points.
Automated Cycle Detection: Dynamically identifies price pivot points and automatically adjusts offsets based on real-time cycle length calculations, ensuring precise semicircle wave alignment with market structure.
Color-Coded Cycle Tiers: Each cycle tier is distinctly color-coded, enabling quick differentiation and a clearer understanding of nested market cycles.
Inverse FVG with Quadrants [Modified]# Inverse FVG with Quadrants
*Modified version of original indicator by **tradeforopp**
## Overview
This advanced Fair Value Gap (FVG) indicator identifies both regular and inverse fair value gaps with precision, displaying them in a visually intuitive quadrant-based system. The enhanced version now features automatic timeframe selection that aligns higher timeframe FVGs with your current chart period for multi-timeframe analysis.
## Key Features
### 🔹 Fair Value Gap Detection
- **Regular FVGs**: Identifies traditional bullish and bearish fair value gaps
- **Inverse FVGs**: Automatically detects and displays inverse fair value gaps when price closes through a regular FVG
- **Quadrant Display**: Shows only the relevant half of each FVG for cleaner visual analysis (upper quadrant for bullish patterns, lower quadrant for bearish)
### 🔹 Smart Timeframe Management
- **Auto Timeframe Selection**: Automatically selects the appropriate higher timeframe based on your current chart:
- 1min → 15min
- 3min → 30min
- 5min → 1h
- 15min → 4h
- 1h → Daily
- 4h → Weekly
- **Manual Override**: Optional manual timeframe selection still available
### 🔹 Visual Customization
- Adjustable colors for both regular and inverse FVGs
- Optional box extension
- Customizable display limits to prevent chart clutter
- Session filtering capabilities
### 🔹 Trading Signals
- FVGs provide potential support/resistance zones and price targets
- Inverse FVGs offer confirmation of trend continuation or reversal
- Alert conditions for new FVG creation, regular FVG, and inverse FVG events
## How to Use
1. Apply the indicator to your chart
2. Enable "Auto Timeframe Selection" for multi-timeframe analysis (recommended)
3. Adjust displacement settings to filter for more significant FVGs
4. Use regular FVGs as potential zones where price may return to fill the gap
5. Watch for inverse FVGs as confirmation signals when price breaks through regular FVGs
This refined indicator combines powerful FVG analysis with automatic timeframe alignment to provide traders with clear, actionable insights across multiple timeframes. Perfect for both intraday traders and swing traders looking for high-probability entry and exit points.
Credits to @tradeforopp for creating the original version of this indicator. This is a modified version with enhanced features while preserving the core functionality.
## Tips
- Blue boxes (FVG+) indicate bullish fair value gaps (potential support)
- Red boxes (FVG-) indicate bearish fair value gaps (potential resistance)
- When price closes through an FVG, watch for the inverse FVG as a confirmation signal
- Use the dashed centerline as a potential target within each FVG

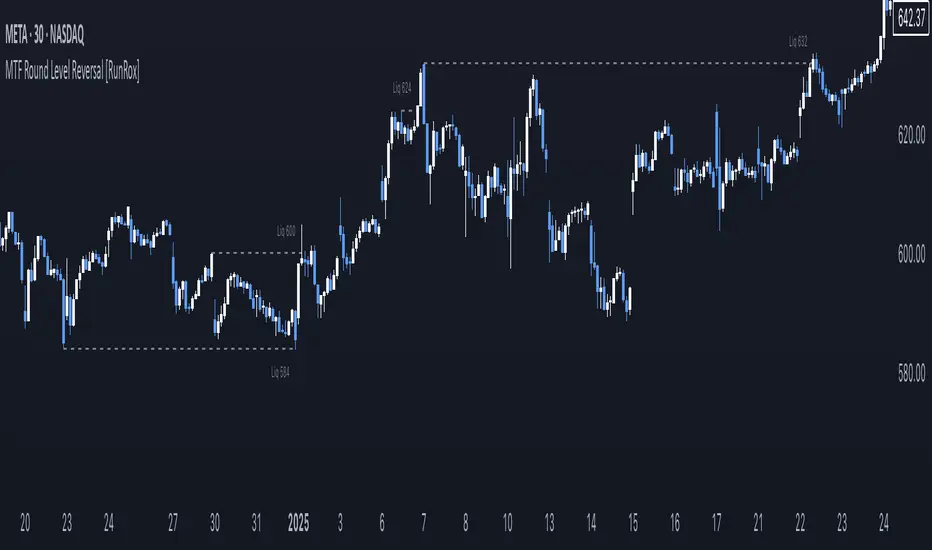
MTF Round Level Reversal [RunRox]🧲 MTF Round Level Reversal is an indicator designed to highlight price levels on the chart where the market encountered significant resistance or support at round numbers, failing to break through large clusters of orders.
In many cases, price revisits these round-number levels to absorb the remaining liquidity, offering potential reversal or continuation trade opportunities.
✏️ EXAMPLE
Here’s an example demonstrating how this indicator works and how its logic is structured:
As shown in the screenshot above, price encountered resistance at round-number levels, clearly reacting off these areas.
Afterward, the market pulled back, presenting opportunities to enter trades targeting these previously established open levels.
This logic is based on the observation that price often seeks to revisit these open round-number levels due to the residual liquidity resting there.
While effective across various markets, this indicator performs particularly well with stocks or assets priced at higher values.
For a level to appear on the chart, price must first encounter a round-number value and clearly reverse from it, leaving a visible reaction on the chart. After this occurs, the indicator will mark this level as fully formed and display it as an active reversal area.
⚙️ SETTINGS
🔷 Timeframe – Choose any timeframe from which you’d like the indicator to source level data.
🔷 Period – Defines the number of candles required on both sides (left and right) to confirm and fully form a level.
🔷 Rounding Level – Adjusts price rounding precision when detecting levels (from 0.0001 up to 5000).
🔷 Color – Customize the color and transparency of displayed levels.
🔷 Line Style – Select the desired line style for level visualization.
🔷 Label Size – Set the font size for the level labels displayed on the chart.
🔷 Move Label to the Right – Move level labels to the right side of the screen for better visibility.
🔷 Label Offset – Specifies how many bars labels should be offset from the chart’s right edge.
🔷 Delete Filled Level – Automatically removes levels from the chart after they’ve been revisited or filled.
🔷 Calculation Bars – Determines the number of recent bars considered when calculating and identifying levels.
🔶 There are numerous ways to apply this indicator in your trading strategy. You can look for trades targeting these round-number levels or identify reversal setups forming at these high-liquidity zones. The key insight is understanding that these levels represent significant liquidity areas, which price frequently revisits and retests.
We greatly appreciate your feedback and suggestions to further improve and enhance this indicator!