BTC Spot_PricesSince BTC prices are diverging, this set of 4 indicators charts volume-weighted prices for different exchanges:
Spot, Tether, Futures and South Korea.
I tried doing EUR & JPY, but the divergence is minimal so its a little pointless.
Here is the 4 links:
Cerca negli script per "Futures"
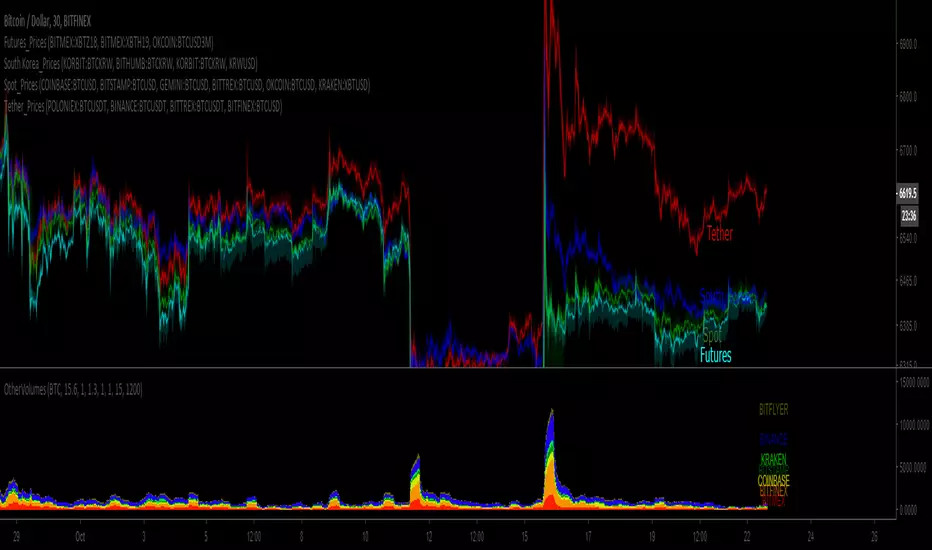
BTC Tether_PricesSince BTC prices are diverging, this set of 4 indicators charts volume-weighted prices for different exchanges:
Spot, Tether, Futures and South Korea.
I tried doing EUR & JPY, but the divergence is minimal so its a little pointless.
Here is the 4 links:

BTC Futures Settlement Dates - Life Zoltar InvestingThis is a TradingView script to map out the BTC Futures Settlement Dates. There was one floating around the internet but it was old and wasn’t updated. I took that, changed up the code and created this. Orange is CBOE and Blue is CME. You’ll notice shortly after the highlighted closed date, BTC starts to trend upwards.
Data from the below:
CBOE: cfe.cboe.com
CME: www.cmegroup.com

Premium ComparisonScript to display futures premium/discount vs basis; uses Bitmex XBTUSD 10.99% as basis vs XBTM18 and XBTU18 futures , but these are configurable.

Gold Futures Prop-Firm Strategy (GC) 1-18-2026Overview
This is a long-only, session-based, multi-regime trading strategy designed specifically for Gold futures (GC / GC1!) on intraday timeframes (typically 5–15 minutes).
The strategy aims to capture high-probability moves during the New York and Asian sessions while avoiding major economic news events and enforcing strict daily risk limits — making it suitable for prop firm challenges (e.g. FTMO, FundedNext, Apex, etc.) that require consistent profitability, limited drawdown, and disciplined risk management.
Core Philosophy
Trade longs only (shorts were removed after analysis showed they were consistently unprofitable)
Different logic depending on session and market regime (trending vs ranging)
Heavy filtering using trend strength (ADX), volume confirmation, EMA alignment, Bollinger Bands, and RSI
Strict position sizing, daily loss cap, per-session trade limits, and news blackout periods
Trailing stop mechanism to let winners run while protecting against reversals
Trading Sessions & Time Windows (Eastern Time)
NY Session: 08:30 – 15:00 ET
NY AM (trend/breakout zone): 08:30 – 11:30 ET
NY PM (mean-reversion zone): 11:30 – 15:00 ET
Asia Session (mean-reversion zone): 18:00 – 02:00 ET
News blackouts: short windows around high-impact releases (CPI/NFP, ISM/Fed, FOMC)
Entry Logic (Long Only)
NY AM – Trend Following & Breakouts (strongest trend filter)
ADX > 30 (strong trend)
Price above 200 EMA (bull regime)
Fast EMA (21) crosses above Slow EMA (55) or breakout above 20-bar high
Volume spike (> 1.4 × 20-period SMA)
Max 2 trades per NY session per day
NY PM & Asia – Mean Reversion
ADX ≤ 30 (ranging market)
Price below lower Bollinger Band (20, 2.0)
RSI < 25 (deep oversold)
No volume filter required here
Max 2 trades per Asia session per day
Risk Management Rules
Position size: Fixed 1–2 contracts (user selectable)
Initial stop: 1.7 × ATR(14) below entry (tightened from original)
Trailing stop:
Activates after price moves +1.0 × ATR in profit
Trails by 1.0 × ATR (locked-in profits aggressively)
Daily loss limit: -$600 (stops all trading for the day once hit)
No trading during defined news windows
Pyramiding disabled (only one position at a time)
No short entries (removed after backtest analysis)
Indicators Used
EMA 21 / 55 / 200 (trend direction & filter)
ATR(14) × 0.85 (volatility base)
ADX(14) threshold 30 (strong trend confirmation)
Bollinger Bands (20, 2.0) for mean-reversion entries
RSI(14) with oversold < 25
Volume spike filter (1.4× SMA) for trend/breakout entries
20-bar highest high / lowest low for breakout detection
Visual Elements on Chart
Fast (blue), Slow (orange), and Filter (red) EMAs
Bollinger Bands (gray, semi-transparent fill)
Background coloring:
Red tint during news blackout periods
Purple tint when daily loss limit is hit
Intended Use Case
Prop trading firm evaluation accounts
Conservative intraday gold trading
Focus on high-quality long setups in trending (NY AM) and mean-reverting (Asia/PM) environments
Goal: positive expectancy with controlled drawdown, suitable for passing drawdown and profit targets

Delta Hedging Pressure📊 COT Delta Hedging Pressure – Institutional Sentiment Indicator
This indicator visualizes institutional hedging pressure by aggregating delta-style positioning into a clean, session-aware sentiment framework.
Instead of guessing direction, it shows who is likely hedging vs. pressing, helping traders align intraday execution with higher-timeframe positioning.
🔍 What This Indicator Does
Calculates cumulative hedging pressure using price-based delta logic
Classifies market state into:
Bullish (positive hedge pressure)
Bearish (negative hedge pressure)
Neutral (balanced flow)
Resets cleanly by session or user-defined period
Visualizes sentiment using:
Background shading
Labels
Cumulative plots
🧠 How Traders Use It
Directional bias filter (trade only with sentiment)
Context for FVGs, liquidity raids, and pullbacks
Avoids chop by identifying neutral hedge conditions
Pairs especially well with:
XAUUSD
Index CFDs
Futures / CFD hybrids
⚙️ Key Features
Session-aware cumulative logic
Adjustable sensitivity and lookback
Clean visual design (no clutter)
Non-repainting calculations
Works on 1m → HTF
⚠️ Important Notes
This is a context tool, not a signal generator
Best used alongside price structure and risk management
Designed for discipline and alignment, not overtrading
🎯 Ideal For
Scalpers & intraday traders
Traders using:
Fair Value Gaps (FVG)
Liquidity sweeps
Session-based models
Traders transitioning from prop logic to personal capital
🧩 Final Thought
This indicator answers one question:
“Is the market hedging or pressing — and should I be aggressive or patient?”
If you trade with structure, this keeps you on the right side.

Ultimate Futures Daytrade Suite v1 - The Strategy GuideHere is the complete **Strategy Guide** translated into English.
---
# 📘 Ultimate Futures Daytrade Suite – The Strategy Guide
### 1. The Visual Legend (What is what?)
Before you trade, you need to understand the hierarchy of your lines. Not every line has the same importance.
* **🟣 Daily EMA 50 (Neon Violet):** The **"Big Boss"**. It determines the **Macro Trend**.
* *Price above:* We are primarily looking for Longs.
* *Price below:* We are primarily looking for Shorts.
* **🟢 4h EMA 50 (Neon Green):** The **"Swing Trend"**. Your most important level for **Pullback Entries** (Re-entries).
* **🟡 POC (Gold) & TPO:** The **"Magnet"**. Price often returns here.
* *Rule:* Never open a trade directly *on* the POC (Risk of "Chop"). Use it as a **Target** (Take Profit).
* **🟠 IB High/Low (Orange Lines):** The **"Daily Structure"**.
* A breakout from the IB (Initial Balance) often indicates the trend direction for the day.
* **🟥/🟩 Boxes (Supply/Demand):** Resistance and Support zones from the 1h timeframe.
* **⬜ FVG Boxes:** "Gaps" in the market that are often filled.
---
### 2. The Trading Workflow (Top-Down Method)
Go through this mental checklist before every trade:
#### Step 1: Trend Check (The Traffic Light)
Look at the **Violet Line (Daily)** and the **Green Line (4h)**.
* **Bullish:** Price is above Violet AND above Green. -> *Focus: Buy dips.*
* **Bearish:** Price is below Violet AND below Green. -> *Focus: Sell rallies.*
* **Mixed:** Price is between Violet and Green. -> *Caution! Market is undecided (Range Trading).*
#### Step 2: Location (The Context)
Where is the price currently located?
* Are we at a **Green Demand Zone**?
* Are we testing the **4h EMA 50 (Green)** from above?
* Are we at the **VWAP**?
* *Never trade in "No Man's Land"!* Wait until the price touches one of your lines.
#### Step 3: Trigger (The Execution)
Now zoom into your lower timeframe (e.g., 5min or 15min).
* Wait for a reaction at the zone.
* Use the **EMA 9 (Yellow)** as a momentum trigger. If price breaks the EMA 9 and closes above/below it, that is your "Go".
---
### 3. The Setup Blueprints
Here are the two most profitable scenarios you can trade with this script:
#### A) The "Golden Trend" Setup (Long)
* **Context:** Price > **Daily EMA (Violet)**.
* **Preparation:** Price corrects (drops) back to the **4h EMA 50 (Green)** or to the **VWAP**.
* **Confluence:** Ideally, there is also a **Demand Zone (Green Box)** or an **FVG** at that level.
* **Entry:** As soon as a candle touches the zone and closes bullish again (or reclaims the EMA 9).
* **Stop-Loss:** Below the 4h EMA 50.
* **Take-Profit:** Next **Supply Zone (Red)** or the **IB High (Orange)**.
#### B) The "Daytrade Breakout" (Intraday)
* **Context:** Price opens inside yesterday's Value Area.
* **Signal:** Price breaks through the **IB High (Orange)** with momentum.
* **Filter:** Price must be above the **VWAP**.
* **Entry:** On the retest of the IB High or directly on the breakout.
* **Target:** Price often trends in that direction for the rest of the day.
---
### 4. Warning Signals (When NOT to trade)
1. **The "Concrete Ceiling":** If you want to go Long, but the **Violet Daily EMA 50** is running directly above you. This is massive resistance. Better wait until it is broken.
2. **The "POC Dance":** If price is dancing sideways around the **Gold Line (POC)**. This is a "No-Trade Zone". Day traders lose the most money here due to fees and whipsaws.
3. **Overextension:** If price is extremely far away from the **4h EMA 50 (Green)** (Rubber Band Effect). Do not enter in the trend direction here; wait for a pullback to the line.
### Summary
Your chart is now telling you a story:
* **Violet** tells you the Direction.
* **Green** gives you the Entry.
* **Red/Green Boxes** show you the Obstacles.
* **Yellow (EMA 9)** gives you the Timing.
Good luck with the Suite! This is a setup similar to what institutional traders use.

HMA Trend Scalper V1[wjdtks255]
Overview
This indicator is a high-performance trend-following system optimized for crypto futures trading. It provides clear entry signals and dynamic, real-time risk management tools to help traders stay on the right side of the market.
Key Features
Dynamic Trend Tracking: Uses a specialized HMA (Hull Moving Average) to filter market noise and identify the core trend.
Real-time TP/SL Extension: Unlike static indicators, the Take Profit (TP) and Stop Loss (SL) lines extend candle-by-candle along with the price action.
Clean Chart UI: Lines only exist from the entry point to the current candle, preventing chart clutter.
Automatic Completion: Once the price hits a target, the line stops extending and marks the result (Target Hit or Stop Out).
Trading Strategy (How to Trade)
1. Long Entry (🚀 LONG)
Condition: The price must be above the trend line, and a breakout of the recent 5-candle high must occur with significant volume.
Action: Enter a Long position when the "🚀 LONG" label appears.
Exit: Hold until the price reaches the Cyan (Aqua) TP line or hits the Yellow SL line.
2. Short Entry (💀 SHORT)
Condition: The price must be below the trend line, and a breakdown of the recent 5-candle low must occur with significant volume.
Action: Enter a Short position when the "💀 SHORT" label appears.
Exit: Hold until the price reaches the Cyan (Aqua) TP line or hits the Yellow SL line.
3. Risk Management
Stop Loss: The indicator automatically calculates the optimal SL based on recent volatility (ATR) and swing points.
Take Profit: The TP is set at a calculated ratio to ensure a positive risk-to-reward setup.
Settings
Trend Sensitivity: Adjust the HMA length to match your preferred timeframe (Scalping vs. Swing).
Volume Multiplier: Filter out weak moves by increasing the volume breakout requirement.
Custom Styles: Fully customize line colors, widths, and styles (Solid, Dashed, Dotted) in the settings menu.

Multiple indicator for futures in scalping"Multiple indicator with:
EMA 8, 20, 50, 100, 200
Bollinger Bands
Daily, weekly, and monthly OHLC
Fibonacci pivot points R1R2R3/S1S2S3
VWAP
It works very well for futures, to see where to enter and exit, and to get positioned. I mostly use it on the Nasdaq and DAX, where the price constantly bounces in the areas marked by this indicator. It’s only for scalping, ideal on a 1-minute chart."

Binance futures Funding Rate Sentiment ZonesHello,
This script is pretty much self explanatory.
Instead of having to have Binance open to check the Funding rate for futures USDT coins, it is shown in TradingView.
There are multiple colors that are shown:
-0.05% to 0.05% = neutral funding, no color on background
-+0.05% to -+0.1% = transition zone, long/short population increasing/decreasing
-+0.1% to -+ 2% = extreme positive / negative funding, red color


Custom Daily Close Line Ver2Plots a line for the Daily closing price for Futures intraday charts.
Default closing price is 16:15 Eastern time.
Plot Line can be customized for different times based on the market.

WASDE Dates V2WASDE Dates V2 – USDA Release Calendar with Alerts, Countdown & Event Markers
By cot-trader.com
WASDE Dates V2 is a complete and reliable visualization tool for all scheduled WASDE (World Agricultural Supply and Demand Estimates) releases for 2025 and 2026.
The USDA’s WASDE report is one of the most market-moving fundamental catalysts in agricultural futures—affecting Corn (ZC), Wheat (ZW), Soybeans (ZS), Soymeal (ZM), Soybean Oil (ZL), and many related CFD products.
This script gives traders a precise timing layer directly inside their TradingView charts.
🔍 What this script does
WASDE Dates V2 automatically:
Marks each WASDE release day with a vertical line and label.
Shows an automated countdown to the next WASDE release:
In days (>24h)
In hours & minutes (<24h)
Displays an optional table of upcoming WASDE dates for quick reference.
Provides two alert conditions:
WASDE Day Alert – triggers exactly on the event
WASDE 24h Reminder – pre-alert when less than 24 hours remain
Handles both 2025 and 2026 confirmed dates.
Works on any symbol and timeframe.
📌 Why WASDE matters
The WASDE report updates global supply and demand estimates for:
Corn
Soybeans
Wheat
Other major agricultural commodities
Changes in yield, acres, production, imports/exports, and ending stocks can cause immediate and significant volatility.
Many traders combine WASDE awareness with seasonality, COT positioning, volatility filters, or fundamental models.
This script ensures you never miss the timing of these key releases.
⚙️ How the script works
The script stores official USDA WASDE release dates for 2025 and 2026 in two dedicated arrays.
On every bar, it compares the bar’s timestamp with known WASDE timestamps to detect an event day.
When an event occurs:
A red “WASDE” label is plotted above the candle
A dotted vertical line is drawn through the bar
It finds the next upcoming WASDE by scanning forward through both arrays.
A live-updating countdown label is displayed, showing days or hours/minutes until release.
If the event is less than 24 hours away:
A yellow “WASDE soon” warning appears near price
The 24h alert condition becomes active
An optional table lists upcoming events for 2025 & 2026.
This script does not generate trading signals.
It provides a time-based event layer designed to complement any discretionary or algorithmic trading approach.
🧭 How to use
Add the script to your chart.
Enable alerts for:
“WASDE Day Alert”
“WASDE 24h Reminder”
Follow the countdown to prepare for upcoming volatility.
Use together with other agricultural tools such as:
Seasonality indicators
COT (Commitment of Traders) analysis
Trend / VWAP / Volume signals
Pre- and post-WASDE trading strategies
Works on all chart types, all symbols, and all timeframes.
📅 Included WASDE Dates (Confirmed)
2025:
Jan 12, Feb 11, Mar 11, Apr 10, May 12, Jun 12, Jul 11, Aug 12, Sep 12, Oct 9, Nov 10, Dec 9
2026:
Jan 12, Feb 10, Mar 10, Apr 9, May 12, Jun 11, Jul 10, Aug 12, Sep 11, Oct 9, Nov 10, Dec 10
(All dates based on USDA’s official 12:00pm ET schedule.)
💡 What makes this script original
Fully updated 2025 + 2026 calendar
Uses a robust time-comparison method for accurate marking
Unique dual alert system (event + 24h pre-alert)
Clean, readable layout with countdown + upcoming dates table
Tailored specifically for grain & agricultural traders
Built entirely in Pine Script v6 with careful attention to performance

Weekly Futures VWAP (Major Indices) - StableAutomatically puts the VWAP anchor on Sunday opening of futures at 16:00, you are able to toggle on/off VWAP bands and of course enter alerts

Nifty Futures Momentum ScalperNifty Futures Momentum Scalper
Backtesting
VPA , RSI, momentum trades with EMA crossover

Aggregated Open Interest Multi-Exchange (USD)This indicator aggregates Open Interest (OI) data from multiple major cryptocurrency exchanges into a single unified view in USD, using data available on TradingView. It automatically adapts to the asset you're viewing on the chart.
Features:
Aggregates OI from 7 major exchanges: Binance, Bybit, OKX, Bitget, Deribit, HTX, and Coinbase
All values converted to USD - unlike native OI which shows contracts/coins
Uses only data available on TradingView platform
Automatically detects the asset from your chart (BTC, ETH, SOL, etc.)
True apples-to-apples comparison across exchanges
Displays as candlesticks showing OI open, high, low, and close
Toggle exchanges on/off individually
Handles different contract types per exchange automatically
Why USD conversion matters:
Traditional OI indicators show values in contracts or crypto units, making it difficult to compare across exchanges. This indicator converts everything to USD, giving you the real dollar value of open positions across all exchanges.
How it works:
Simply add the indicator to any crypto perpetual futures chart. It will automatically fetch and aggregate OI data from all supported exchanges for that asset using TradingView's built-in data feeds, converting everything to USD.
Supported Exchanges:
Binance, Bybit, Bitget, HTX: USDT perpetuals
Deribit: BTC/ETH use USD contracts, others use USDC
OKX: Contract-based (automatically converted)
Coinbase: USDC perpetuals
Perfect for traders who want a comprehensive view of total market Open Interest in USD across exchanges using reliable TradingView data.

BOCS AdaptiveBOCS Adaptive Strategy - Automated Volatility Breakout System
WHAT THIS STRATEGY DOES:
This is an automated trading strategy that detects consolidation patterns through volatility analysis and executes trades when price breaks out of these channels. Take-profit and stop-loss levels are calculated dynamically using Average True Range (ATR) to adapt to current market volatility. The strategy closes positions partially at the first profit target and exits the remainder at the second target or stop loss.
TECHNICAL METHODOLOGY:
Price Normalization Process:
The strategy begins by normalizing price to create a consistent measurement scale. It calculates the highest high and lowest low over a user-defined lookback period (default 100 bars). The current close price is then normalized using the formula: (close - lowest_low) / (highest_high - lowest_low). This produces values between 0 and 1, allowing volatility analysis to work consistently across different instruments and price levels.
Volatility Detection:
A 14-period standard deviation is applied to the normalized price series. Standard deviation measures how much prices deviate from their average - higher values indicate volatility expansion, lower values indicate consolidation. The strategy uses ta.highestbars() and ta.lowestbars() functions to track when volatility reaches peaks and troughs over the detection length period (default 14 bars).
Channel Formation Logic:
When volatility crosses from a high level to a low level, this signals the beginning of a consolidation phase. The strategy records this moment using ta.crossover(upper, lower) and begins tracking the highest and lowest prices during the consolidation. These become the channel boundaries. The duration between the crossover and current bar must exceed 10 bars minimum to avoid false channels from brief volatility spikes. Channels are drawn using box objects with the recorded high/low boundaries.
Breakout Signal Generation:
Two detection modes are available:
Strong Closes Mode (default): Breakout occurs when the candle body midpoint math.avg(close, open) exceeds the channel boundary. This filters out wick-only breaks.
Any Touch Mode: Breakout occurs when the close price exceeds the boundary.
When price closes above the upper channel boundary, a bullish breakout signal generates. When price closes below the lower boundary, a bearish breakout signal generates. The channel is then removed from the chart.
ATR-Based Risk Management:
The strategy uses request.security() to fetch ATR values from a specified timeframe, which can differ from the chart timeframe. For example, on a 5-minute chart, you can use 1-minute ATR for more responsive calculations. The ATR is calculated using ta.atr(length) with a user-defined period (default 14).
Exit levels are calculated at the moment of breakout:
Long Entry Price = Upper channel boundary
Long TP1 = Entry + (ATR × TP1 Multiplier)
Long TP2 = Entry + (ATR × TP2 Multiplier)
Long SL = Entry - (ATR × SL Multiplier)
For short trades, the calculation inverts:
Short Entry Price = Lower channel boundary
Short TP1 = Entry - (ATR × TP1 Multiplier)
Short TP2 = Entry - (ATR × TP2 Multiplier)
Short SL = Entry + (ATR × SL Multiplier)
Trade Execution Logic:
When a breakout occurs, the strategy checks if trading hours filter is satisfied (if enabled) and if position size equals zero (no existing position). If volume confirmation is enabled, it also verifies that current volume exceeds 1.2 times the 20-period simple moving average.
If all conditions are met:
strategy.entry() opens a position using the user-defined number of contracts
strategy.exit() immediately places a stop loss order
The code monitors price against TP1 and TP2 levels on each bar
When price reaches TP1, strategy.close() closes the specified number of contracts (e.g., if you enter with 3 contracts and set TP1 close to 1, it closes 1 contract). When price reaches TP2, it closes all remaining contracts. If stop loss is hit first, the entire position exits via the strategy.exit() order.
Volume Analysis System:
The strategy uses ta.requestUpAndDownVolume(timeframe) to fetch up volume, down volume, and volume delta from a specified timeframe. Three display modes are available:
Volume Mode: Shows total volume as bars scaled relative to the 20-period average
Comparison Mode: Shows up volume and down volume as separate bars above/below the channel midline
Delta Mode: Shows net volume delta (up volume - down volume) as bars, positive values above midline, negative below
The volume confirmation logic compares breakout bar volume to the 20-period SMA. If volume ÷ average > 1.2, the breakout is classified as "confirmed." When volume confirmation is enabled in settings, only confirmed breakouts generate trades.
INPUT PARAMETERS:
Strategy Settings:
Number of Contracts: Fixed quantity to trade per signal (1-1000)
Require Volume Confirmation: Toggle to only trade signals with volume >120% of average
TP1 Close Contracts: Exact number of contracts to close at first target (1-1000)
Use Trading Hours Filter: Toggle to restrict trading to specified session
Trading Hours: Session input in HHMM-HHMM format (e.g., "0930-1600")
Main Settings:
Normalization Length: Lookback bars for high/low calculation (1-500, default 100)
Box Detection Length: Period for volatility peak/trough detection (1-100, default 14)
Strong Closes Only: Toggle between body midpoint vs close price for breakout detection
Nested Channels: Allow multiple overlapping channels vs single channel at a time
ATR TP/SL Settings:
ATR Timeframe: Source timeframe for ATR calculation (1, 5, 15, 60, etc.)
ATR Length: Smoothing period for ATR (1-100, default 14)
Take Profit 1 Multiplier: Distance from entry as multiple of ATR (0.1-10.0, default 2.0)
Take Profit 2 Multiplier: Distance from entry as multiple of ATR (0.1-10.0, default 3.0)
Stop Loss Multiplier: Distance from entry as multiple of ATR (0.1-10.0, default 1.0)
Enable Take Profit 2: Toggle second profit target on/off
VISUAL INDICATORS:
Channel boxes with semi-transparent fill showing consolidation zones
Green/red colored zones at channel boundaries indicating breakout areas
Volume bars displayed within channels using selected mode
TP/SL lines with labels showing both price level and distance in points
Entry signals marked with up/down triangles at breakout price
Strategy status table showing position, contracts, P&L, ATR values, and volume confirmation status
HOW TO USE:
For 2-Minute Scalping:
Set ATR Timeframe to "1" (1-minute), ATR Length to 12, TP1 Multiplier to 2.0, TP2 Multiplier to 3.0, SL Multiplier to 1.5. Enable volume confirmation and strong closes only. Use trading hours filter to avoid low-volume periods.
For 5-15 Minute Day Trading:
Set ATR Timeframe to match chart or use 5-minute, ATR Length to 14, TP1 Multiplier to 2.0, TP2 Multiplier to 3.5, SL Multiplier to 1.2. Volume confirmation recommended but optional.
For Hourly+ Swing Trading:
Set ATR Timeframe to 15-30 minute, ATR Length to 14-21, TP1 Multiplier to 2.5, TP2 Multiplier to 4.0, SL Multiplier to 1.5. Volume confirmation optional, nested channels can be enabled for multiple setups.
BACKTEST CONSIDERATIONS:
Strategy performs best during trending or volatility expansion phases
Consolidation-heavy or choppy markets produce more false signals
Shorter timeframes require wider stop loss multipliers due to noise
Commission and slippage significantly impact performance on sub-5-minute charts
Volume confirmation generally improves win rate but reduces trade frequency
ATR multipliers should be optimized for specific instrument characteristics
COMPATIBLE MARKETS:
Works on any instrument with price and volume data including forex pairs, stock indices, individual stocks, cryptocurrency, commodities, and futures contracts. Requires TradingView data feed that includes volume for volume confirmation features to function.
KNOWN LIMITATIONS:
Stop losses execute via strategy.exit() and may not fill at exact levels during gaps or extreme volatility
request.security() on lower timeframes requires higher-tier TradingView subscription
False breakouts inherent to breakout strategies cannot be completely eliminated
Performance varies significantly based on market regime (trending vs ranging)
Partial closing logic requires sufficient position size relative to TP1 close contracts setting
RISK DISCLOSURE:
Trading involves substantial risk of loss. Past performance of this or any strategy does not guarantee future results. This strategy is provided for educational purposes and automated backtesting. Thoroughly test on historical data and paper trade before risking real capital. Market conditions change and strategies that worked historically may fail in the future. Use appropriate position sizing and never risk more than you can afford to lose. Consider consulting a licensed financial advisor before making trading decisions.
ACKNOWLEDGMENT & CREDITS:
This strategy is built upon the channel detection methodology created by AlgoAlpha in the "Smart Money Breakout Channels" indicator. Full credit and appreciation to AlgoAlpha for pioneering the normalized volatility approach to identifying consolidation patterns and sharing this innovative technique with the TradingView community. The enhancements added to the original concept include automated trade execution, multi-timeframe ATR-based risk management, partial position closing by contract count, volume confirmation filtering, and real-time position monitoring.

NDX Ladder → Adjusted to Active Ticker (5s & 10s)This indicator allows you to a grid of NDX levels directly on the NQ! (E-mini NASDAQ 100 Futures) chart, automatically adjusting for the spread between NDX and NQ1!. This is particularly useful for traders who perform technical analysis on SPX but execute trades on NQ1!.
Features:
Renders every 5 and 10 points steps of the NDX in your current chart.
The script adjusts these levels in real-time based on the current spread between NDX and NQ / MNQ
Plots updated horizontal lines that move with the spread

Nova Futures PRO (SAFE v6) — HTF + Choppiness + CooldownNova Futures PRO (SAFE v6) — HTF + Choppiness + Cooldown

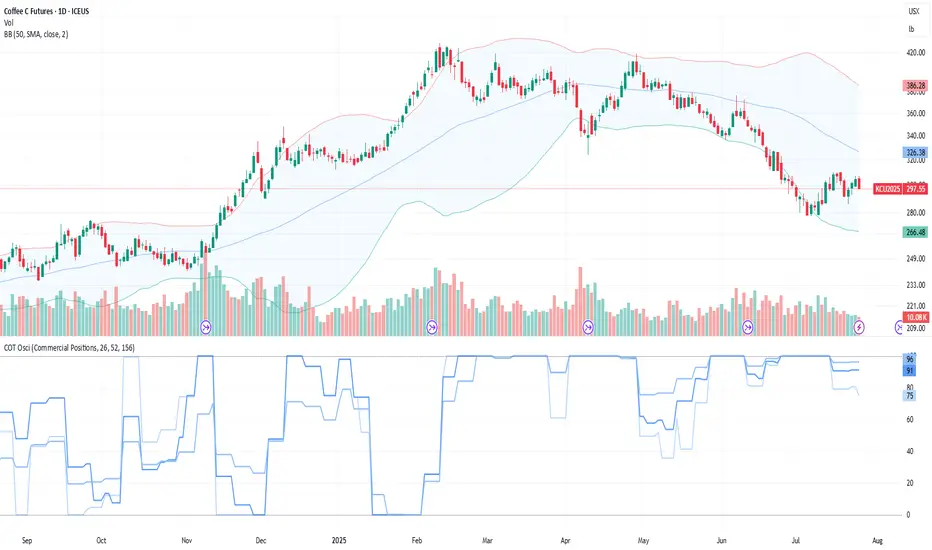
COT Comm OsciDescription
The COT Comm Osci is a sentiment oscillator based on net positions from the weekly Commitments of Traders (COT) report.
It transforms net positions of Commercials, Noncommercials, or Nonreportables into a 0–100 index.
A value of 100 = highest net position within the selected timeframe.
A value of 0 = lowest net position.
You can define three historical intervals (e.g. 26/ 52 / 156 weeks).
Tip
To improve your analysis, it's recommended to add a separate COT indicator that visualizes raw Long/Short or net positions directly. This helps interpret the oscillator in context.
This script is based on “Commercial Index–Buschi” by MagicEins and has been extended with new features and error handling.
Features
Select between Commercial, Noncommercial, or Nonreportable trader groups
Proper handling of HG Futures (Copper)
Displays a warning if the root code is invalid (unsupported market symbol)
ORB Norman (2 Sessions, Auto Timezone)ORB Norman (2 Sessions, Auto Timezone)
This script plots Opening Range Breakout (ORB) levels for two configurable sessions. It’s designed for intraday traders—especially in futures markets like Gold (GC), Nasdaq (NQ), and S&P (ES)—who trade based on early session breakouts or range rejections. Unlike standard indicators, this tool auto-adjusts for timezones based on the instrument, ensuring precise session alignment.
Features:
Automatically adjusts for NQ/ES (Chicago time) and GC (New York time) based on the symbol.
Plots high, low, and optional midpoint lines for each session.
Clean, minimal settings with visual separation for better usability.
Ray extension length is fully customizable.
Works on any intraday chart (recommended: 5–15 minute timeframes).
Includes customizable session times, colors, ray length, and an optional midpoint line.
Default Sessions:
Session 1:
‣ 07:00–08:00 EST for GC
‣ 06:00–07:00 CT for NQ/ES
Session 2:
‣ 09:30–09:45 EST for GC
‣ 08:30–08:45 CT for NQ/ES
This tool is ideal for traders who scalp the early morning breakout or look for range rejections based on the opening auction.
This script was developed from scratch based on the author's own intraday trading needs.

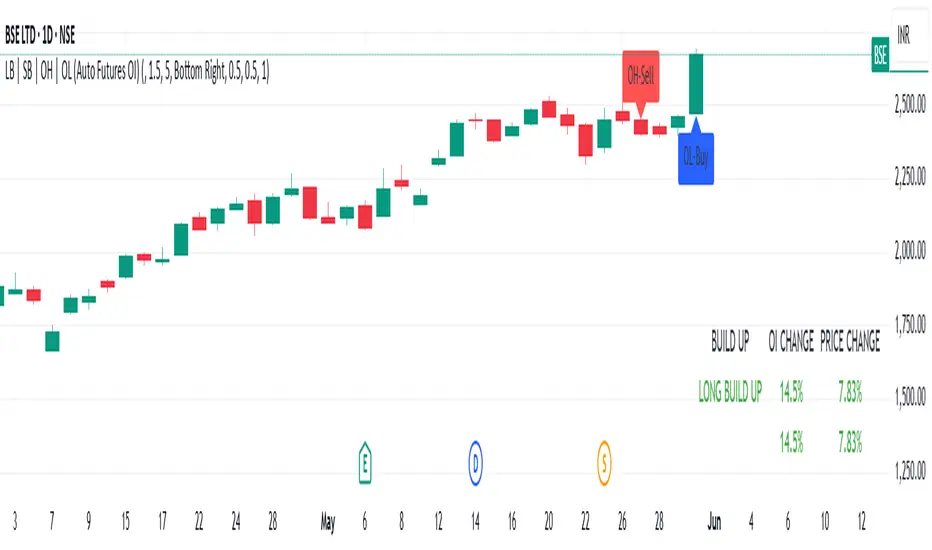
LB | SB | OH | OL (Auto Futures OI)This indicator is for trading purposes, particularly in futures markets given the inclusion of open interest (OI) data.
Indicator Name and Overlay: The indicator is named "LB | SB | OH | OL" and is set to overlay on the price chart (overlay=true).
Override Symbol Input: Users can input a symbol to override the default symbol for analysis.
Open Interest Data Retrieval: It retrieves open interest data for the specified symbol and time frame. If no data is found, it generates a runtime error.
Dashboard Configuration: Users can choose to display a dashboard either at the top right, bottom right, or bottom left of the chart.
Calculations:
It calculates the percentage change in open interest (oi_change).
It calculates the percentage change in price compared to the previous day's close (price_change).
Build Up Conditions:
Long Build Up: When there's a significant increase in open interest (OIChange threshold) and price rises (PriceChange threshold).
Short Build Up: When there's a significant increase in open interest (OIChange threshold) and price falls (PriceChange threshold).
Display Table:
It creates a table on the chart showing the build-up conditions, open interest change percentage, and price change percentage.
Labeling:
It allows for the labeling of buy and sell conditions based on price movements.
Overall, this indicator provides a visual representation of open interest and price movements, helping traders identify potential trading opportunities based on build-up conditions and price behavior.
The "LB | SB | OH | OL" indicator is a tool designed to assist traders in analyzing price movements and open interest (OI) changes in FNO markets. This indicator combines various elements to provide insights into long build-up (LB), short build-up (SB), open-high (OH), and open-low (OL) scenarios.
Key features of the indicator include:
Override Symbol Input: Traders can override the default symbol and input their preferred symbol for analysis.
Open Interest Data: The indicator retrieves open interest data for the selected symbol and time frame, facilitating analysis based on changes in open interest.
Dashboard: The indicator features a customizable dashboard that displays key information such as build-up conditions, OI change, and price change.
Build-Up Conditions: The indicator identifies long build-up and short build-up scenarios based on user-defined thresholds for OI change and price change percentages.
Customization Options: Traders have the flexibility to customize various aspects of the indicator, including colors for long build-up, short build-up, positive OI change, negative OI change, positive price change, and negative price change.
Label Plots: Buy and sell labels are plotted on the chart to highlight potential trading opportunities. Traders can customize the colors and text colors of these labels based on their preferences.
Overall, the "LB | SB | OH | OL" indicator offers traders a comprehensive tool for analyzing price movements and open interest changes, helping them make informed trading decisions in the FNO markets.
CME Futures RTH net change % levelsRTH Session time calculated for AMERICAN FUTURES ONLY.
Plots the net change % from the last session's RTH close, a.k.a daily % change for that specific instrument. Best used as support and resistance zones in confluence with other analysis, and also serve as a gauge for how volatile the session is.
