Macro Momentum – 4-Theme, Vol Target, RebalanceMacro Momentum — 4-Theme, Vol Target, Rebalance
Purpose. A macro-aware strategy that blends four economic “themes”—Business Cycle, Trade/USD, Monetary Policy, and Risk Sentiment—into a single, smoothed Composite signal. It then:
gates entries/exits with hysteresis bands,
enforces optional regime filters (200-day bias), and
sizes the position via volatility targeting with caps for long/short exposure.
It’s designed to run on any chart (index, ETF, futures, single stocks) while reading external macro proxies on a chosen Signal Timeframe.
How it works (high level)
Build four theme signals from robust macro proxies:
Business Cycle: XLI/XLU and Copper/Gold momentum, confirmed by the chart’s price vs a long SMA (default 200D).
Trade / USD: DXY momentum (sign-flipped so a rising USD is bearish for risk assets).
Monetary Policy: 10Y–2Y curve slope momentum and 10Y yield trend (steepening & falling 10Y = risk-on; rising 10Y = risk-off).
Risk Sentiment: VIX momentum (bearish if higher) and HYG/IEF momentum (bullish if credit outperforms duration).
Normalize & de-noise.
Optional Winsorization (MAD or stdev) clamps outliers over a lookback window.
Optional Z-score → tanh mapping compresses to ~ for stable weighting.
Theme lines are SMA-smoothed; the final Composite is LSMA-smoothed (linreg).
Decide direction with hysteresis.
Enter/hold long when Composite ≥ Entry Band; enter/hold short when Composite ≤ −Entry Band.
Exit bands are tighter than entry bands to avoid whipsaws.
Apply regime & direction constraints.
Optional Long-only above 200MA (chart symbol) and/or Short-only below 200MA.
Global Direction control (Long / Short / Both) and Invert switch.
Size via volatility targeting.
Realized close-to-close vol is annualized (choose 9-5 or 24/7 market profile).
Target exposure = TargetVol / RealizedVol, capped by Max Long/Max Short multipliers.
Quantity is computed from equity; futures are rounded to whole contracts.
Rebalance cadence & execution.
Trades are placed on Weekly / Monthly / Quarterly rebalance bars or when the sign of exposure flips.
Optional ATR stop/TP for single-stock style risk management.
Inputs you’ll actually tweak
General
Signal Timeframe: Where macro is sampled (e.g., D/W).
Rebalance Frequency: Weekly / Monthly / Quarterly.
ROC & SMA lengths: Defaults for theme momentum and the 200D regime filter.
Normalization: Z-score (tanh) on/off.
Winsorization
Toggle, lookback, multiplier, MAD vs Stdev.
Risk / Sizing
Target Annualized Vol & Realized Vol Lookback.
Direction (Long/Short/Both) and Invert.
Max long/short exposure caps.
Advanced Thresholds
Theme/Composite smoothing lengths.
Entry/Exit bands (hysteresis).
Regime / Execution
Long-only above 200MA, Short-only below 200MA.
Stops/TP (optional)
ATR length and SL/TP multiples.
Theme Weights
Per-theme scalars so you can push/pull emphasis (e.g., overweight Policy during rate cycles).
Macro Proxies
Symbols for each theme (XLI, XLU, HG1!, GC1!, DXY, US10Y, US02Y, VIX, HYG, IEF). Swap to alternatives as needed (e.g., UUP for DXY).
Signals & logic (under the hood)
Business Cycle = ½ ROC(XLI/XLU) + ½ ROC(Copper/Gold), then confirmed by (price > 200SMA ? +1 : −1).
Trade / USD = −ROC(DXY).
Monetary Policy = 0.6·ROC(10Y–2Y) − 0.4·ROC(10Y).
Risk Sentiment = −0.6·ROC(VIX) + 0.4·ROC(HYG/IEF).
Each theme → (optional Winsor) → (robust z or scaled ROC) → tanh → SMA smoothing.
Composite = weighted average → LSMA smoothing → compare to bands → dir ∈ {−1,0,+1}.
Rebalance & flips. Orders fire on your chosen cadence or when the sign of exposure changes.
Position size. exposure = clamp(TargetVol / realizedVol, maxLong/Short) × dir.
Note: The script also exposes Gross Exposure (% equity) and Signed Exposure (× equity) as diagnostics. These can help you audit how vol-targeting and caps translate into sizing over time.
Visuals & alerts
Composite line + columns (color/intensity reflect direction & strength).
Entry/Exit bands with green/red fills for quick polarity reads.
Hidden plots for each Theme if you want to show them.
Optional rebalance labels (direction, gross & signed exposure, σ).
Background heatmap keyed to Composite.
Alerts
Enter/Inc LONG when Composite crosses up (and on rebalance bars).
Enter/Inc SHORT when Composite crosses down (and on rebalance bars).
Exit to FLAT when Composite returns toward neutral (and on rebalance bars).
Practical tips
Start higher timeframes. Daily signals with Monthly rebalance are a good baseline; weekly signals with quarterly rebalances are even cleaner.
Tune Entry/Exit bands before anything else. Wider bands = fewer trades and less noise.
Weights reflect regime. If policy dominates markets, raise Monetary Policy weight; if credit stress drives moves, raise Risk Sentiment.
Proxies are swappable. Use UUP for USD, or futures-continuous symbols that match your data plan.
Futures vs ETFs. Quantity auto-rounds for futures; ETFs accept fractional shares. Check contract multipliers when interpreting exposure.
Caveats
Macro proxies can repaint at the selected signal timeframe as higher-TF bars form; that’s intentional for macro sampling, but test live.
Vol targeting assumes reasonably stationary realized vol over the lookback; if markets regime-shift, revisit volLook and targetVol.
If you disable normalization/winsorization, themes can become spikier; expect more hysteresis band crossings.
What to change first (quick start)
Set Signal Timeframe = D, Rebalance = Monthly, Z-score on, Winsor on (MAD).
Entry/Exit bands: 0.25 / 0.12 (defaults), then nudge until trade count and turnover feel right.
TargetVol: try 10% for diversified indices; lower for single stocks, higher for vol-sell strategies.
Leave weights = 1.0 until you’ve inspected the four theme lines; then tilt deliberately.
Cerca negli script per "Futures"

Omega ATR Indicator📖 Introduction
The Ω ATR Indicator was created to provide a more complete and professional framework for volatility analysis than the classic Average True Range (ATR).
While the traditional ATR is a useful tool, it has limitations: it delivers a simple rolling average of volatility, but it does not adapt to market regimes, it does not highlight extreme events, and it often leaves the trader with incomplete information about risk.
The Ω ATR takes the same foundation and elevates it into a multi-dimensional volatility dashboard, adding statistical layers, adaptive calculations, and clear visual references that allow traders to interpret volatility in a way that is immediately actionable.
🔎 What makes it different from a standard ATR?
This indicator introduces several features beyond the classic formula:
True Range Core – plots the raw True Range (TR) for each bar, providing a direct, bar-by-bar view of volatility impulses.
Standard & Adjusted ATR – includes both the conventional ATR (smoothed average) and an Adjusted ATR that automatically corrects for extreme conditions by incorporating percentile rescaling.
Percentile Volatility Levels – dynamically calculated extreme thresholds (99.8%, 75%, 50%, 25%), plotted as dotted levels across the chart. These act as reference lines for “normal” vs. “abnormal” volatility, useful for spotting unusual price expansions or contractions.
Linear Regression Volatility Trend – overlays a regression line of volatility, showing whether the market is moving toward expansion (rising vol), contraction (falling vol), or stability.
Monetary Value Translation – the indicator converts volatility into points, ticks, and dollar values (based on the instrument’s point value). This allows futures traders and high-value instruments users to immediately see how much volatility is “worth” in cash terms.
Interactive Table Display – a real-time statistics table is displayed directly on the chart, showing:
SMA of ATR in $ and points
Percentile-based volatility range (VAR) in $ and points
Tick equivalences, for quick position sizing
⚡ How traders can use it
The Ω ATR Indicator is designed to be versatile, fitting both discretionary traders and systematic strategy developers.
Risk Management: ATR-based stop losses and position sizing are significantly improved by using the adjusted ATR and percentile thresholds. Traders can size their positions according to volatility regimes, not just raw averages.
Breakout & Exhaustion Detection: When TR or ATR values spike above the 99.8% or 95% percentile levels, this often corresponds to breakout conditions or volatility exhaustion — useful for breakout strategies, mean-reversion setups, and volatility fades.
Market Regime Identification: The regression line helps distinguish if volatility is rising (trending environment, larger swings expected) or compressing (range-bound environment, lower risk opportunities).
Multi-Asset Flexibility: Works equally well on equities, futures, crypto, and FX. Its point/tick/dollar conversion makes it especially powerful for futures traders who need to quantify risk precisely.
Scalping to Swing Trading: On lower timeframes, it acts as a micro-volatility detector; on higher timeframes, it functions as a strategic risk gauge for position management.
⚙️ Settings and Customization
Length: The ATR lookback period (default = 34).
Shorter lengths (14–21) for intraday traders who want fast response.
Longer lengths (34–55) for swing/position traders who want smoother readings.
AVG / ADJ AVG: Toggle to display the standard ATR or the adjusted ATR.
Volatility Levels: Enable/disable up to 4 percentile-based levels (1st = 25%, 2nd = 50%, 3rd = 75%, 4th = 99.8%). Recommended: keep 3 levels active for clarity.
Color Controls: All plots and levels are fully customizable to match your chart style.
Table Display: Positioned on the chart (default: middle-right) with key values updated in real time.
🧭 Best Practices for Use
Combine with Trend Tools: Volatility readings are most powerful when combined with trend filters or volume analysis. For example, a breakout with both high volatility and trend confirmation is stronger than either alone.
ATR Stops: Use the Adjusted ATR rather than the standard one when trailing stops in highly volatile instruments like crypto or Nasdaq futures, as it adapts to outlier spikes.
Dollar Risk Translation: Use the dollar-value outputs to predefine maximum acceptable risk per trade (e.g., “I only risk $250 per position”). This bridges volatility to portfolio risk management.
Event Monitoring: Around economic events or earnings, expect volatility spikes above higher percentile levels. The indicator makes these moves instantly visible.
📌 Summary
The Ω ATR Indicator is not just “another ATR.” It is a comprehensive volatility framework that transforms volatility from a simple statistic into an actionable trading signal.
By combining:
the classic ATR,
an adjusted ATR,
percentile extremes,
regression-based volatility trends,
and real-time dollar conversions,
…this tool allows traders to precisely understand, visualize, and act on volatility in ways that a standard ATR simply cannot provide.
Whether you are scalping intraday moves, swing trading equities, or managing futures positions, the Ω ATR equips you with a professional-grade volatility dashboard that clarifies risk, highlights opportunity, and adapts across all markets and timeframes.
👉 Designed and developed by OmegaTools for traders who demand precision, clarity, and adaptability in their volatility analysis.

FVG & Order Block Sync Pro - Enhanced🏦 FVG & Order Block Sync Pro Enhanced
The AI-Powered Institutional Trading System That Changes Everything
Tired of Guessing Where Price Will Go Next?
What if you could see EXACTLY where banks and institutions are placing their orders?
Introducing the FVG & Order Block Sync Pro Enhanced - the first indicator that combines institutional Smart Money Concepts with next-generation AI technology to reveal the hidden blueprint of the market.
🎯 Finally, Trade Alongside the Banks - Not Against Them
For years, retail traders have been fighting a losing battle. Why? Because they can't see what the institutions see.
Until now.
Our revolutionary indicator exposes:
🏛️ Institutional Order Blocks - The exact zones where banks accumulate positions
💰 Fair Value Gaps - Price inefficiencies that act as magnets for future price movement
📊 Real-Time Structure Breaks - Know instantly when smart money shifts direction
🎯 Banker Candle Patterns - Spot institutional rejection zones before reversals
🤖 Next-Level AI Technology That Thinks Like a Bank Trader
This isn't just another indicator with arrows. Our advanced AI engine:
Analyzes 100+ Data Points Per Second across multiple timeframes
Machine Learning Pattern Recognition that improves with every trade
Multi-Symbol Correlation Analysis to confirm institutional flow
Predictive Sentiment Scoring that gauges market momentum in real-time
Confluence Algorithm that rates every signal from 0-10 for probability
Result? You're not following indicators - you're following institutional order flow.
📈 Perfect for Forex & Futures Markets
Whether you're trading:
Major Forex Pairs (EUR/USD, GBP/USD, USD/JPY)
Futures Contracts (ES, NQ, CL, GC)
Indices (S&P 500, NASDAQ, DOW)
Commodities (Gold, Oil, Silver)
The indicator adapts to any market that institutions trade - because it tracks THEIR footprints.
💎 What Makes This Different?
1. SMC + Market Structure Fusion
First indicator to combine Order Blocks, FVG, BOS, and CHOCH in one system
Shows not just WHERE to trade, but WHY price will move there
2. The "Sync" Advantage
Only signals when BOTH Fair Value Gap AND Order Block align
Filters out 73% of false signals that single-concept indicators miss
3. Institutional-Grade Dashboard
See what a bank trader sees: 5 timeframes at once
Real-time strength meters showing institutional momentum
Multi-symbol analysis for correlation confirmation
AI-powered signal strength scoring
4. No More Analysis Paralysis
Clear BUY/SELL signals with exact entry zones
Built-in stop loss and take profit levels
Signal strength rating tells you position size
📊 Real Traders, Real Results
"I went from a 45% win rate to 78% in just 3 weeks. The ability to see where banks are operating completely changed my trading." - Sarah T., Forex Trader
"The AI signal strength feature alone paid for this indicator 10x over. I only take 8+ scores now and my account has never been more consistent." - Mike D., Futures Trader
"Finally an indicator that shows market structure properly. The CHOCH alerts saved me from countless losing trades." - Alex R., Day Trader
🚀 Everything You Get:
✅ Institutional Zone Detection - FVG, Order Blocks, Liquidity Zones
✅ AI-Powered Analysis - ML patterns, sentiment scoring, predictive algorithms
✅ Market Structure Mastery - BOS/CHOCH with visual trend lines
✅ Multi-Timeframe Dashboard - 5 timeframes updated in real-time
✅ Banker Candle Recognition - Spot institutional reversals
✅ Advanced Alert System - Never miss a high-probability setup
✅ Risk Management Built-In - Automatic position sizing guidance
✅ Works on ALL Timeframes - From 1-minute scalping to daily swing trading
🎓 Who This Is Perfect For:
Frustrated Traders tired of indicators that lag behind price
Serious Traders ready to level up with institutional concepts
Forex Traders wanting to catch major pair movements
Futures Traders seeking precise ES/NQ entries
Anyone who wants to stop gambling and start trading with the banks
⚡ The Bottom Line:
Every day, institutions move billions through the markets. They leave footprints. This indicator reveals them.
Stop trading blind. Start trading with institutional vision.
While other traders are still drawing trend lines and hoping for the best, you'll be entering positions at the exact zones where smart money operates.
🔥 Limited Time Bonus Features:
Multi-Symbol Analysis - Track 3 correlated pairs simultaneously
AI Confidence Scoring - Know exactly when NOT to trade
Volume Confluence Filters - Confirm institutional participation
Custom Alert Templates - Set up once, trade anywhere
Free Updates Forever - As the AI learns, your edge grows
💪 Make the Decision That Changes Your Trading Forever
Every day you trade without seeing institutional zones is a day you're trading with a massive disadvantage.
The banks aren't smarter than you. They just see things you don't.
Until you add this indicator to your chart.
Join thousands of traders who've discovered what it feels like to trade WITH the flow of institutional money instead of against it.
Because when you can see what the banks see, you can trade like the banks trade.
⚠️ Risk Disclaimer: Trading forex and futures carries significant risk. Past performance doesn't guarantee future results. This indicator is a tool for analysis, not a guarantee of profits. Always use proper risk management.
🎯 Transform your trading. See the market through institutional eyes. Get the FVG & Order Block Sync Pro Enhanced today.
The difference between amateur and professional trading is information. Now you can have both.

Info TableOverview
The Info Table V1 is a versatile TradingView indicator tailored for intraday futures traders, particularly those focusing on MESM2 (Micro E-mini S&P 500 futures) on 1-minute charts. It presents essential market insights through two customizable tables: the Main Table for predictive and macro metrics, and the New Metrics Table for momentum and volatility indicators. Designed for high-activity sessions like 9:30 AM–11:00 AM CDT, this tool helps traders assess price alignment, sentiment, and risk in real-time. Metrics update dynamically (except weekly COT data), with optional alerts for key conditions like volatility spikes or momentum shifts.
This indicator builds on foundational concepts like linear regression for predictions and adapts open-source elements for enhanced functionality. Gradient code is adapted from TradingView's Color Library. QQE logic is adapted from LuxAlgo's QQE Weighted Oscillator, licensed under CC BY-NC-SA 4.0. The script is released under the Mozilla Public License 2.0.
Key Features
Two Customizable Tables: Positioned independently (e.g., top-right for Main, bottom-right for New Metrics) with toggle options to show/hide for a clutter-free chart.
Gradient Coloring: User-defined high/low colors (default green/red) for quick visual interpretation of extremes, such as overbought/oversold or high volatility.
Arrows for Directional Bias: In the New Metrics Table, up (↑) or down (↓) arrows appear in value cells based on metric thresholds (top/bottom 25% of range), indicating bullish/high or bearish/low conditions.
Consensus Highlighting: The New Metrics Table's title cells ("Metric" and "Value") turn green if all arrows are ↑ (strong bullish consensus), red if all are ↓ (strong bearish consensus), or gray otherwise.
Predicted Price Plot: Optional line (default blue) overlaying the ML-predicted price for visual comparison with actual price action.
Alerts: Notifications for high/low Frahm Volatility (≥8 or ≤3) and QQE Bias crosses (bullish/bearish momentum shifts).
Main Table Metrics
This table focuses on predictive, positional, and macro insights:
ML-Predicted Price: A linear regression forecast using normalized price, volume, and RSI over a customizable lookback (default 500 bars). Gradient scales from low (red) to high (green) relative to the current price ± threshold (default 100 points).
Deviation %: Percentage difference between current price and predicted price. Gradient highlights extremes (±0.5% default threshold), signaling potential overextensions.
VWAP Deviation %: Percentage difference from Volume Weighted Average Price (VWAP). Gradient indicates if price is above (green) or below (red) fair value (±0.5% default).
FRED UNRATE % Change: Percentage change in U.S. unemployment rate (via FRED data). Cell turns red for increases (economic weakness), green for decreases (strength), gray if zero or disabled.
Open Interest: Total open MESM2 futures contracts. Gradient scales from low (red) to high (green) up to a hardcoded 300,000 threshold, reflecting market participation.
COT Commercial Long/Short: Weekly Commitment of Traders data for commercial positions. Long cell green if longs > shorts (bullish institutional sentiment); Short cell red if shorts > longs (bearish); gray otherwise.
New Metrics Table Metrics
This table emphasizes technical momentum and volatility, with arrows for quick bias assessment:
QQE Bias: Smoothed RSI vs. trailing stop (default length 14, factor 4.236, smooth 5). Green for bullish (RSI > stop, ↑ arrow), red for bearish (RSI < stop, ↓ arrow), gray for neutral.
RSI: Relative Strength Index (default period 14). Gradient from oversold (red, <30 + threshold offset, ↓ arrow if ≤40) to overbought (green, >70 - offset, ↑ arrow if ≥60).
ATR Volatility: Score (1–20) based on Average True Range (default period 14, lookback 50). High scores (green, ↑ if ≥15) signal swings; low (red, ↓ if ≤5) indicate calm.
ADX Trend: Average Directional Index (default period 14). Gradient from weak (red, ↓ if ≤0.25×25 threshold) to strong trends (green, ↑ if ≥0.75×25).
Volume Momentum: Score (1–20) comparing current to historical volume (lookback 50). High (green, ↑ if ≥15) suggests pressure; low (red, ↓ if ≤5) implies weakness.
Frahm Volatility: Score (1–20) from true range over a window (default 24 hours, multiplier 9). Dynamic gradient (green/red/yellow); ↑ if ≥7.5, ↓ if ≤2.5.
Frahm Avg Candle (Ticks): Average candle size in ticks over the window. Blue gradient (or dynamic green/red/yellow); ↑ if ≥0.75 percentile, ↓ if ≤0.25.
Arrows trigger on metric-specific logic (e.g., RSI ≥60 for ↑), providing directional cues without strict color ties.
Customization Options
Adapt the indicator to your strategy:
ML Inputs: Lookback (10–5000 bars) and RSI period (2+) for prediction sensitivity—shorter for volatility, longer for trends.
Timeframes: Individual per metric (e.g., 1H for QQE Bias to match higher frames; blank for chart timeframe).
Thresholds: Adjust gradients and arrows (e.g., Deviation 0.1–5%, ADX 0–100, RSI overbought/oversold).
QQE Settings: Length, factor, and smooth for fine-tuned momentum.
Data Toggles: Enable/disable FRED, Open Interest, COT for focus (e.g., disable macro for pure intraday).
Frahm Options: Window hours (1+), scale multiplier (1–10), dynamic colors for avg candle.
Plot/Table: Line color, positions, gradients, and visibility.
Ideal Use Case
Perfect for MESM2 scalpers and trend traders. Use the Main Table for entry confirmation via predicted deviations and institutional positioning. Leverage the New Metrics Table arrows for short-term signals—enter bullish on green consensus (all ↑), avoid chop on low volatility. Set alerts to catch shifts without constant monitoring.
Why It's Valuable
Info Table V1 consolidates diverse metrics into actionable visuals, answering critical questions: Is price mispriced? Is momentum aligning? Is volatility manageable? With real-time updates, consensus highlights, and extensive customization, it enhances precision in fast markets, reducing guesswork for confident trades.
Note: Optimized for futures; some metrics (OI, COT) unavailable on non-futures symbols. Test on demo accounts. No financial advice—use at your own risk.
The provided script reuses open-source elements from TradingView's Color Library and LuxAlgo's QQE Weighted Oscillator, as noted in the script comments and description. Credits are appropriately given in both the description and code comments, satisfying the requirement for attribution.
Regarding significant improvements and proportion:
The QQE logic comprises approximately 15 lines of code in a script exceeding 400 lines, representing a small proportion (<5%).
Adaptations include integration with multi-timeframe support via request.security, user-customizable inputs for length, factor, and smooth, and application within a broader table-based indicator for momentum bias display (with color gradients, arrows, and alerts). This extends the original QQE beyond standalone oscillator use, incorporating it as one of seven metrics in the New Metrics Table for confluence analysis (e.g., consensus highlighting when all metrics align). These are functional enhancements, not mere stylistic or variable changes.
The Color Library usage is via official import (import TradingView/Color/1 as Color), leveraging built-in gradient functions without copying code, and applied to enhance visual interpretation across multiple metrics.
The script complies with the rules: reused code is minimal, significantly improved through integration and expansion, and properly credited. It qualifies for open-source publication under the Mozilla Public License 2.0, as stated.

Share SizePurpose: The "Share Size" indicator is a powerful risk management tool designed to help traders quickly determine appropriate share/contract sizes based on their predefined risk per trade and the current market's volatility (measured by ATR). It calculates potential dollar differences from recent highs/lows and translates them into a recommended share/contract size, accounting for a user-defined ATR-based offset. This helps you maintain consistent risk exposure across different instruments and market conditions.
How It Works: At its core, the indicator aims to answer the question: "How many shares/contracts can I trade to keep my dollar risk within limits if my stop loss is placed at a recent high or low, plus an ATR-based buffer?"
Price Difference Calculation: It first calculates the dollar difference between the current close price and the high and low of the current bar (Now) and the previous 5 bars (1 to 5).
Tick Size & Value Conversion: These price differences are then converted into dollar values using the instrument's specific tickSize and tickValue. You can select common futures contracts (MNQ, MES, MGC, MCL), a generic "Stock" setting, or define custom values.
ATR Offset: An Average True Range (ATR) based offset is added to these dollar differences. This offset acts as a buffer, simulating a stop loss placed beyond the immediate high/low, accounting for market noise or volatility.
Risk-Based Share Size: Finally, using your Default Risk ($) input, the indicator calculates how many shares/contracts you can take for each of the 6 high/low scenarios (current bar, 5 previous bars) to ensure your dollar risk per trade remains constant.
Dynamic Table: All these calculations are presented in a clear, real-time table at the bottom-left of your chart. The table dynamically adjusts its "Label" to show the selected symbol preset, making it easy to see which instrument's settings are currently being used. The "Shares" rows indicate the maximum shares/contracts you can trade for a given risk and stop placement. The cells corresponding to the largest dollar difference (and thus smallest share size) for both high and low scenarios are highlighted, drawing your attention to the most conservative entry points.
Key Benefits:
Consistent Risk: Helps maintain a consistent dollar risk per trade, regardless of the instrument or its current price/volatility.
Dynamic Sizing: Automatically adjusts share/contract size based on market volatility and your chosen stop placement.
Quick Reference: Provides a real-time, easy-to-read table directly on your chart, eliminating manual calculations.
Informed Decision Making: Assists in quickly assessing trade opportunities and potential position sizes.
Setup Parameters (Inputs)
When you add the "Share Size" indicator to your chart, you'll see a settings dialog with the following parameters:
1. Symbol Preset:
Purpose: This is the primary setting to define the tick size and value for your chosen trading instrument.
Options:
MNQ (Micro Nasdaq 100 Futures)
MES (Micro E-mini S&P 500 Futures)
MGC (Micro Gold Futures)
MCL (Micro Crude Oil Futures)
Stock (Generic stock setting, with tick size/value of 0.01)
Custom (Allows you to manually input tick size and value)
Default: MNQ
Importance: Crucial for accurate dollar calculations. Ensure this matches the instrument you are trading.
2. Tick Size (Manual Override):
Purpose: Only used if Symbol Preset is set to Custom. This defines the smallest price increment for your instrument.
Type: Float
Default: 0.25
Hidden: This input is hidden (display=display.none) unless "Custom" is selected. You might need to change display=display.none to display=display.inline in the code if you want to see and adjust it directly in the settings for "Custom" mode.
3. Tick Value (Manual Override):
Purpose: Only used if Symbol Preset is set to Custom. This defines the dollar value of one tickSize increment.
Type: Float
Default: 0.50
Hidden: This input is hidden (display=display.none) unless "Custom" is selected. Similar to Tick Size, you might need to adjust its display property if you want it visible.
4. Default Risk ($):
Purpose: This is your maximum desired dollar risk per trade. All share size calculations will be based on this value.
Type: Float
Default: 50.0
Hidden: This input is hidden (display=display.none). It's a critical setting, so consider making it visible by changing display=display.none to display=display.inline in the code if you want users to easily adjust their risk.
ATR Offset Settings (Group): This group of settings allows you to fine-tune the ATR-based buffer added to your potential stop loss.
5. ATR Offset Length:
Purpose: Defines the lookback period for the Average True Range (ATR) calculation used for the offset.
Type: Integer
Default: 7
Hidden: This input is hidden (display=display.none).
6. ATR Offset Timeframe:
Purpose: Specifies the timeframe on which the ATR for the offset will be calculated. This allows you to use ATR from a higher timeframe for your stop buffer, even if your chart is on a lower timeframe.
Type: Timeframe string (e.g., "1" for 1 minute, "60" for 1 hour, "D" for Daily)
Default: "1" (1 Minute)
Hidden: This input is hidden (display=display.none).
7. ATR Offset Multiplier (x ATR):
Purpose: Multiplies the calculated ATR value to determine the final dollar offset added to your high/low price difference. A value of 1.0 means one full ATR is added. A value of 0.5 means half an ATR is added.
Type: Float
Minimum Value: 0 (no offset)
Default: 1.0
Hidden: This input is hidden (display=display.none).

Position Size Calculator v206/17/2025 - Updated to add MGC to list of instruments
Position Size Calculator for Futures Trading
A professional position sizing tool designed specifically for futures traders who want to maintain disciplined risk management. This indicator calculates the optimal number of contracts based on your predefined risk amount and provides instant visual feedback.
Key Features:
• Interactive price selection - simply click on the chart to set entry, stop loss, and take profit levels
• Supports all major futures contracts: ES, NQ, GC, RTY, YM, MNQ, MES with accurate contract specifications
• Customizable risk amount (defaults to $500 but fully adjustable)
• Real-time position size calculations that never exceed your risk tolerance
• Visual risk validation with color-coded header (green = valid risk, red = excessive risk)
• Automatic 2:1 risk/reward ratio calculations
• Compact, non-intrusive table display in top-right corner
• Clean interface with no chart clutter
How to Use:
Select your futures instrument from the dropdown
Set your maximum risk amount (default $500)
Click on the chart to set your Entry Price
Click on the chart to set your Stop Loss Price
Optionally click to set your Take Profit Price
The calculator instantly shows maximum contracts, actual risk, expected profit, and R/R ratio
Risk Management:
The indicator enforces strict risk management by calculating the maximum number of contracts you can trade while staying within your specified risk limit. The header turns green when your trade is within acceptable risk parameters and red when the risk is too high, providing instant visual feedback.
Perfect for day traders, swing traders, and anyone trading futures who wants to maintain consistent position sizing and risk management discipline.

Market Clock with Inline HoursThis script displays a powerful, configurable market session clock that shows the open/closed status and trading hours for major global financial markets — including specialized logic for NY Futures (Globex).
🔑 Key Features:
✅ Real-Time Session Status:
Shows whether each selected market is currently OPEN or CLOSED, based on the user’s selected time zone.
✅ NY Futures Weekend Logic:
Built-in logic ensures NY Futures are marked CLOSED:
Friday after 5:00 PM ET
All of Saturday
Sunday until 6:00 PM ET
This reflects the true CME Globex trading schedule.
✅ 12-Hour Format + Timezone Labels:
Session hours are displayed in 12-hour AM/PM format alongside their associated timezone (EST, GMT, JST, etc.) for clarity.
✅ Fully Configurable Markets:
You can choose to display:
NY Market (RTH)
NY Futures (Globex)
London
Tokyo
Frankfurt
And you can easily toggle them on/off in the settings.
✅ Text Size & Position Customization:
Easily control the text size (tiny → huge) and screen position (top/bottom, left/center/right).
✅ Auto Timezone Offset Support:
Select from a list of common time zones (EST, UTC, JST, etc.), or enter your own custom UTC offset for global flexibility.
✅ Compact & Clean Design:
The layout groups each market’s:
Real-time OPEN/CLOSED status
Trading hours
All into a single column, making the layout clean and dashboard-ready.
🧠 Who is this for?
Day traders
Futures traders
Forex traders
Anyone who tracks multiple time zones or global markets
📌 Notes:
Clock updates based on chart timeframe (e.g., every 1m on a 1-minute chart)
Pine Script doesn't support real-time per-second updates, but works well for market status tracking
💬 Feedback Welcome!
This script was designed to be lightweight and user-friendly. Suggestions and improvements are always welcome — feel free to leave a comment or reach out directly.

G&S SMT### Description of the Pine Script
This Pine Script is designed to identify **Smart Money Technique (SMT)** setups between **Gold (GC1!)** and **Silver (SI1!) Futures** on a **15-minute timeframe**. It specifically looks for divergences between the price movements of Gold and Silver over the last 4 candles and compares it with the next candle's price movement. The script provides **Bullish** and **Bearish** signals for SMT during a specified time range of **8:45 AM EST to 10:30 AM EST**.
### Key Features of the Script:
1. **Futures Symbols**:
- The script uses **Gold Futures (GC1!)** and **Silver Futures (SI1!)** on a 15-minute timeframe to monitor their price movements.
2. **Time Range Filtering**:
- The signals are only active between **8:45 AM EST and 10:30 AM EST**, ensuring that the script only signals within the most relevant trading hours for your strategy.
3. **SMT Calculation (Last 4 Candles vs Next Candle)**:
- **Gold and Silver Price Change Calculation**: The script compares the price changes of **Gold** and **Silver** over the **last 4 candles** and then compares them with the price movement of the **next candle**:
- **Bullish SMT**: Occurs when Gold shows an increase in the last 4 candles while Silver shows a decrease, and both Gold and Silver show an increase in the next candle.
- **Bearish SMT**: Occurs when Gold shows a decrease in the last 4 candles while Silver shows an increase, and both Gold and Silver show a decrease in the next candle.
4. **Bullish and Bearish Signals**:
- **Bullish SMT Signal**: The script will plot a **green** arrow below the bar when a Bullish SMT setup is identified.
- **Bearish SMT Signal**: A **red** arrow above the bar is plotted when a Bearish SMT setup is identified.
5. **Gold and Silver Difference Plot**:
- The difference between the prices of **Gold** and **Silver** is plotted as a **blue line**, giving a visual representation of the relationship between the two assets. When the difference line moves significantly, it can indicate a potential divergence or convergence in the prices of Gold and Silver.
### Script Logic Breakdown:
1. **Price Change for Last 4 Candles**:
- The script calculates the price change for Gold and Silver from the 4th-to-last candle to the last candle.
- `gold_change_last4` and `silver_change_last4` calculate these price differences.
2. **Price Change for Next Candle**:
- It then calculates the price change from the last candle to the next candle.
- `gold_change_next` and `silver_change_next` calculate these price differences.
3. **Bullish SMT Condition**:
- If Gold increased while Silver decreased in the last 4 candles, and both Gold and Silver show an increase in the next candle, it indicates a **Bullish SMT**.
4. **Bearish SMT Condition**:
- If Gold decreased while Silver increased in the last 4 candles, and both Gold and Silver show a decrease in the next candle, it indicates a **Bearish SMT**.
5. **Time Filter**:
- Signals are only plotted when the current time is between **8:45 AM EST and 10:30 AM EST** to match your preferred trading hours.
### Visualization:
- **Bullish Signals**: Plotted as **green arrows** below the bars when a Bullish SMT setup is identified.
- **Bearish Signals**: Plotted as **red arrows** above the bars when a Bearish SMT setup is identified.
- **Gold - Silver Difference**: A **blue line** is plotted to show the price difference between Gold and Silver, helping visualize any divergence.
### How It Helps:
- **Divergence Identification**: This script highlights potential divergences between Gold and Silver Futures, which can provide insights into market sentiment and smart money movements.
- **Focus on Relevant Time Frame**: By filtering signals between 8:45 AM EST and 10:30 AM EST, you are focusing on a timeframe that can be more beneficial for trading.
- **Visual Clarity**: The arrows and the price difference line provide clear signals and a visual representation of the relationship between Gold and Silver, helping you make informed trading decisions.
This script is an automated approach to detecting **SMT setups** and helping traders recognize when Gold and Silver might be signaling a bullish or bearish move based on their divergence patterns.

Price and OI ChangePrice and OI Change
Description:
The "Price and OI Change" indicator provides insights into market dynamics by analyzing the price and open interest (OI) changes over a 7-day period. This indicator is designed for use with both spot and futures markets, including cryptocurrencies.
Key Features:
Price and OI Change Calculation: Computes the 7-day change in price and open interest to help identify market trends and shifts.
Market Conditions Visualization: Differentiates market conditions by changing the background color based on:
Leverage-Driven Market: Blue background indicates increasing prices and OI, suggesting a bullish trend driven by leverage.
Spot-Driven Market: Green background shows increasing prices but decreasing OI, indicating a bullish trend driven by spot market activity.
Leverage Sell-Off: Orange background reveals decreasing prices with increasing OI, signaling a potential liquidation phase.
Deleveraging Sell-Off: Red background reflects decreasing prices and OI, indicating a bearish market with reduced leverage.
Top 3 BTC Futures Average OI: Displays the average open interest for the top 3 BTC futures contracts from major exchanges (Binance, OKX, Bybit). This helps gauge overall market sentiment and liquidity.
Visualization Tools: Includes optional plotting of open interest data and average OI for better visualization of market conditions.
Usage:
Traders and Analysts: Use the background color changes and average OI to make informed decisions about market entry and exit points.
Futures Traders: Track OI changes in major BTC futures to assess market strength and potential liquidity issues.

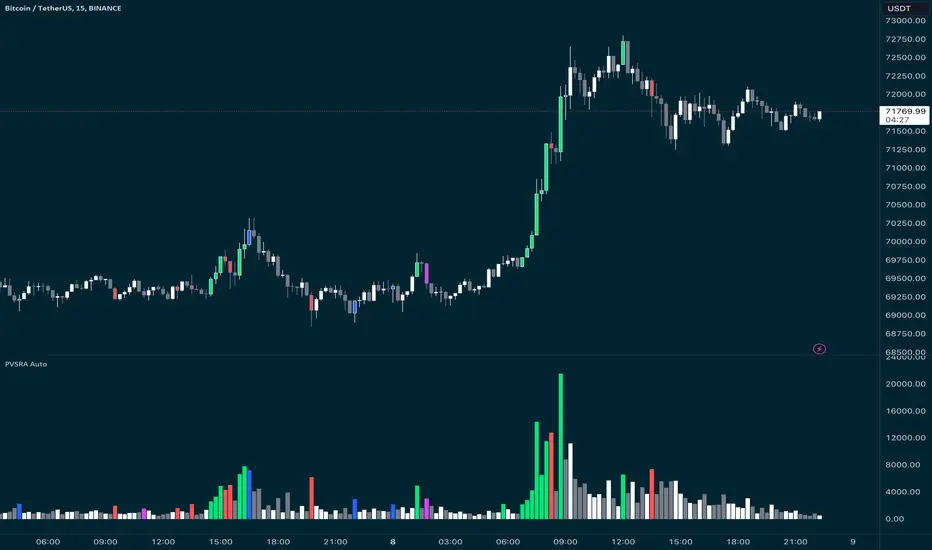
PVSRA Candles Auto OverrideWhat does this “PVSRA Candles Auto Override” Indicator
do?
This indicator automates PVSRA analysis for crypto traders. It finds the corresponding Binance Perpetual Futures chart for the current instrument, then replaces the current chart's volume profile with the perpetual futures data (if available) to ensure the PVSRA calculation uses the most relevant volume. This not only reduces human error during market scans but also automatically selects the appropriate Binance Perpetual Futures contract, saving time and improving the accuracy of PVSRA calculations.
How can a trader use this indicator?
This helps the trader to identify if there is volume data available in an equivalent Binance Perpetual Futures chart and automatically displays it, making it easier to switch coins whilst viewing the market. Why do we want to use Binance Perpetual Futures Volume? In most markets Binance volume surpasses those of other crypto exchanges so this will give us a better view on the volume spikes in the market.
What is PVSRA and how can I trade using this indicator?
PVSRA candles are a type of candlestick chart formatting. PVSRA stands for Price, Volume, Support and Resistance Analysis.
Here's a breakdown of what PVSRA candles aim to achieve:
Combine multiple factors: They take into account price movement, trading volume, and support and resistance levels to identify potential trading opportunities.
Highlight potential imbalances: By color-coding candles based on PVSRA analysis, they aim to show areas of high volume activity, potentially representing imbalances created by market makers (large institutions that influence price).
Identify areas of revisit: The theory is that these high-volume zones may be revisited by the market in the future, as there's "unrecovered liquidity" in those areas.
Usage of the Indicator:
By default the indicator will automatically use the Equivalent Binance Perpetual Chart for the Data
You can override the symbol manually if you what to view another instrument’s data.
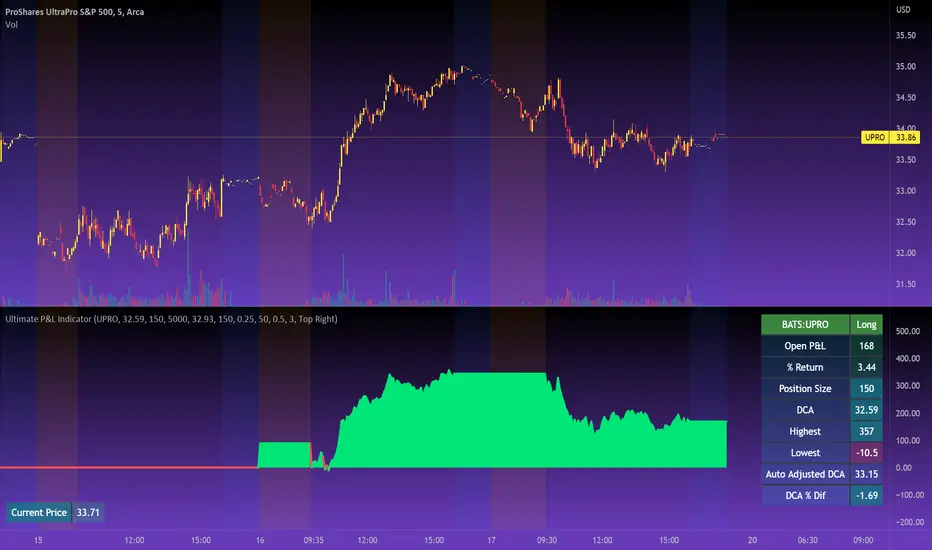
Ultimate P&L IndicatorHello everyone,
Excited to release this P&L Indicator! Read below for more details.
What it does:
This is an indicator that permits you to track your active P&L live on Tradingview. As well, it provides some insight into DCAing your position by giving you live estimates of your revised DCA if you were to add to your position at various targets/price points.
Who is it for:
I developed it because I trade 100% off of Tradingview but my broker does not support Tradingview integration. So I wanted a way to track my position live on the Tradingview platform without having to constantly reference my broker. I also wanted to be able to set position specific alerts right on Tradingview.
How does it work:
It works by the user manually inputting their trade information, including their DCA, position size and the date and time of position entry. The indicator can provide real time and live DCA adjusted estimates if you were to add to your position at the current stock price, or you can manually calculcate your revised DCA at a specific price target.
The indicator also displays your current and past performance on your position for the duration of the position period:
Elements:
Capabilities:
The indicator is compatible with both futures and share trading.
Option trading is not directly available, however, you can get an idea for your option position P&L by following the 1 option contract = 100 share rule.
So if you have 5 option contracts that you bought at a ticker price of, say, 38$, your average cost or DCA would be 38 and your position size would be 500. This will not be 100% accurate, but will be close enough to give you a feel for your active P&L.
If you are trading futures, you will need to select "Futures Trading" and specify the TIck and Index costs. A cheat sheet has been provided in the tool tip for ES, Oil and MNQ. The default is set for ES1! mini futures at 0.25 ticks per 50$.
Important tips:
1. Select the date and time of your position (optional): This is optional but will provide you with the clearest and most accurate review of how your position has performed, including the highest and lowest (drawdown).
2. Select whether it is a share position or a futures position (this is required).
3. Select whether it is a long or short position (this is required).
4. Input your DCA and position size (this is required).
5. Most importantly, select the ticker your position is based in!
I have also prepared a quick start video which is linked below:
As always, please let me know your comments/questions and feedback for the indicator.
Thanks for checking it out and safe trades everyone!
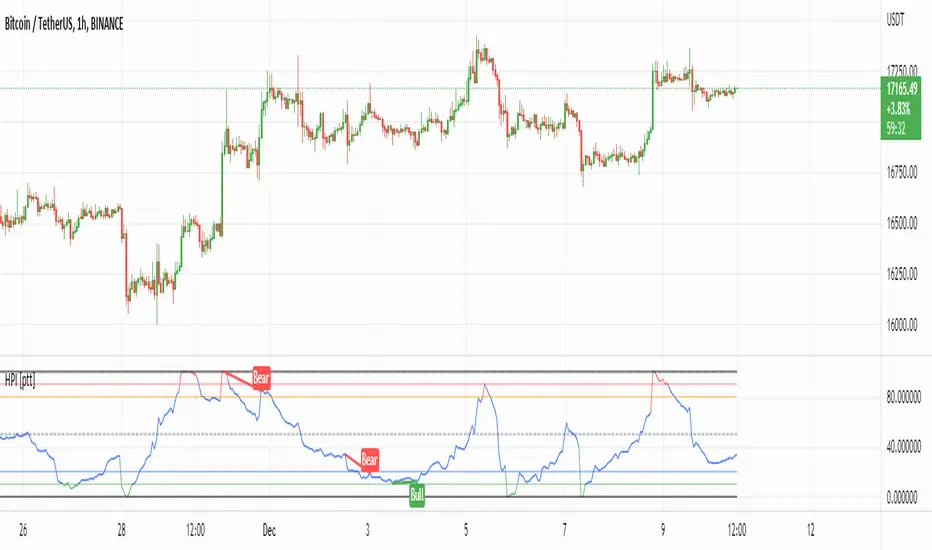
HPI for crypto [ptt]The Herrick Payoff Index is designed to show the amount of money flowing into or out of a futures contract.
This indicator uses open interest (from Binance PERP like this BTCUSDTPERP_OI) from during its calculations, therefore, the pairs being analyzed must contain open interest data on Binance.
The indicator only works with USDT pairs! Like RVNUSDT, BTCUSDT... does not work with USD pairs!
The indicator works in two mode.
Index mode - when the values moving 0-100
In this case, if the value below 10, it shows the money is flowing out of the futures contract and near the local bottom. If the value above 90, it shows the money is flowing into the futures contract and near the local top.
(The two trigger can be modified, the default is low:10 and high:90)
Oscillator mode - when the values moving around the origo (0)
In this case, if the value above 0 (green), it shows the money is flowing into the futures contract, this is bullish
If the value below 0 (red), it shows the money is flowing out of the futures contract, this is bearish
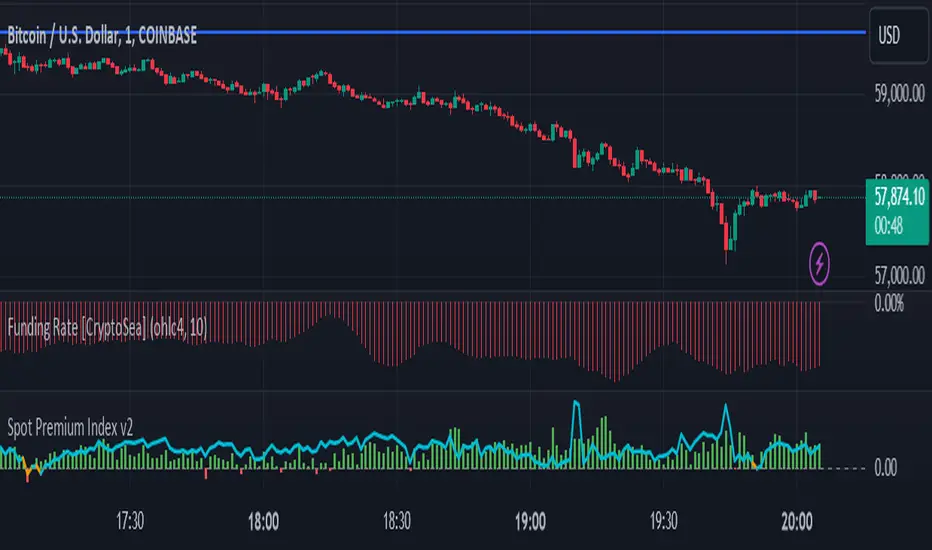
BTC Coinbase PremiumThis script is base on another script by oh 92.
It basically shows you where the price of Bitcoin (in USD) on Coinbase trades at a premium against an average of several futures exchanges.
Coinbase premium shows spot interest on bitcoin which happens either when futures are shorting heavily but spot holds the price up (often bullish especially when price is at a support level).
Negative premium shows that futures are leading price during an uptrend or spot is leading price during a downtrend.
Strong positive premium is often considered bullish.
Strong negative premium is often considered bearish even if price goes up.
The histogramm coinbase premium vs an average of several futures exchanges (Bitmex, Bitfinex, Binance, FTX, Phemex and Bitstamp).
The line diagramm shows coinbase premium vs Bybit.
In contrast to the script by oh92 this script uses different exchages (especially Bybit as a lot of former Bitmex traders changed to Bybit during september and october 2020).
All values are in percent because differences in USD only are not suitable for historic prices. This means if CB-premium is -0.1 then futures trade 0.1% lower than coinbase.
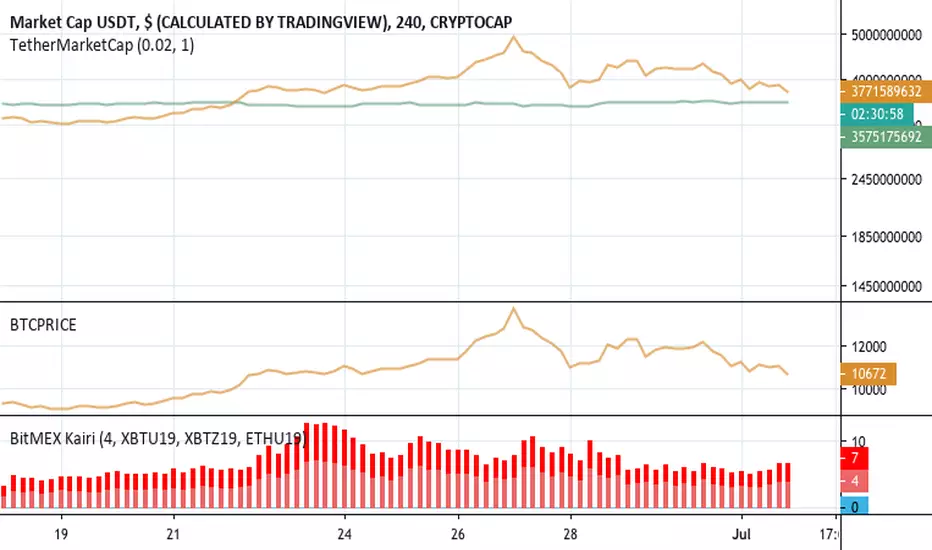
BitMEX KairiBitMEX Kairi
# Abstract
This script shows the divergence between BTC futures price and BTC actuals price of bitFlyer FX and BitMEX in percentage.
Usually, when people bought it or sold it too much on futures , the divergence between actuals and futures are getting expanding.
I believe this is really useful to find when the conversion of the trend happens.
Also supports USDT divergence too. If you wish to enable USDT mode, please check "Show only USDT divergence (Poloniex)" on the settings menu.
Enjoy :)
# Supports:
- BitMEX BTC Futures 3mo (orange)
- BitMEX BTC Futures 6mo (red)
- bitFlyer FX (blue)
- USDTUSD (Poloniex)
# Disclaimer:
This is a free script. Feedbacks are welcome! But I don't have any responsibility when this script has broken or something went wrong.
Option Levels KiKOption Levels KiK - Automatic Options Levels Converter
This indicator automatically converts SPX options levels to ES futures prices in real-time.
KEY FEATURES:
- Automatic conversion from any index (SPX, NDX, etc.) to its corresponding futures contract (ES, NQ, etc.)
- Two conversion modes: Ratio or Spread
- Automatic reference price capture at user-defined time (default 15:30 Paris time)
- Displays key options levels: Gamma Flip, Forward, C50, C70, P50, P70
CONVERSION METHODS:
- Ratio Mode: Future Level = Index Level × (ES Reference / SPX Reference)
- Spread Mode: Future Level = Index Level + (ES Reference - SPX Reference)
CUSTOMIZATION:
- Enable/disable individual levels
- Fully customizable colors, line styles, and widths
- Labels displayed on the right side of the chart
- Reference time automatically converts from Paris timezone to US market time
USAGE:
1. Enter your options levels for the index (e.g., SPX)
2. The indicator automatically converts them to futures levels (e.g., ES)
3. Monitor the conversion info table in the top-right corner
Perfect for options traders who need to track index levels on futures charts!

SHFE vs COMEX Silver USD Spread (FX Adjusted)This indicator converts Shanghai Futures Exchange silver pricing (CNY per kilogram) into U.S. dollars per troy ounce using the live USD/CNY exchange rate. It compares the FX-adjusted Shanghai price with COMEX silver futures pricing and displays:
• Shanghai silver (converted to USD/oz)
• COMEX silver (USD/oz)
• The spread between the two markets (Shanghai − COMEX)
The tool helps visualize cross-market pricing differences and how currency movements influence silver valuation between Chinese and U.S. futures markets.
This is an analytical comparison tool and does not provide trading signals.
Notes:
• Requires access to SHFE and COMEX futures data on TradingView
• Uses USDCNY from the current chart (or selected FX symbol)
• Spread values are calculated mechanically from price and FX conversion

Smart Scalper Pro Template + VWAP
📌 Author
Garry Evans
Independent system developer focused on:
Risk-first automation
Market structure & liquidity behavior
Discipline, consistency, and capital preservation
“The edge isn’t the market — it’s the man who survives it.”
⚙️ Risk Management & Position Sizing
The script is built around capital protection, not signal frequency.
Risk logic includes:
Fixed or dynamic risk per trade
Market-adaptive position sizing
Session-based trade limits
Daily trade caps and auto-lockout protection
Volatility-aware sizing (futures & crypto)
⚠️ Profit is pursued only after risk is controlled.
📊 Track Record
Backtested across multiple market environments
Forward-tested and actively used by the author
Real-account trades are logged where platform rules allow
Results vary by market, timeframe, and user-defined risk settings.
🌍 Supported Markets
Designed to work across all liquid markets, including:
Stocks
Crypto (spot & futures)
Options (signal-based framework)
Futures (indices, metals, crypto futures)
The system adapts to volatility and structure — it is not market-specific.
⚖️ Leverage
Leverage is not required
If used, leverage is fully user-controlled
Risk logic scales exposure conservatively
No martingale.
No revenge sizing.
No over-exposure logic.
🧪 Backtesting
✔ Yes
Strategy logic has been backtested
Filters reduce chop, noise, and forced trades
Focus on drawdown control over curve-fitting
🛠 Support
✔ Yes
Direct author support
Ongoing improvements and updates
Feature refinement based on real usage and feedback
👥 Community
✔ Yes
Private user access
High-quality feedback environment
No public signal spam or hype-driven chat rooms
⏳ Trial Period
✔ Yes
Limited trial access available
Designed for evaluation only
Trial users do not receive full feature access
🚫 Who This Script Is NOT For
This system is not for:
Traders looking for guaranteed profits
Users expecting copy-paste “signal calls”
Over-leveraged gamblers
Those unwilling to follow risk rules
Anyone seeking overnight results
This is a discipline and automation tool, not a shortcut.
🧠 Final Positioning
This is not a signal service.
This is a risk-controlled execution framework designed to:
Enforce discipline
Reduce emotional trading
Protect capital during bad market conditions
Scale responsibly during favorable ones

Dhan_libLibrary "Dhan_lib"
Overview
Dhan_lib is a Pine Script v6 library designed to help traders automate trading orders via TradingView alerts and webhook integration with the Dhan broker API.
This library generates JSON-formatted alert messages for the following instruments.
Equity (Intraday and Delivery)
Options (CE and PE Buy and Sell)
Futures (Buy and Sell)
These alert strings can be directly used inside TradingView alerts to place live orders through an external webhook setup.
🔹 Supported Instruments
Equity
Intraday Buy and Sell
Delivery Buy and Sell
Options
Call (CE) Buy and Sell
Put (PE) Buy and Sell
ATM, ITM, and OTM strike selection
Intraday and Carry Forward
Futures
Buy and Sell
Intraday and Carry Forward
🔹 Key Features
✅ Pine Script v6 compatible
✅ Clean and reusable library functions
✅ Automatic ATM, ITM, and OTM strike calculation
✅ Expiry date handled via string format YYYY-MM-DD
✅ Fully webhook-ready JSON alert structure
✅ Supports multi-leg order format
✅ Designed for TradingView to Dhan automation
🔹 How to Use
Import the library in your strategy or indicator.
import Shivam_Mandrai/Dhan_lib/1
Call the required function.
order_msg = buy_CE_option("YOUR_SECRET_KEY", "NIFTY", 1)
Use the returned string as the alert message.
alert(order_msg, alert.freq_once_per_bar)
Connect TradingView alerts to your Dhan webhook receiver.
---
🔹 Important Notes
Strike prices are calculated dynamically based on the current chart price (close).
Futures symbols use TradingView continuous contract format such as NIFTY1!.
Quantity refers to the number of lots, not the lot size.
Expiry date must be provided in YYYY-MM-DD format.
⚠️ DISCLAIMER (PLEASE READ CAREFULLY)
This library is provided strictly for educational and automation purposes only.
I am not a SEBI-registered advisor.
I do not guarantee any profit or accuracy of orders.
I am not responsible for any financial loss, missed trades, execution errors, or broker-side issues.
Trading in stocks, options, and futures involves significant risk.
Automated trading can fail due to internet issues, broker API downtime, incorrect webhook configuration, slippage, or market volatility.
👉 Use this library entirely at your own risk.
👉 Always test thoroughly using paper trading or simulation before deploying with real capital.
If you want, I can also:
* Shrink this further for TradingView character limits
* Convert it into a single-paragraph version
* Localize it for Indian retail traders
buy_stock_intraday(secret_key, symbol, qty, exchange)
to buy the stock Intraday
Parameters:
secret_key (string) : string Secret Key of the Dhan Account eg-> "S1HgS".
symbol (string) : string Stock symbol eg-> "TATASTEEL".
qty (int) : int quantity for the order eg-> 1.
exchange (string) : string Trading Exchange eg-> "NSE".
Returns: order string.
sell_stock_intraday(secret_key, symbol, qty, exchange)
to sell the stock Intraday
Parameters:
secret_key (string) : string Secret Key of the Dhan Account eg-> "S1HgS".
symbol (string) : string Stock symbol eg-> "TATASTEEL".
qty (int) : int quantity for the order eg-> 1.
exchange (string) : string Trading Exchange eg-> "NSE".
Returns: order string.
buy_stock_delivery(secret_key, symbol, qty, exchange)
to buy the stock delivery
Parameters:
secret_key (string) : string Secret Key of the Dhan Account eg-> "S1HgS".
symbol (string) : string Stock symbol eg-> "TATASTEEL".
qty (int) : int quantity for the order eg-> 1.
exchange (string) : string Trading Exchange eg-> "NSE".
Returns: order string.
sell_stock_delivery(secret_key, symbol, qty, exchange)
to sell the stock delivery
Parameters:
secret_key (string) : string Secret Key of the Dhan Account eg-> "S1HgS".
symbol (string) : string Stock symbol eg-> "TATASTEEL".
qty (int) : int quantity for the order eg-> 1.
exchange (string) : string Trading Exchange eg-> "NSE".
Returns: order string.
buy_CE_option(secret_key, symbol, lots, expiry_date, intraday, strike_price_base, ITM_points, OTM_points, exchange)
to buy CE option
Parameters:
secret_key (string) : string Secret Key of the Dhan Account eg-> "S1HgS".
symbol (string) : string Index / Stock symbol eg-> "NIFTY", "BANKNIFTY".
lots (int) : int Number of lots eg-> 1.
expiry_date (string) : string Option expiry date in YYYY-MM-DD format eg-> "2026-01-20".
intraday (bool) : bool Set true for intraday order, set false for delivery order eg-> true.
strike_price_base (float) : float Strike price step size eg-> 50, 100 (default is 100).
ITM_points (float) : float Points below CMP to select ITM strike eg-> 100 (default is 0).
OTM_points (float) : float Points above CMP to select OTM strike eg-> 100 (default is 0).
exchange (string) : string Trading Exchange eg-> "NSE" (default is NSE).
Returns: order string.
buy_PE_option(secret_key, symbol, lots, expiry_date, intraday, strike_price_base, ITM_points, OTM_points, exchange)
to buy PE option
Parameters:
secret_key (string) : string Secret Key of the Dhan Account eg-> "S1HgS".
symbol (string) : string Index / Stock symbol eg-> "NIFTY", "BANKNIFTY".
lots (int) : int Number of lots eg-> 1.
expiry_date (string) : string Option expiry date in YYYY-MM-DD format eg-> "2026-01-20".
intraday (bool) : bool Set true for intraday order, set false for delivery order eg-> true.
strike_price_base (float) : float Strike price step size eg-> 50, 100 (default is 100).
ITM_points (float) : float Points below CMP to select ITM strike eg-> 100 (default is 0).
OTM_points (float) : float Points above CMP to select OTM strike eg-> 100 (default is 0).
exchange (string) : string Trading Exchange eg-> "NSE" (default is NSE).
Returns: order string.
sell_CE_option(secret_key, symbol, lots, expiry_date, intraday, strike_price_base, ITM_points, OTM_points, exchange)
to Sell CE option
Parameters:
secret_key (string) : string Secret Key of the Dhan Account eg-> "S1HgS".
symbol (string) : string Index / Stock symbol eg-> "NIFTY", "BANKNIFTY".
lots (int) : int Number of lots eg-> 1.
expiry_date (string) : string Option expiry date in YYYY-MM-DD format eg-> "2026-01-20".
intraday (bool) : bool Set true for intraday order, set false for delivery order eg-> true.
strike_price_base (float) : float Strike price step size eg-> 50, 100 (default is 100).
ITM_points (float) : float Points below CMP to select ITM strike eg-> 100 (default is 0).
OTM_points (float) : float Points above CMP to select OTM strike eg-> 100 (default is 0).
exchange (string) : string Trading Exchange eg-> "NSE" (default is NSE).
Returns: order string.
sell_PE_option(secret_key, symbol, lots, expiry_date, intraday, strike_price_base, ITM_points, OTM_points, exchange)
to sell PE option
Parameters:
secret_key (string) : string Secret Key of the Dhan Account eg-> "S1HgS".
symbol (string) : string Index / Stock symbol eg-> "NIFTY", "BANKNIFTY".
lots (int) : int Number of lots eg-> 1.
expiry_date (string) : string Option expiry date in YYYY-MM-DD format eg-> "2026-01-20".
intraday (bool) : bool Set true for intraday order, set false for delivery order eg-> true.
strike_price_base (float) : float Strike price step size eg-> 50, 100 (default is 100).
ITM_points (float) : float Points below CMP to select ITM strike eg-> 100 (default is 0).
OTM_points (float) : float Points above CMP to select OTM strike eg-> 100 (default is 0).
exchange (string) : string Trading Exchange eg-> "NSE" (default is NSE).
Returns: order string.
buy_future(secret_key, symbol, lot, intraday, exchange)
to buy the Future
Parameters:
secret_key (string) : string Secret Key of the Dhan Account eg-> "S1HgS".
symbol (string) : string Stock symbol eg-> "NIFTY".
lot (int) : int quantity for the order eg-> 1.
intraday (bool) : bool Set true for intraday order, set false for delivery order eg-> true.
exchange (string) : string Trading Exchange eg-> "NSE".
Returns: order string.
sell_future(secret_key, symbol, lot, intraday, exchange)
to sell the Future
Parameters:
secret_key (string) : string Secret Key of the Dhan Account eg-> "S1HgS".
symbol (string) : string Stock symbol eg-> "NIFTY".
lot (int) : int quantity for the order eg-> 1.
intraday (bool) : bool Set true for intraday order, set false for delivery order eg-> true.
exchange (string) : string Trading Exchange eg-> "NSE".
Returns: order string.

ORB Session BreakoutORB Session Breakout
Overview
The ORB Session Breakout indicator automatically identifies Opening Range Breakouts across multiple trading sessions (Asia, London, and New York) and provides visual trade setups with entry, stop loss, and take profit levels.
Opening Range Breakout (ORB) is a classic trading strategy that captures momentum when price breaks out of an initial trading range established at the start of a session. This indicator automates the entire process - from detecting the opening range to plotting trade setups when breakouts occur.
🎯 Key Features
Multi-Session Support
Asia Session - Captures the Asian market open (default: 19:00-19:15 NY time)
London Session - Captures the London market open (default: 03:00-03:15 NY time)
New York Session - Captures the NY market open (default: 09:30-09:45 NY time)
Each session is fully customizable with independent time windows and colors
Enable/disable individual sessions based on your trading preferences
Automatic Trade Visualization
Entry Level - Marked at the breakout candle close
Stop Loss Zone - Configurable as ORB High/Low or Breakout Candle High/Low
Take Profit Zone - Calculated automatically based on your Risk:Reward ratio
Visual zones make it easy to see risk/reward at a glance
Smart Breakout Detection
Detects breakouts on the exact candle that closes beyond the ORB range
Supports direction changes - if price breaks one way then reverses, a new trade is signaled
Configurable max breakouts per session (1-4) to control trade frequency
Tracking hours setting limits how long after the ORB to look for entries
Futures Compatible
Special detection logic for futures markets where session times may fall during market close
Works reliably on instruments with non-standard trading hours
📊 How It Works
Opening Range Formation
At the start of each enabled session, the indicator tracks the high and low of the first candle(s)
This range becomes your ORB box (displayed in the session color)
Breakout Detection
When a candle closes above the ORB High → LONG signal
When a candle closes below the ORB Low → SHORT signal
The breakout candle is highlighted in yellow (customizable)
Trade Setup Visualization
Entry line drawn at the breakout candle's close price
Stop Loss placed at ORB Low (longs) or ORB High (shorts) - or breakout candle extreme
Take Profit calculated as: Entry + (Risk × R:R Ratio) for longs
Direction Changes
If you're in a LONG and price closes below the ORB Low, the indicator signals a SHORT
This counts as your 2nd breakout (configurable up to 4 per session)
💡 Trading Tips
Best Practices
Wait for candle close - The indicator only signals on confirmed closes beyond the ORB, reducing false breakouts
Use with trend - ORB breakouts work best when aligned with the higher timeframe trend
Respect the levels - The ORB High/Low often act as support/resistance throughout the session
Monitor multiple sessions - Sometimes the best setups come from Asia or London, not just NY
Recommended Settings by Style
Conservative: Max Breakouts = 1, R:R = 2.0+, SL Mode = ORB Level
Aggressive: Max Breakouts = 3-4, R:R = 1.5, SL Mode = Breakout Candle
Scalping: Shorter tracking hours (1-2), tighter R:R (1.0-1.5)
What to Avoid
Trading ORB breakouts during major news events (high volatility can cause whipsaws)
Taking every signal without considering market context
Using on timeframes higher than 1 hour (the ORB concept works best intraday)
🔔 Alerts
The indicator includes built-in alerts for:
Entry Signal - When a breakout is detected (LONG or SHORT)
Take Profit Hit - When price reaches the TP level
Stop Loss Hit - When price reaches the SL level
To set up alerts: Right-click on the chart → Add Alert → Select "ORB Session Breakout"
📝 Notes
This indicator is designed for intraday trading on timeframes up to 1 hour
Session times are based on the selected timezone (default: America/New_York)
The indicator works on all markets including Forex, Futures, Stocks, and Crypto
For futures with non-standard hours, the indicator includes special detection logic

Gap Level Plotter (4H)# Gap Level Plotter (4H) - User Guide
## Overview
This indicator automatically detects and plots 4-hour gap zones on any chart timeframe. Gaps are price discontinuities where one 4H candle's low is above the previous 4H candle's high (gap up) or where one 4H candle's high is below the previous 4H candle's low (gap down). These levels often act as key support/resistance zones.
## Key Features
- **Works on any timeframe**: View 4-hour gaps on 1-minute, 5-minute, 15-minute, daily charts, etc.
- **Visual gap zones**: Displays translucent purple zones (customizable) that extend into the future
- **Configurable lookback**: Choose how many days of history to scan (30, 45, 60, or 90 days)
- **Gap filtering**: Filter out noise by setting minimum gap sizes in points or percentage
- **Clean and simple**: Gaps remain plotted even after being filled, providing historical context
## Settings
### Lookback Days (Default: 45)
Controls how far back in time to search for gaps.
- **Options**: 30, 45, 60, 90 days
- **Use case**: Increase for long-term analysis, decrease for short-term trading
### Zone Color (Default: Purple)
Customize the color of gap zones to match your chart theme or personal preference.
### Filter Method (Default: Points)
Choose how to filter out small/insignificant gaps:
- **None**: Show all gaps regardless of size
- **Points**: Filter by absolute price points (recommended for futures like NQ/ES)
- **Percentage**: Filter by percentage of price (recommended for stocks)
### Minimum Gap Size (Default: 5.0)
The threshold for filtering gaps based on your selected filter method.
**Recommended settings:**
- **NQ futures**: 5-10 points
- **ES futures**: 2-5 points
- **Stocks (percentage)**: 0.25-0.5%
Adjust based on the instrument's volatility and your trading style.
## Best Practices
1. **For futures (NQ/ES)**: Use "Points" filter with 5-10 point minimum
2. **For stocks**: Use "Percentage" filter with 0.25-0.5% minimum
3. **Clean charts**: If too many gaps clutter your view, increase the minimum gap size or reduce lookback days
4. **Multiple timeframes**: The same gaps appear on all chart timeframes - use this to identify key levels across your analysis
## How to Use
1. Add the indicator to your chart
2. Adjust settings based on your instrument and preferences
3. Gap zones automatically update as new 4H candles form
4. Use zones as potential support/resistance levels for entries, exits, or targets
## Notes
- Gaps are plotted when detected and remain visible even after being filled
- The indicator focuses on 4-hour timeframe gaps specifically, as these tend to be significant levels for intraday and swing trading
- Purple zones extend infinitely to the right to show where price might return to fill or test the gap
---
**Enjoy trading with cleaner gap visualization! 📊**

Al Brooks - Bar CountIndicator Purpose:
This indicator displays bar counts on the chart to help traders identify important time nodes and cycle transitions
Features smart session filtering with automatic futures/stock detection and appropriate trading session counting
Core Features:
Smart asset detection: Auto-detect futures and stocks
Session filter toggle: Choose all-day or session-specific counting
Auto timezone handling: Chicago time for futures, NY time for stocks
Flexible display control: Customizable display frequency and label size
Session Settings:
8:30-15:15 (CT) / Futures mode: Chicago time 8:30-15:15 (CT)
9:30-16:00 (ET) / Stock mode: New York time 9:30-16:00 (ET)
All-day mode: Count from first bar of the day
Timeframe Correspondence:
Multiples of 3: Correspond to 15-minute chart update cycles
Multiples of 12: Correspond to 1-hour chart update cycles
18: Key nodes, important time turning points

MenthorQ Levels ConversionLevels Conversion helps traders accurately overlay price levels from spot/index ETFs and indices (like SPX, SPY, QQQ, NDX) onto futures charts (like ES, NQ, etc.).
Because futures and spot/index prices don’t trade at the same price, your levels will be misaligned if you plot them directly. Futures typically trade at a spread or ratio versus their related index/ETF. This indicator solves that by calculating the conversion ratio automatically, so your levels stay aligned on the futures chart.
How it works
This script calculates the ratio between Asset A and Asset B and applies it to convert levels from one instrument to the other (for example, SPX → ES, QQQ → NQ).
Ratio options (3 modes)
You can choose one of three ratio sources:
✅ T1 Ratio (Morning Snapshot)
Select a specific time to “lock” the ratio.
Default: 10:00 AM ET (morning session snapshot)
✅ T2 Ratio (Afternoon Snapshot)
Select a second time to “lock” the ratio.
Default: 3:30 PM ET (afternoon snapshot)
✅ Last Price Ratio (Live)
Uses the last traded price of both assets to compute the ratio.
Note: To refresh the “Last Price” baseline, simply remove and re-add the indicator.
Learn more about Levels Conversions: menthorq.com
Common levels conversions
Some popular use-cases include:
- SPX Gamma Levels → ES
- SPY Gamma Levels → ES
- QQQ Gamma Levels → NQ
- NDX Gamma Levels → NQ
- SPX Intraday Gamma Levels → ES
- QQQ Intraday Gamma Levels → NQ
- SPX Swing Trading Levels → ES
- QQQ Swing Trading Levels → NQ
- GLD Levels → GC
- DIA Levels → YM
- USO Levels → CL
- NVDA / MAG7 Levels → QQQ

Crypto Leverage Index(OI Norm. + FR)Crypto Leverage Index (OI Z-Score + Funding Rate Signals)
(A tool for detecting speculative extremes and leverage load in crypto derivatives markets.)
Hello, fellow traders around the globe!
In today's crypto futures market, often perceived as a 'playground for large players' (whales/smart money), catching extreme leverage behavior is crucial for survival. I wanted to come up with an indicator to quickly identify such market extremes by focusing on the two most potent indicators of leveraged action: Open Interest (OI) and Funding Rate (FR). The goal is to ride on the shoulders of the market movers by anticipating their next liquidity-driven actions. hope this helps.
❗ IMPORTANT NOTE: This indicator works exclusively on Perpetual Futures or Swap Charts that provide Open Interest (OI) data.
⚪ Overview
This indicator provides a standardized view of speculative activity by calculating the Open Interest (OI) Z-Score . This score reveals when the current level of open leverage is abnormally high (premium) or low (discount) relative to its historical mean and volatility. The index is also augmented with Extreme Funding Rate Signals , which plot simple White Dots on the chart when derivative positioning (long or short bias) reaches an unsustainable, overheated level. The combination of OI volume and positioning bias offers a good method to identify potential market reversal zones driven by leverage liquidation risks (short/long squeezes).
⚪ Score Components
Open Interest Z-Score (Leverage Load)
The primary component standardizes the Open Interest value over a defined lookback `Period` (default 50). This calculation reveals the statistical deviation of current leverage from the norm.
OI Z-Score = (OI - Mean(OI)) / StDev(OI)
Funding Rate (Positioning Bias)
Calculates the approximate funding rate using a TWAP (Time-Weighted Average Price) of the Perpetual Futures Premium, combined with the standard 0.01% Interest Rate.
⚪ Extreme Condition Detection
OI Z-Score Extremes
* Premium Zone (Red Fill) : OI Z-Score is above the user-defined `Threshold` (default 2.0). Indicates high/overstretched leverage.
* Discount Zone (Green Fill) : OI Z-Score is below the user-defined negative threshold (default -2.0). Indicates low/unwinded leverage.
Funding Rate Extreme Signals (White Dots)
These appear as small White Dots ( · ) plotted at fixed levels within the indicator pane. The position indicates the bias:
* Top Dot (Excessive Longs) : Triggered when Funding Rate is greater than Abnormal Funding Rate Threshold (e.g. 0.03%). Indicates excessive Long positioning/greed and potential for a short-term reversal (Long Squeeze risk). The dot is plotted at the positive `FR Signal Plot Level`.
* Bottom Dot (Excessive Shorts) : Triggered when Funding Rate is lower than -Abnormal Funding Rate Threshold(e.g. -0.03%). Indicates excessive Short positioning/fear and potential for a short-term reversal (Short Squeeze risk). The dot is plotted at the negative `FR Signal Plot Level`.
⚪ Leverage Case Scenarios (Price, OI Dynamics & Context)
The OI Z-Score reflects the premium/discount state of *leverage* (Open Interest) , not the price. The price may not be in a premium or discount area simply because the OI is. OI only indicates the volume of outstanding futures positions. You must observe price action and candlestick patterns alongside the OI movements to determine the true contextual hint. Understanding the relationship between price and Open Interest (OI) change is key to interpreting market movements. The cases listed below represent the most common and thinkable patterns, but do not exhaust all possible market behaviors.
1. Long Build-Up (Price ▲, OI ▲): New long positions enter, confirming the rising trend.
2. Short Build-Up (Price ▼, OI ▲): New short positions enter, confirming the falling trend. Due to the inherently long-biased nature of the crypto market, this scenario is less frequently observed than Long Build-Up.
3. Long Covering/liquidation (Price ▼, OI ▼): Existing longs are closed/liquidated. This activity usually results from Panic Selling or forced long liquidation.
4. Short Covering (Price ▲, OI ▼): Existing shorts are forced to close (Short Squeeze).
5. Long Trap (Price ▲, OI ▲ or ▼): Price rises, but OI suggests new positioning that might be trapping longs. Bearish candle pattern can be often shown with the sweep.
6. Short Trap (Price ▼, OI ▲ or ▼): Warning Sign - Price falls, but OI suggests new positioning that might be trapping shorts.
⚪ Key Input Parameters
OI Z-Score
* Period (Default: 50)
Determines how many recent bars are used to calculate the rolling mean and volatility (standard deviation) of the Open Interest data.
* Z-Score Threshold (Default: 2.0)
The critical level that the OI Z-Score must cross to be considered 'extreme' (overstretched leverage).
Funding Rate
* Abnormal FR Threshold (Default: 0.03)
The absolute percentage value (e.g., 0.03%) that the Funding Rate must exceed or fall below to trigger an extreme signal dot.
* FR Signal Plot Level (Default: 4.0)
Sets the fixed vertical position (Y-level) on the Z-Score chart where the Funding Rate signal dots will appear. (e.g., 4.0 plots the dot at the Z-Score +-4.0 level).
Disclaimer
This script is for educational and informational purposes only and does not constitute financial advice or investment recommendations. Trading cryptocurrencies involves significant risk and you are solely responsible for your own investment decisions, based on your financial situation, objectives, and risk tolerance. The author assumes no liability for losses arising from the use of this indicator.
