Crypto Leverage Index(OI Norm. + FR)Crypto Leverage Index (OI Z-Score + Funding Rate Signals)
(A tool for detecting speculative extremes and leverage load in crypto derivatives markets.)
Hello, fellow traders around the globe!
In today's crypto futures market, often perceived as a 'playground for large players' (whales/smart money), catching extreme leverage behavior is crucial for survival. I wanted to come up with an indicator to quickly identify such market extremes by focusing on the two most potent indicators of leveraged action: Open Interest (OI) and Funding Rate (FR). The goal is to ride on the shoulders of the market movers by anticipating their next liquidity-driven actions. hope this helps.
❗ IMPORTANT NOTE: This indicator works exclusively on Perpetual Futures or Swap Charts that provide Open Interest (OI) data.
⚪ Overview
This indicator provides a standardized view of speculative activity by calculating the Open Interest (OI) Z-Score . This score reveals when the current level of open leverage is abnormally high (premium) or low (discount) relative to its historical mean and volatility. The index is also augmented with Extreme Funding Rate Signals , which plot simple White Dots on the chart when derivative positioning (long or short bias) reaches an unsustainable, overheated level. The combination of OI volume and positioning bias offers a good method to identify potential market reversal zones driven by leverage liquidation risks (short/long squeezes).
⚪ Score Components
Open Interest Z-Score (Leverage Load)
The primary component standardizes the Open Interest value over a defined lookback `Period` (default 50). This calculation reveals the statistical deviation of current leverage from the norm.
OI Z-Score = (OI - Mean(OI)) / StDev(OI)
Funding Rate (Positioning Bias)
Calculates the approximate funding rate using a TWAP (Time-Weighted Average Price) of the Perpetual Futures Premium, combined with the standard 0.01% Interest Rate.
⚪ Extreme Condition Detection
OI Z-Score Extremes
* Premium Zone (Red Fill) : OI Z-Score is above the user-defined `Threshold` (default 2.0). Indicates high/overstretched leverage.
* Discount Zone (Green Fill) : OI Z-Score is below the user-defined negative threshold (default -2.0). Indicates low/unwinded leverage.
Funding Rate Extreme Signals (White Dots)
These appear as small White Dots ( · ) plotted at fixed levels within the indicator pane. The position indicates the bias:
* Top Dot (Excessive Longs) : Triggered when Funding Rate is greater than Abnormal Funding Rate Threshold (e.g. 0.03%). Indicates excessive Long positioning/greed and potential for a short-term reversal (Long Squeeze risk). The dot is plotted at the positive `FR Signal Plot Level`.
* Bottom Dot (Excessive Shorts) : Triggered when Funding Rate is lower than -Abnormal Funding Rate Threshold(e.g. -0.03%). Indicates excessive Short positioning/fear and potential for a short-term reversal (Short Squeeze risk). The dot is plotted at the negative `FR Signal Plot Level`.
⚪ Leverage Case Scenarios (Price, OI Dynamics & Context)
The OI Z-Score reflects the premium/discount state of *leverage* (Open Interest) , not the price. The price may not be in a premium or discount area simply because the OI is. OI only indicates the volume of outstanding futures positions. You must observe price action and candlestick patterns alongside the OI movements to determine the true contextual hint. Understanding the relationship between price and Open Interest (OI) change is key to interpreting market movements. The cases listed below represent the most common and thinkable patterns, but do not exhaust all possible market behaviors.
1. Long Build-Up (Price ▲, OI ▲): New long positions enter, confirming the rising trend.
2. Short Build-Up (Price ▼, OI ▲): New short positions enter, confirming the falling trend. Due to the inherently long-biased nature of the crypto market, this scenario is less frequently observed than Long Build-Up.
3. Long Covering/liquidation (Price ▼, OI ▼): Existing longs are closed/liquidated. This activity usually results from Panic Selling or forced long liquidation.
4. Short Covering (Price ▲, OI ▼): Existing shorts are forced to close (Short Squeeze).
5. Long Trap (Price ▲, OI ▲ or ▼): Price rises, but OI suggests new positioning that might be trapping longs. Bearish candle pattern can be often shown with the sweep.
6. Short Trap (Price ▼, OI ▲ or ▼): Warning Sign - Price falls, but OI suggests new positioning that might be trapping shorts.
⚪ Key Input Parameters
OI Z-Score
* Period (Default: 50)
Determines how many recent bars are used to calculate the rolling mean and volatility (standard deviation) of the Open Interest data.
* Z-Score Threshold (Default: 2.0)
The critical level that the OI Z-Score must cross to be considered 'extreme' (overstretched leverage).
Funding Rate
* Abnormal FR Threshold (Default: 0.03)
The absolute percentage value (e.g., 0.03%) that the Funding Rate must exceed or fall below to trigger an extreme signal dot.
* FR Signal Plot Level (Default: 4.0)
Sets the fixed vertical position (Y-level) on the Z-Score chart where the Funding Rate signal dots will appear. (e.g., 4.0 plots the dot at the Z-Score +-4.0 level).
Disclaimer
This script is for educational and informational purposes only and does not constitute financial advice or investment recommendations. Trading cryptocurrencies involves significant risk and you are solely responsible for your own investment decisions, based on your financial situation, objectives, and risk tolerance. The author assumes no liability for losses arising from the use of this indicator.
Cerca negli script per "Futures"

Luxy VWAP Magic - MTF Projection EngineThis indicator transforms the classic VWAP into a comprehensive trading system. Instead of switching between multiple indicators, you get everything in one place: multi-timeframe analysis, statistical bands, momentum detection, volume profiling, session tracking, and divergence signals.
What Makes This Different
Traditional VWAP indicators show a single line. This tool treats VWAP as a foundation for complete market analysis. The indicator automatically detects your asset type (stocks, crypto, forex, futures) and adjusts its behavior accordingly. Crypto traders get 24/7 session tracking. Stock traders get proper market hours handling. Everyone gets institutional-grade analytics.
Anchor Period Options
The anchor period determines when VWAP resets and recalculates. You have three categories of options:
Time-Based Anchors:
Session - Resets at market open. Best for intraday stock trading where you want fresh VWAP each day.
Day - Resets at midnight UTC. Standard option for most traders.
Week / Month / Quarter / Year - Longer reset periods for swing traders and position traders who want broader context.
Rolling Window Anchors:
Rolling 5D - A sliding 5-day window that never resets. Solves the Monday problem where weekly VWAP equals daily VWAP on first day of week.
Rolling 21D - Approximately one month of trading data in continuous calculation. Excellent for crypto and forex markets that trade 24/7 without clear session breaks.
Event-Based Anchors:
Dividends - Resets on ex-dividend dates. Track institutional cost basis from dividend events.
Splits - Resets on stock split dates. Useful for analyzing post-split trading behavior.
Earnings - Resets on earnings report dates. See where volume-weighted trading occurred since last quarterly report.
Standard Deviation Bands
Three sets of bands surround the main VWAP line:
Band 1 (Aqua) - Plus and minus one standard deviation. Approximately 68% of price action occurs within this range under normal distribution. Touches suggest minor extension.
Band 2 (Fuchsia) - Plus and minus two standard deviations. Only 5% of trading should occur outside this range statistically. Touches here indicate significant overextension and high probability of mean reversion.
Band 3 (Purple) - Plus and minus three standard deviations. Touches are rare (0.3% probability) and represent extreme conditions. Often marks climax moves or panic selling/buying.
Each band can be toggled independently. Most traders show Band 1 by default and add Band 2 and 3 for specific setups or volatile instruments.
Multi-Timeframe VWAP System
The MTF section plots previous period VWAPs as horizontal support and resistance levels:
Daily VWAP - Previous day's final VWAP value. Key intraday reference level.
Weekly VWAP - Previous week's final VWAP. Important for swing traders.
Monthly VWAP - Previous month's final VWAP. Institutional benchmark level.
Quarterly VWAP - Previous quarter's final VWAP. Major support/resistance for position traders.
Previous Day VWAP - Yesterday's closing VWAP specifically, separate from current daily calculation.
The Confluence Zone percentage setting determines how close multiple VWAPs must be to trigger a confluence alert. When two or more timeframe VWAPs converge within this threshold, you get a high-probability support/resistance zone.
Session VWAPs for Global Markets
For forex, crypto, and futures traders who operate in 24/7 markets, the indicator tracks three major global sessions:
Asia Session - UTC 21:00 to 08:00. Gold colored line. Typically lower volatility, range-bound action that sets overnight levels.
London Session - UTC 08:00 to 17:00. Orange colored line. Often determines daily direction with high volume European participation.
New York Session - UTC 13:00 to 22:00. Blue colored line. Highest volume session globally. Sharp directional moves common.
Previous session VWAP values display as horizontal lines when each session closes, acting as intraday support and resistance. The table shows which sessions are currently active with checkmarks.
On-Chart Labels and Signals
The indicator plots several types of labels directly on price action when significant events occur:
Volume Spike Labels
Fire when current bar volume exceeds configurable thresholds relative to both the previous bar and the 20-bar average. Default settings require 300% of previous bar AND 200% of average volume. Green labels indicate bullish candles. Red labels indicate bearish candles. These spikes often mark institutional entry points.
Momentum Shift Labels
Appear when VWAP acceleration changes direction. The Slowing label warns when an active trend loses steam, often preceding reversal. The Accelerating label confirms trend continuation or potential bottom during downtrends. Filters available to show only reversal signals in existing trends.
VWAP Squeeze Labels
Detect when standard deviation bands contract relative to ATR (Average True Range). Low volatility compression often precedes explosive breakout moves. When the squeeze fires (releases), a label appears with directional prediction based on VWAP slope.
Divergence Labels
Mark price/volume divergences using CVD (Cumulative Volume Delta) analysis:
Bullish divergence: Price makes lower low, but CVD makes higher low. Hidden accumulation despite price weakness.
Bearish divergence: Price makes higher high, but CVD makes lower high. Hidden distribution despite price strength.
Dynamic VWAP Coloring
The main VWAP line changes color based on its slope direction:
Green - VWAP is rising. Institutional buying pressure. Volume-weighted price increasing.
Red - VWAP is falling. Institutional selling pressure. Volume-weighted price decreasing.
Gray - VWAP is flat. Consolidation or balance between buyers and sellers.
This coloring can be disabled for a static blue line if you prefer cleaner visuals. The VWAP label next to the line shows the current trend direction and delta percentage.
Calculated Projection Cone
One of the most powerful features is the Calculated Projection Cone. Unlike traditional extrapolation methods that simply extend a trend line forward, this system analyzes what actually happened in similar market conditions throughout the chart's history.
How It Works:
The system classifies each bar into one of 27 unique market states:
Z-Score Level - LOW (oversold), MID (fair value), or HIGH (overbought) based on configurable thresholds
Trend Direction - DOWN, FLAT, or UP based on VWAP slope
Volume Profile - LOW (below 80%), NORMAL (80-150%), or HIGH (above 150%) relative volume
When you look at the current bar, the indicator:
1. Identifies the current market state (e.g., LOW Z-Score + UP Trend + HIGH Volume)
2. Searches through all historical bars on the chart that had the same state
3. Calculates what happened in those bars X bars later (where X is your projection horizon)
4. Shows you the probability of up/down and the average move size
Visual Elements:
Probability Cone - Colored green (bullish probability above 55%), red (bearish below 45%), or gold (neutral). The cone width represents the historical range of outcomes (roughly the 20th to 80th percentile).
Center Line - Shows the average expected price based on historical outcomes in similar conditions.
Probability Label - Displays direction probability and average move. Example: "67% UP (+0.8%)" means 67% of similar past cases moved up, averaging 0.8% gain.
Fallback System:
When the exact 27-state match has insufficient historical data:
First fallback: Uses Z-Score plus Trend only (9 broader states, ignoring volume)
Second fallback: Uses Z-Score only (3 states)
When fallback is active, confidence automatically adjusts
Settings:
Projection Horizon - How many bars forward to analyze outcomes (5, 10, 15, or 20 bars, default 10)
Lookback Period - Historical data window in days (30-252, default 60)
Minimum Samples - Cases needed before using fallback (5-30, default 10)
Z-Score Threshold - Bucket boundary for LOW/MID/HIGH classification (1.0, 1.5, or 2.0 sigma)
Cloud Transparency - Adjust visibility (50-95%)
Colors - Customize bullish, bearish, and neutral cone colors
Confidence Levels:
HIGH - 30 or more similar historical cases found
MEDIUM - 15-29 similar cases
LOW - Fewer than 15 cases (more uncertainty)
IMPORTANT DISCLAIMER:
The Calculated Projection is based on past patterns only. It is NOT a price prediction or financial advice. Similar market states in the past do not guarantee similar outcomes in the future. The probability shown is historical frequency, not a guarantee. Always combine with other analysis and never rely solely on projections for trading decisions.
Alert Conditions
The indicator includes over 20 pre-built alert conditions:
Price vs VWAP:
Price crosses above VWAP
Price crosses below VWAP
Band Touches:
Price touches plus or minus one sigma band
Price touches plus or minus two sigma band (extreme)
Price touches plus or minus three sigma band (very extreme)
Z-Score Extremes:
Z-Score crosses above plus two (overbought extreme)
Z-Score crosses below minus two (oversold extreme)
Momentum and Trend:
Momentum slowing
Momentum accelerating
Trend turns bullish/bearish/neutral
Volume:
Volume spike detected
CVD Direction:
Buyers take control
Sellers take control
High Probability Signals:
Bullish reversal signal (oversold plus accelerating momentum)
Bearish reversal signal (overbought plus slowing momentum)
MTF and Special:
MTF confluence zone entry
VWAP squeeze fired
Bullish/Bearish divergence detected
Any significant signal (catch-all)
All signals use confirmed bar data to prevent false alerts from incomplete candles.
Settings Overview
Settings are organized into logical groups:
VWAP Settings
Anchor Period selection
Show/Hide VWAP line
Dynamic coloring toggle
VWAP label visibility
Bands Visibility
Toggle each of three bands independently
Info Table
Show/Hide table
Table position (9 options)
Text size
Volume spike label settings with adjustable thresholds
Momentum label settings with filters
Signal labels limited to 5 most recent (auto-managed)
Probability engine lookback period
Multi-Timeframe VWAP
Enable/Disable MTF system
Show MTF in table
Show MTF lines on chart
Individual timeframe toggles
Confluence zone threshold
Squeeze detection toggle
Session VWAPs
Enable/Disable session tracking
Apply to all assets option
Show session labels
Divergence Detection
Enable/Disable divergence
Pivot lookback period
Show divergence labels
Calculated Projection
Enable/Disable projection cone
Projection horizon (5, 10, 15, or 20 bars)
Lookback period in days (30-252)
Minimum samples threshold
Z-Score classification threshold (1.0, 1.5, or 2.0 sigma)
Cloud transparency adjustment
Bullish, bearish, and neutral colors
The Info Table - Your Trading Dashboard
The right side of your chart displays a compact table with up to twelve metrics.
Row-by-Row Breakdown:
Asset and Period - Shows what the indicator detected (US Stock, Crypto, Forex, etc.) and your selected anchor period. The detection happens automatically based on exchange data, so VWAP resets and calculations match your actual trading instrument.
Delta Percentage - How far current price sits from VWAP, expressed as a percentage. Positive means price trades above fair value. Negative means below. Large delta values (beyond 1-2%) often precede mean reversion moves. Day traders watch this for overextension.
Z-Score - Statistical deviation from VWAP measured in standard deviations. Unlike raw delta, Z-Score accounts for volatility. A 2% move in a volatile biotech stock differs from 2% in a stable utility. Z-Score normalizes this. Values beyond plus or minus two sigma occur only 5% of the time statistically.
Trend Direction - Whether VWAP itself is rising, falling, or flat. Rising VWAP means the volume-weighted average price is increasing, which indicates institutional accumulation. Falling VWAP suggests distribution. This differs from price trend since it weights by volume.
Momentum State - Is the trend accelerating or slowing down? This measures the rate of change in VWAP slope. When an uptrend shows slowing momentum, it often precedes reversal. Accelerating momentum in a downtrend can signal capitulation and potential bottom.
Relative Volume - Current bar volume compared to the 20-bar average, shown as percentage. Values above 150% indicate above-average activity. Spikes above 200-300% often mark institutional involvement. Low volume (below 80%) warns of potential fake moves.
MTF Bias - Four checkmarks or X marks showing whether price sits above or below Daily, Weekly, Monthly, and Quarterly VWAP. Four checkmarks means strong bullish alignment across all timeframes. Four X marks indicates bearish alignment. Mixed readings suggest consolidation or transition.
Band Probabilities - Historical statistics showing how often price touched each standard deviation band over your lookback period. This helps you understand if mean reversion or trend following works better for your specific instrument.
Session Status - Which global trading sessions are currently active (Asia, London, New York). Shows checkmarks for active sessions. Important for forex and crypto traders who need to know when major liquidity windows open and close.
Divergence State - Whether the indicator detects bullish or bearish divergence between price and cumulative volume delta. Bullish divergence occurs when price makes lower lows but buying pressure (CVD) makes higher lows, suggesting hidden accumulation.
Confidence Score - A weighted composite of all factors displayed as a progress bar and percentage. Combines MTF alignment, Z-Score, trend direction, volume delta, momentum, and relative volume into a single 0-100 score. Higher scores indicate stronger conviction setups.
Calculated Projection - When the Projection Cone is enabled, shows the historical probability of price direction and expected move. For example: "▲ 67% (+0.8%)" means in similar market states historically, price moved up 67% of the time with an average gain of 0.8%. The system analyzes 27 unique market states based on Z-Score, Trend, and Volume conditions.
Recommended Use Cases
Day Trading Stocks:
Use Session anchor with Band 1 visible. Watch for price returning to VWAP after morning move. Volume spikes near VWAP often mark institutional accumulation zones.
Swing Trading:
Use Weekly or Rolling 21D anchor. Enable MTF lines for Daily and Weekly levels. Trade pullbacks to these levels in direction of MTF bias.
Crypto and Forex:
Enable Session VWAPs. Use Rolling anchors to avoid artificial resets. Monitor session transitions for breakout opportunities.
Mean Reversion:
Focus on Z-Score reaching plus or minus two. Add Band 2 visibility. Combine with slowing momentum for highest probability reversals.
Trend Following:
Watch MTF bias alignment. Four checkmarks plus accelerating momentum plus high volume confirms trend continuation setups.
Projection Planning:
Enable the Calculated Projection to see what happened historically in similar market conditions. Use 5-10 bars for intraday setups, 15-20 bars for swing trade planning. Focus on high probability readings (above 60%) with HIGH confidence (30 or more samples). The cone shows the probable range of outcomes based on actual historical data. Combine with other factors like MTF alignment and volume for higher conviction setups.
Important Notes
The indicator does not repaint. MTF values use previous period's confirmed data.
Rolling VWAP works best on 15-minute timeframes and above due to bar lookback requirements.
Session VWAPs apply to global markets by default (forex, crypto, futures). Enable the all-assets option for stocks if desired.
Volume data for forex represents tick volume, not actual traded volume.
All alert conditions fire only on confirmed (closed) bars to prevent false signals.
The Calculated Projection updates each bar as market state changes. This is expected behavior. The projection shows probabilities based on similar past conditions, not a fixed prediction.
Q AND A
Q: Does this indicator repaint?
A: No. The main VWAP calculation uses standard TradingView VWAP methodology. Multi-timeframe values use previous period's confirmed data with appropriate lookahead settings. All alert signals require bar confirmation.
Q: Why does my Rolling VWAP look different on 1-minute versus 15-minute charts?
A: Rolling VWAP calculates across a fixed number of trading days. On very short timeframes, the bar lookback may hit TradingView limits. For best Rolling VWAP accuracy, use 15-minute or higher timeframes.
Q: Can I use this on any instrument?
A: Yes. The indicator automatically detects asset type and adjusts behavior. Stocks use standard market hours. Crypto uses 24/7 calculations. Forex uses tick volume. Everything adapts automatically.
Q: What does the Confidence Score actually measure?
A: The score combines six weighted factors: MTF alignment (25%), Z-Score position (20%), Trend direction (20%), CVD pressure (15%), Momentum state (10%), and Relative volume (10%). Higher scores indicate more factors aligned in one direction.
Q: Why are Session VWAPs not showing on my stock chart?
A: Session VWAPs apply to 24-hour markets by default (forex, crypto, futures). For stocks, enable the Use for All Assets option in Session VWAP settings.
Q: The Divergence labels appear delayed. Is this a bug?
A: Divergence detection requires pivot confirmation, which needs bars on both sides of the pivot point. The label appears at the actual pivot location (several bars back) once confirmed. This is intentional and prevents false signals.
Q: Can I change the band colors?
A: Yes. Each of the three bands has its own color input setting. You can customize Band 1, Band 2, and Band 3 colors to match your preferences. The defaults are Aqua, Fuchsia, and Purple. The main VWAP line color adapts dynamically based on slope direction or can be set to static blue.
Q: How do I set up alerts?
A: Right-click on the chart, select Add Alert, choose this indicator, and select your desired condition from the dropdown. All conditions include descriptive alert messages with relevant data.
Q: What is the Probability Engine lookback period?
A: This setting determines how many trading days the indicator analyzes to calculate band touch rates and mean reversion statistics. Default is 60 days (approximately 3 months). Longer periods provide more stable statistics but may miss recent behavior changes.
Q: Why do I see fewer labels than expected?
A: Signal labels (Volume, Momentum, Squeeze, Divergence) are limited to 5 most recent labels on the chart to keep it clean. When a new label appears, the oldest one is automatically removed. Additionally, momentum labels have several filters: check the slope multiplier setting (higher values require stronger trends) and the Only Reversal Signals option (when enabled, labels only appear for potential reversals, not trend confirmations).
Q: What is the Calculated Projection and how accurate is it?
A: The Calculated Projection analyzes what happened in past market conditions similar to the current state. It classifies each bar by Z-Score level, Trend direction, and Volume profile (27 unique states), then shows the historical probability of up vs down and the average move size. It is NOT a price prediction or guarantee. The probability shown is how often similar conditions led to up/down moves historically, not a future guarantee. Always use it as one input among many.
Q: Why does the Projection probability change?
A: The projection updates on each bar as market state changes. If Z-Score moves from LOW to MID, or trend shifts from UP to FLAT, the system looks up a different historical category. This is expected behavior. The projection shows what happened in similar past conditions to the current bar's state.
Q: The Projection shows LOW confidence. What does that mean?
A: Confidence levels indicate sample size: HIGH means 30 or more historical cases found, MEDIUM means 15-29 cases, LOW means fewer than 15 cases. When sample size is low, the system uses a fallback: first aggregating by Z-Score plus Trend only (ignoring volume), then by Z-Score only. LOW confidence means less statistical reliability, so weight other factors more heavily in your decision.
Q: Why does the cone sometimes show 50/50 probability?
A: A 50/50 reading means that in similar past market states, price moved up roughly half the time and down half the time. This indicates a neutral or balanced condition where historical patterns provide no directional edge. Consider waiting for a higher probability setup or using other analysis methods.
CREDITS AND ACKNOWLEDGMENTS
Methodology Foundation:
VWAP (Volume Weighted Average Price) - Standard institutional benchmark calculation, widely used since the 1980s for algorithmic execution and fair value assessment
Standard Deviation Bands - Statistical volatility measurement applying normal distribution principles to price deviation from mean
Z-Score Analysis - Classic statistical normalization technique for comparing values across different volatility regimes
Cumulative Volume Delta (CVD) - Order flow analysis concept measuring aggressive buying versus selling pressure
Concept Integration:
Mean reversion probability engine - Custom historical statistics tracking for band touch rates
Momentum acceleration detection - Second derivative analysis of VWAP slope changes
VWAP Squeeze - Volatility compression concept adapted from TTM Squeeze methodology applied to VWAP bands versus ATR
Confidence scoring system - Weighted composite scoring combining multiple technical factors
Calculated Projection Cone - Probability-based projection using 27-state market classification (Z-Score, Trend, Volume) with historical outcome analysis and weighted fallback system
All calculations use standard public domain formulas and TradingView built-in functions. No proprietary third-party code was used.
For questions, feedback, or feature requests, please comment below or send a private message.
Happy Trading!

Morning ORB FVG Trigger✅ Overview
Morning ORB FVG Trigger is a complete intraday trading framework built around:
A Morning Opening Range Breakout (ORB)
The first Fair Value Gap (FVG) after that breakout
Strict risk management and position sizing
Optional HTF trend filter (Daily / Weekly / Monthly)
Optional Daily ATR filter to avoid extreme days
The script is designed for futures / indices / FX on intraday charts up to 15 minutes and for traders who want a clean, mechanical entry framework with clear risk.
🧠 Core idea
Define a morning opening range (e.g. 09:30–09:45).
Wait for a clean breakout above/below that range.
After the breakout, wait for the first FVG in breakout direction,
confirmed by the next candle (no immediate full reclaim).
Use a chosen stop logic + R:R factor to build risk/reward boxes.
Calculate position size based on your account risk.
(Optional) Only take trades:
In the direction of the HTF EMA trend (D/W/M).
On days where the morning range is within a band of the Daily ATR.
You can also disable all signals/boxes and use the script just as a visual ORB tool.
⏰ 1. ORB / Morning Range
Inputs (Main section)
Morning Range Session
Time window of the opening range in exchange time
Example: 09:30–09:45 for a 15-minute ORB.
You can type custom ranges (e.g. 09:30–09:35 for a 5-minute ORB).
Risk/Reward (TP factor)
Multiplier for the take-profit distance relative to the stop.
2.0 = TP is 2× the stop distance
1.5 = TP is 1.5× the stop distance
Show ORB range
If enabled, draws:
ORB high/low lines
ORB labels (e.g. 15min ORB high / low)
Optional midline
Extend ORB lines to the right (bars)
How many bars to extend the ORB high/low horizontally beyond the ORB itself.
Trade box width (bars)
Horizontal width (in bars) of:
Red risk box (entry–stop)
Green reward box (entry–TP)
Implementation details
The ORB is always calculated on 1-minute data internally, so it stays precise even on 5m/15m charts.
The script only works on intraday timeframes up to 15 minutes.
📦 2. FVG Block
Group: “FVG”
Threshold %
Minimum size of an FVG in % of price.
0 = every FVG
Higher values = only larger gaps
Auto threshold (from volatility)
If enabled, the minimum FVG size is derived from historical volatility
instead of a fixed percentage.
Allow breakout FVG partly inside ORB
Off (default): the FVG must lie fully outside the ORB.
On: the breakout FVG itself may still overlap the ORB a bit,
as long as it is the first one attached to the breakout move.
Enable FVG entry signals, boxes & alerts
On: full system – FVG detection, entry labels, risk/TP boxes, alerts.
Off: no entries, no risk/TP boxes, no alerts.
You only get the ORB and (optionally) the HTF dashboard, so you can trade your own setups.
Entry mode
Entry mode (Mid / Edge / NextOpen)
Mid – Entry at the midpoint of the FVG.
Edge – Long at the upper FVG edge, short at the lower FVG edge.
NextOpen – No limit order in the gap. Entry is placed at the next bar open after FVG confirmation.
Edge offset (ticks)
Additional offset for Edge entries:
Long:
+ticks = a bit above the FVG (more conservative)
-ticks = deeper into the FVG (more aggressive)
Short:
+ticks = a bit below the FVG
-ticks = deeper into the FVG
FVG detection logic
Uses a LuxAlgo-style 3-candle FVG pattern (gap between candle 1 and 3).
Only one FVG is taken: the first valid FVG after the ORB breakout in breakup direction.
The FVG candle is the middle bar; the script:
Detects the FVG on the previous bar.
Waits for the current bar to confirm it:
Bullish: current low must stay above the lower FVG boundary
Bearish: current high must stay below the upper FVG boundary
Only then an entry signal is generated.
🛑 3. Stop Logic
Group: “Stop Logic”
Stop mode (PrevBar / Pivot / FVG Candle)
PrevBar – Stop at the low/high of the candle before the FVG
(tight/aggressive).
FVG Candle – Stop at the low/high of the FVG candle itself
(medium).
Pivot – Stop at the most recent swing high/low
using pivotLeft / pivotRight pivots (more conservative).
Ticks (stop buffer)
Offset (in ticks) from the selected stop level.
> 0 = further away (more room, more risk)
< 0 = closer (tighter stop)
Pivot left / Pivot right
Number of candles left/right to define a swing high/low
when using Pivot stop mode.
Typical intraday values: 2–3.
The script also sanity-checks the stop:
if the calculated stop would be invalid (e.g. above entry in a long), it moves it by a minimal distance (2 ticks) to keep a valid risk.
📈 4. HTF Trend Filter (Daily / Weekly / Monthly)
Group: “HTF Trend Filter”
Enable HTF trend filter
If enabled, trades are only allowed:
Long when at least 2 of D/W/M closes are above their EMA
Short when at least 2 of D/W/M closes are below their EMA
EMA length (D/W/M)
EMA length for all three higher timeframes (Daily, Weekly, Monthly).
This helps focus entries in the direction of the dominant higher-timeframe trend.
📊 5. ATR Filter (Daily)
Group: “ATR Filter (Daily)”
Use daily ATR filter
If enabled, the height of the ORB (ORB high – ORB low) must be within
a band of the Daily ATR to allow any signals.
Daily ATR length
ATR period on the Daily timeframe.
Min ORB size vs ATR
Lower bound:
Example: 0.3 → ORB must be at least 0.3 × Daily ATR
0.0 = no minimum.
Max ORB size vs ATR
Upper bound:
Example: 1.5 → ORB must be ≤ 1.5 × Daily ATR
0.0 = no maximum.
If the ORB is too small (choppy) or too large (exhausted move), no breakout or FVG signal will be generated on that day.
🧭 6. HTF Dashboard & Signal Labels
Group: “HTF Trend Dashboard”
Show HTF dashboard
Draws a small label at the top of the chart showing:
HTF Trend (EMA X)
D: UP/FLAT/DOWN
W: UP/FLAT/DOWN
M: UP/FLAT/DOWN
Dashboard position
Top Right, Top Center, Top Left – places the dashboard at the top.
Over Risk Info – no top dashboard; instead, the HTF trend info is shown as a label near the risk box when a new signal appears.
Lookback (bars) for top anchor
How many bars to use to determine the top price level for dashboard placement.
Show HTF trend above risk box on signal
Only relevant if Dashboard position = Over Risk Info.
When enabled, a small HTF label appears near the risk box for each new trade.
Signal label vertical offset (ticks)
Vertical spacing between risk info label and HTF label.
Minimum spacing HTF/Risk (ticks)
Ensures a minimum vertical distance so the two labels don’t overlap.
HTF signal label X offset (bars)
Horizontal offset (left/right) relative to the risk info label.
⏳ 7. ORB–FVG Filters (Session & Time Window)
Group: “ORB FVG Filter”
Only same session day
If enabled, FVG entries are only allowed on the same calendar day
as the ORB. When the date changes, all state & drawings are reset.
Limit hours after ORB
Enables a time window after the ORB end.
Trading window after ORB (hours)
Length of that window in hours.
Example: 2.0 → FVG signals only in the first 2 hours after ORB end.
💰 8. Risk Management & Position Sizing
Group: “Risk Management”
Calculate position size
If enabled, the script computes suggested mini and micro contract size for you.
Account size
Your trading account size (in account currency).
Risk mode
Percent – risk is a % of account size (Account risk %).
Fixed amount – risk is a fixed dollar amount (Fixed risk ($)).
Account risk %
Risk per trade as a percentage of account size (e.g. 1.0 for 1%).
Fixed risk ($)
Fixed risk per trade in dollars when using Fixed amount mode.
Micro factor (vs mini)
How much a micro contract is worth relative to a mini.
Example:
0.1 → one micro moves 1/10 of one mini.
Risk Info label
For each new trade, a label is shown above the boxes with:
Stop distance in price and $ risk per mini
Max risk allowed for the trade
Suggested mini and micro size
Text like:
Suggested: 2 mini
Suggested: 5 micro
or Suggested: no trade
This makes the script especially useful for prop-firm rules or strict risk discipline.
🎨 9. Visual Style (Boxes, Labels, ORB Lines)
Group: “Box & Label Style (Trade)”
Label font size (Very small, Small, Normal, Large)
Entry label BG / text color
Stop label BG / text color
TP label BG / text color
Risk info BG / text color
Risk box color (entry–stop zone)
Reward box color (entry–TP zone)
Group: “ORB Style”
ORB high line color
ORB low line color
ORB line width
ORB label font size
ORB label background color
ORB label text color
Show ORB midline
ORB midline color / width / style (Solid / Dashed / Dotted)
⚠️ 10. Alerts
Group: “Alerts”
The script defines three alert conditions:
Long entry FVG breakout
Triggered when a new long signal appears.
Short entry FVG breakout
Triggered when a new short signal appears.
FVG entry (long/short)
Generic alert for any new signal (long or short).
To use them:
Add the indicator to the chart.
Open the Alerts dialog → “Condition”.
Select this script and one of the alert conditions.
Set your preferred expiration and notification settings.
Alerts only fire when Enable FVG entry signals, boxes & alerts is on.
🧩 11. How the trading logic flows (summary)
Build ORB on 1-minute data during the selected session.
Optionally reject the day if ORB is outside the ATR bounds.
Wait for a breakout (close above high or below low), respecting HTF trend filter.
After breakout, look for the first valid FVG in that direction:
Outside the ORB (unless breakout FVG allowed inside)
Confirmed by the next candle (no full reclaim)
Once confirmed:
Compute entry, stop, target.
Draw risk/reward boxes and all labels.
Optionally show HTF signal label over the risk info.
Trigger alerts if enabled.
If you disable FVG signals, only steps 1–3 (plus dashboard) are effectively active.
⚠️ 12. Notes & Disclaimer
Script is intended for intraday trading up to 15-minute timeframes.
All signals are mechanical and do not guarantee profitability.
Always backtest and forward-test on your own data before risking real money.
This script is for educational purposes only and is not financial advice.
🚀 Quick-start guide
Add the script to your chart
Use an intraday timeframe ≤ 15 minutes (1m, 3m, 5m, 15m).
Works best on liquid indices, futures, FX and large-cap stocks.
Set the Morning Range
In “Morning Range Session” choose the exchange’s opening window.
Examples
US index futures (CME): 08:30–08:45 or 08:30–08:35
US stocks (NYSE/Nasdaq): 09:30–09:45 or 09:30–09:35
The ORB is always calculated on 1-minute data internally, so the range stays accurate on higher intraday charts.
Keep the default filters at first
HTF Trend Filter: ON
EMA length = 20
This will only allow trades in the direction of the dominant D/W/M trend.
ATR Filter: OFF (optional; you can enable later once you’re comfortable).
Use the full trade system
In the FVG group leave
“Enable FVG entry signals, boxes & alerts” = ON
Entry mode: Mid
Stop mode: FVG Candle or PrevBar
Risk/Reward: 2.0 as a starting point.
Set your risk
Turn on “Calculate position size”.
Enter your Account size and choose either:
Risk mode = Percent (e.g. 1.0 = 1% per trade), or
Risk mode = Fixed amount (e.g. $250 per trade).
The risk info label will show:
Stop distance in price and $/contract
Max allowed risk
Suggested mini and micro contract size.
Enable alerts (optional)
Open the Alerts dialog → Condition: this script.
Choose one of:
Long entry FVG breakout
Short entry FVG breakout
FVG entry (long/short)
Choose “Once per bar” or “Once per bar close”, and your preferred notification type.
Replay & journal
Use the TradingView bar replay tool to step through past days.
Focus on:
How the ORB defines the structure.
How the first confirmed FVG outside the ORB behaves.
Whether the risk/TP levels fit your own style and product.
🎛 Recommended settings & profiles
These are starting points, not rules. Always adapt to the instrument and your own risk tolerance.
1. Conservative / Trend-following
Timeframe: 5m or 15m
Morning Range Session: 15-minute ORB around the cash or futures open
FVG
Threshold %: 0.05–0.1 (filter out very small gaps)
Auto threshold: OFF (keep it simple)
Allow breakout FVG partly inside ORB: OFF
Enable FVG entry signals/boxes/alerts: ON
Entry mode: Mid
Stop Logic
Stop mode: Pivot
Pivot left/right: 2–3
Stop buffer: +1–2 ticks
HTF Trend Filter
Enabled: ON
EMA length: 20
ATR Filter
Enabled: ON
Daily ATR length: 14
Min ORB vs ATR: 0.3–0.4
Max ORB vs ATR: 1.2–1.5
Risk Management
Risk mode: Percent
Account risk: 0.5–1.0%
Idea: Only trade when the higher-timeframe trend supports the move and the opening range is of a “normal” size for the current volatility.
2. Balanced / Intraday directional
Timeframe: 3m or 5m
FVG
Threshold %: 0.02–0.05
Auto threshold: ON (lets the script adapt to volatility)
Allow breakout FVG partly inside ORB: ON
(first breakout FVG may partly sit inside the ORB)
Entry mode: Edge
Edge offset (ticks): 0 or +1
Stop Logic
Stop mode: FVG Candle
Stop buffer: 0–1 ticks
HTF Trend Filter
Enabled: ON
ATR Filter
Enabled: OFF (optional)
Risk Management
Risk mode: Percent
Account risk: 1.0–1.5% (if this fits your plan)
Idea: Slightly more aggressive entries at the gap edge, still aligned with HTF trend, but with more flexibility on ATR.
3. Aggressive / Scalping around the ORB
Timeframe: 1m or 3m
FVG
Threshold %: 0.0–0.02
Auto threshold: ON
Allow breakout FVG partly inside ORB: ON
Entry mode: NextOpen or Edge with a negative offset (deeper into the gap)
Stop Logic
Stop mode: PrevBar
Stop buffer: 0 or -1 tick
HTF Trend Filter
Enabled: OFF (or ON but treat as soft guidance)
ATR Filter
Enabled: OFF
Risk Management
Risk mode: Percent
Account risk: lower, e.g. 0.25–0.5% per trade
Idea: More trades and tighter stops. Best for experienced traders who understand the limitations of scalping and whipsaw risk.
Final reminder
All of these are templates, not guarantees:
Always check how the system behaves on your market and session.
Start on replay and demo before trading real money.
Adjust filters (HTF, ATR, thresholds) until the signals fit your personal approach.

Yelober - Market Internal direction+ Key levelsYelober – Market Internals + Key Levels is a focused intraday trading tool that helps you spot high-probability price direction by anchoring decisions to structure that matters: yesterday’s RTH High/Low, today’s pre-market High/Low, and a fast Value Area/POC from the prior session. Paired with a compact market internals dashboard (NYSE/NASDAQ UVOL vs. DVOL ratios, VOLD slopes, TICK/TICKQ momentum, and optional VIX trend), it gives you a real-time read on breadth so you can choose which direction to trade, when to enter (breaks, retests, or fades at PMH/PML/VAH/VAL/POC), and how to plan exits as internals confirm or deteriorate. On top of these intraday decision benefits, it also allows traders—in a very subtle but powerful way—to keep an eye on the VIX and immediately recognize significant spikes or sharp decreases that should be factored in before entering a trade, or used as a quick signal to modify an existing position. In short: clear levels for the chart, live internals for the context, and a smarter, rules-based path to execution.
# Yelober – Market Internals + Key Levels
*A TradingView indicator for session key levels + real‑time market internals (NYSE/NASDAQ TICK, UVOL/DVOL/VOLD, and VIX).*
**Script name in Pine:** `Yelober - Market Internal direction+ Key levels` (Pine v6)
---
## 1) What this indicator does
**Purpose:** Help intraday traders quickly find high‑probability reaction zones and read market internals momentum without switching charts. It overlays yesterday/today’s **automatic price levels** on your active chart and shows a **market breadth table** that summarizes NYSE/NASDAQ buying pressure and TICK direction, with an optional VIX trend read.
### Key features at a glance
* **Automatic Price Levels (overlay on chart)**
* Yesterday’s High/Low of Day (**yHoD**, **yLoD**)
* Extended Hours High/Low (**yEHH**, **yEHL**) across yesterday AH + today pre‑market
* Today’s Pre‑Market High/Low (**PMH**, **PML**)
* Yesterday’s **Value Area High/Low** (**VAH/VAL**) and **Point of Control (POC)** computed from a volume profile of yesterday’s **regular session**
* Smart de‑duplication:
* Shows **only the higher** of (yEHH vs PMH) and **only the lower** of (yEHL vs PML) to avoid redundant bands
* **Market Breadth Table (on‑chart table)**
* **NYSE ratio** = UVOL/DVOL (signed) with **VOLD slope** from session open
* **NASDAQ ratio** = UVOLQ/DVOLQ (signed) with **VOLDQ slope** from session open
* **TICK** and **TICKQ**: live cumulative ratio and short‑term slope
* **VIX** (optional): current value + slope over a configurable lookback/timeframe
* Color‑coded trends with sensible thresholds and optional normalization
---
## 2) How to use it (trader workflow)
1. **Mark your reaction zones**
* Watch **yHoD/yLoD**, **PMH/PML**, and **VAH/VAL/POC** for first touches, break/retest, and failure tests.
* Expect increased responsiveness when multiple levels cluster (e.g., PMH ≈ VAH ≈ daily pivot).
2. **Read the breadth panel for context**
* **NYSE/NASDAQ ratio** (>1 = more up‑volume than down‑volume; <−1 = down‑dominant). Strong green across both favors long setups; red favors short setups.
* **VOLD slopes** (NYSE & NASDAQ): positive and accelerating → broadening participation; negative → persistent pressure.
* **TICK/TICKQ**: cumulative ratio and **slope arrows** (↗ / ↘ / →). Use the slope to gauge **near‑term thrust or fade**.
* **VIX slope**: rising VIX (red) often coincides with risk‑off; falling VIX (green) with risk‑on.
3. **Confluence = higher confidence**
* Example: Price reclaims **PMH** while **NYSE/NASDAQ ratios** print green and **TICK slopes** point ↗ — consider break‑and‑go; if VIX slope is ↘, that adds risk‑on confidence.
* Example: Price rejects **VAH** while **VOLD slopes** roll negative and VIX ↗ — consider fade/reversal.
4. **Risk management**
* Place stops just beyond key levels tested; if breadth flips, tighten or exit.
> **Timeframes:** Works best on 1–15m charts for intraday. Value Area is computed from **yesterday’s RTH**; choose a smaller calculation timeframe (e.g., 5–15m) for stable profiles.
---
## 3) Inputs & settings (what each option controls)
### Global Style
* **Enable all automatic price levels**: master toggle for yHoD/yLoD, yEHH/yEHL, PMH/PML, VAH/VAL/POC.
* **Line style/width**: applies to all drawn levels.
* **Label size/style** and **label color linking**: use the same color as the line or override with a global label color.
* **Maximum bars lookback**: how far the script scans to build yesterday metrics (performance‑sensitive).
### Value Area / Volume Profile
* **Enable Value Area calculations** *(on by default)*: computes yesterday’s **POC**, **VAH**, **VAL** from a simplified intraday volume profile built from yesterday’s **regular session bars**.
* **Max Volume Profile Points** *(default 50)*: lower values = faster; higher = more precise.
* **Value Area Calculation Timeframe** *(default 15)*: the security timeframe used when collecting yesterday’s highs/lows/volumes.
### Individual Level Toggles & Colors
* **yHoD / yLoD** (yesterday high/low)
* **yEHH / yEHL** (yesterday AH + today pre‑market extremes)
* **PMH / PML** (today pre‑market extremes)
* **VAH / VAL / POC** (yesterday RTH value area + point of control)
### Market Breadth Panel
* **Show NYSE / NASDAQ / VIX**: choose which series to display in the table.
* **Table Position / Size / Background Color**: UI placement and legibility.
* **Slope Averaging Periods** *(default 5)*: number of recent TICK/TICKQ ratio points used in slope calculation.
* **Candles for Rate** *(default 10)* & **Normalize Rate**: VIX slope calculation as % change between `now` and `n` candles ago; normalize divides by `n`.
* **VIX Timeframe**: optionally compute VIX on a higher TF (e.g., 15, 30, 60) for a smoother regime read.
* **Volume Normalization** (NYSE & NASDAQ): display VOLD slopes scaled to `tens/thousands/millions/10th millions` for readable magnitudes; color thresholds adapt to your choice.
---
## 4) Data sources & definitions
* **UVOL/VOLD (NYSE)** and **UVOLQ/DVOLQ/VOLDQ (NASDAQ)** via `request.security()`
* **Ratio** = `UVOL/DVOL` (signed; negative when down‑volume dominates)
* **VOLD slope** ≈ `(VOLD_now − VOLD_open) / bars_since_open`, then normalized per your setting
* **TICK/TICKQ**: cumulative sum of prints this session with **positives vs negatives ratio**, plus a simple linear regression **slope** of the last `N` ratio values
* **VIX**: value and slope across a user‑selected timeframe and lookback
* **Sessions (EST/EDT)**
* **Regular:** 09:30–16:00
* **Pre‑Market:** 04:00–09:30
* **After Hours:** 16:00–20:00
* **Extended‑hours extremes** combine **yesterday AH** + **today PM**
> **Note:** All session checks are done with TradingView’s `time(…,"America/New_York")` context. If your broker’s RTH differs (e.g., futures), adjust expectations accordingly.
---
## 5) How the algorithms work (plain English)
### A) Key Levels
* **Yesterday’s RTH High/Low**: scans yesterday’s bars within 09:30–16:00 and records the extremes + bar indices.
* **Extended Hours**: scans yesterday AH and today PM to get **yEHH/yEHL**. Script shows **either yEHH or PMH** (whichever is **higher**) and **either yEHL or PML** (whichever is **lower**) to avoid duplicate bands stacked together.
* **Value Area & POC (RTH only)**
* Build a coarse volume profile with `Max Volume Profile Points` buckets across the price range formed by yesterday’s RTH bars.
* Distribute each bar’s volume uniformly across the buckets it spans (fast approximation to keep Pine within execution limits).
* **POC** = bucket with max volume. **VA** expands from POC outward until **70%** of cumulative volume is enclosed → yields **VAH/VAL**.
### B) Market Breadth Table
* **NYSE/NASDAQ Ratio**: signed UVOL/DVOL with basic coloring.
* **VOLD Slopes**: from session open to current, normalized to human‑readable units; colors flip green/red based on thresholds that map to your normalization setting (e.g., ±2M for NYSE, ±3.5×10M for NASDAQ).
* **TICK/TICKQ Slope**: linear regression over the last `N` ratio points → **↗ / → / ↘** with the rounded slope value.
* **VIX Slope**: % change between now and `n` candles ago (optionally divided by `n`). Red when rising beyond threshold; green when falling.
---
## 6) Recommended presets
* **Stocks (liquid, intraday)**
* Value Area **ON**, `Max Volume Points` = **40–60**, **Timeframe** = **5–15**
* Breadth: show **NYSE & NASDAQ & VIX**, `Slope periods` = **5–8**, `Candles for rate` = **10–20**, **Normalize VIX** = **ON**
* **Index futures / very high‑volume symbols**
* If you see Pine timeouts, set `Max Volume Points` = **20–40** or temporarily **disable Value Area**.
* Keep breadth panel **ON** (it’s light). Consider **VIX timeframe = 15/30** for regime clarity.
---
## 7) Tips, edge cases & performance
* **Performance:** The volume profile is capped (`maxBarsToProcess ≤ 500` and bucketed) to keep it responsive. If you experience slowdowns, reduce `Max Volume Points`, `Maximum bars lookback`, or disable Value Area.
* **Redundant lines:** The script **intentionally suppresses** PMH/PML when yEHH/yEHL are more extreme, and vice‑versa.
* **Label visibility:** Use `Label style = none` if you only want clean lines and read values from the right‑end labels.
* **Futures/RTH differences:** Value Area is from **yesterday’s RTH** only; for 24h instruments the RTH period may not reflect overnight structure.
* **Session transitions:** PMH/PML tracking stops as soon as RTH starts; values persist as static levels for the session.
---
## 8) Known limitations
* Uses public TradingView symbols: `UVOL`, `VOLD`, `UVOLQ`, `DVOLQ`, `VOLDQ`, `TICK`, `TICKQ`, `VIX`. If your data plan or region limits any symbol, the corresponding table rows may show `na`.
* The VA/POC approximation assumes uniform distribution of each bar’s volume across its high–low. That’s fast but not a tick‑level profile.
* Works best on US equities with standard NY session; alternative sessions may need code changes.
---
## 9) Troubleshooting
* **“Script is too slow / timed out”** → Lower `Max Volume Points`, lower `Maximum bars lookback`, or toggle **OFF** `Enable Value Area calculations` for that instrument.
* **Missing breadth values** → Ensure the symbols above load on your account; try reloading chart or switching timeframes once.
* **Overlapping labels** → Set `Label style = none` or reduce label size.
---
## 10) Version / license / contribution
* **Version:** Initial public release (Pine v6).
* **Author:** © yelober
* **License:** Free for community use and enhancement. Please keep author credit.
* **Contributing:** Open PRs/ideas: presets, alert conditions, multi‑day VA composites, optional mid‑value (`(VAH+VAL)/2`), session filter for futures, and alertable state machine for breadth regime transitions.
---
## 11) Quick start (TL;DR)
1. Add the indicator and **keep default settings**.
2. Trade **reactions** at yHoD/yLoD/PMH/PML/VAH/VAL/POC.
3. Use the **breadth table**: look for **green ratios + ↗ slopes** (risk‑on) or **red ratios + ↘ slopes** (risk‑off). Check **VIX** slope for confirmation.
4. Manage risk around levels; when breadth flips against you, tighten or exit.
---
### Changelog (public)
* **v1.0:** First community release with automatic RTH levels, VA/POC approximation, breadth dashboard (NYSE/NASDAQ/TICK/TICKQ/VIX) with normalization and adaptive color thresholds.

Seasonality Monte Carlo Forecaster [BackQuant]Seasonality Monte Carlo Forecaster
Plain-English overview
This tool projects a cone of plausible future prices by combining two ideas that traders already use intuitively: seasonality and uncertainty. It watches how your market typically behaves around this calendar date, turns that seasonal tendency into a small daily “drift,” then runs many randomized price paths forward to estimate where price could land tomorrow, next week, or a month from now. The result is a probability cone with a clear expected path, plus optional overlays that show how past years tended to move from this point on the calendar. It is a planning tool, not a crystal ball: the goal is to quantify ranges and odds so you can size, place stops, set targets, and time entries with more realism.
What Monte Carlo is and why quants rely on it
• Definition . Monte Carlo simulation is a way to answer “what might happen next?” when there is randomness in the system. Instead of producing a single forecast, it generates thousands of alternate futures by repeatedly sampling random shocks and adding them to a model of how prices evolve.
• Why it is used . Markets are noisy. A single point forecast hides risk. Monte Carlo gives a distribution of outcomes so you can reason in probabilities: the median path, the 68% band, the 95% band, tail risks, and the chance of hitting a specific level within a horizon.
• Core strengths in quant finance .
– Path-dependent questions : “What is the probability we touch a stop before a target?” “What is the expected drawdown on the way to my objective?”
– Pricing and risk : Useful for path-dependent options, Value-at-Risk (VaR), expected shortfall (CVaR), stress paths, and scenario analysis when closed-form formulas are unrealistic.
– Planning under uncertainty : Portfolio construction and rebalancing rules can be tested against a cloud of plausible futures rather than a single guess.
• Why it fits trading workflows . It turns gut feel like “seasonality is supportive here” into quantitative ranges: “median path suggests +X% with a 68% band of ±Y%; stop at Z has only ~16% odds of being tagged in N days.”
How this indicator builds its probability cone
1) Seasonal pattern discovery
The script builds two day-of-year maps as new data arrives:
• A return map where each calendar day stores an exponentially smoothed average of that day’s log return (yesterday→today). The smoothing (90% old, 10% new) behaves like an EWMA, letting older seasons matter while adapting to new information.
• A volatility map that tracks the typical absolute return for the same calendar day.
It calculates the day-of-year carefully (with leap-year adjustment) and indexes into a 365-slot seasonal array so “March 18” is compared with past March 18ths. This becomes the seasonal bias that gently nudges simulations up or down on each forecast day.
2) Choice of randomness engine
You can pick how the future shocks are generated:
• Daily mode uses a Gaussian draw with the seasonal bias as the mean and a volatility that comes from realized returns, scaled down to avoid over-fitting. It relies on the Box–Muller transform internally to turn two uniform random numbers into one normal shock.
• Weekly mode uses bootstrap sampling from the seasonal return history (resampling actual historical daily drifts and then blending in a fraction of the seasonal bias). Bootstrapping is robust when the empirical distribution has asymmetry or fatter tails than a normal distribution.
Both modes seed their random draws deterministically per path and day, which makes plots reproducible bar-to-bar and avoids flickering bands.
3) Volatility scaling to current conditions
Markets do not always live in average volatility. The engine computes a simple volatility factor from ATR(20)/price and scales the simulated shocks up or down within sensible bounds (clamped between 0.5× and 2.0×). When the current regime is quiet, the cone narrows; when ranges expand, the cone widens. This prevents the classic mistake of projecting calm markets into a storm or vice versa.
4) Many futures, summarized by percentiles
The model generates a matrix of price paths (capped at 100 runs for performance inside TradingView), each path stepping forward for your selected horizon. For each forecast day it sorts the simulated prices and pulls key percentiles:
• 5th and 95th → approximate 95% band (outer cone).
• 16th and 84th → approximate 68% band (inner cone).
• 50th → the median or “expected path.”
These are drawn as polylines so you can immediately see central tendency and dispersion.
5) A historical overlay (optional)
Turn on the overlay to sketch a dotted path of what a purely seasonal projection would look like for the next ~30 days using only the return map, no randomness. This is not a forecast; it is a visual reminder of the seasonal drift you are biasing toward.
Inputs you control and how to think about them
Monte Carlo Simulation
• Price Series for Calculation . The source series, typically close.
• Enable Probability Forecasts . Master switch for simulation and drawing.
• Simulation Iterations . Requested number of paths to run. Internally capped at 100 to protect performance, which is generally enough to estimate the percentiles for a trading chart. If you need ultra-smooth bands, shorten the horizon.
• Forecast Days Ahead . The length of the cone. Longer horizons dilute seasonal signal and widen uncertainty.
• Probability Bands . Draw all bands, just 95%, just 68%, or a custom level (display logic remains 68/95 internally; the custom number is for labeling and color choice).
• Pattern Resolution . Daily leans on day-of-year effects like “turn-of-month” or holiday patterns. Weekly biases toward day-of-week tendencies and bootstraps from history.
• Volatility Scaling . On by default so the cone respects today’s range context.
Plotting & UI
• Probability Cone . Plots the outer and inner percentile envelopes.
• Expected Path . Plots the median line through the cone.
• Historical Overlay . Dotted seasonal-only projection for context.
• Band Transparency/Colors . Customize primary (outer) and secondary (inner) band colors and the mean path color. Use higher transparency for cleaner charts.
What appears on your chart
• A cone starting at the most recent bar, fanning outward. The outer lines are the ~95% band; the inner lines are the ~68% band.
• A median path (default blue) running through the center of the cone.
• An info panel on the final historical bar that summarizes simulation count, forecast days, number of seasonal patterns learned, the current day-of-year, expected percentage return to the median, and the approximate 95% half-range in percent.
• Optional historical seasonal path drawn as dotted segments for the next 30 bars.
How to use it in trading
1) Position sizing and stop logic
The cone translates “volatility plus seasonality” into distances.
• Put stops outside the inner band if you want only ~16% odds of a stop-out due to noise before your thesis can play.
• Size positions so that a test of the inner band is survivable and a test of the outer band is rare but acceptable.
• If your target sits inside the 68% band at your horizon, the payoff is likely modest; outside the 68% but inside the 95% can justify “one-good-push” trades; beyond the 95% band is a low-probability flyer—consider scaling plans or optionality.
2) Entry timing with seasonal bias
When the median path slopes up from this calendar date and the cone is relatively narrow, a pullback toward the lower inner band can be a high-quality entry with a tight invalidation. If the median slopes down, fade rallies toward the upper band or step aside if it clashes with your system.
3) Target selection
Project your time horizon to N bars ahead, then pick targets around the median or the opposite inner band depending on your style. You can also anchor dynamic take-profits to the moving median as new bars arrive.
4) Scenario planning & “what-ifs”
Before events, glance at the cone: if the 95% band already spans a huge range, trade smaller, expect whips, and avoid placing stops at obvious band edges. If the cone is unusually tight, consider breakout tactics and be ready to add if volatility expands beyond the inner band with follow-through.
5) Options and vol tactics
• When the cone is tight : Prefer long gamma structures (debit spreads) only if you expect a regime shift; otherwise premium selling may dominate.
• When the cone is wide : Debit structures benefit from range; credit spreads need wider wings or smaller size. Align with your separate IV metrics.
Reading the probability cone like a pro
• Cone slope = seasonal drift. Upward slope means the calendar has historically favored positive drift from this date, downward slope the opposite.
• Cone width = regime volatility. A widening fan tells you that uncertainty grows fast; a narrow cone says the market typically stays contained.
• Mean vs. price gap . If spot trades well above the median path and the upper band, mean-reversion risk is high. If spot presses the lower inner band in an up-sloping cone, you are in the “buy fear” zone.
• Touches and pierces . Touching the inner band is common noise; piercing it with momentum signals potential regime change; the outer band should be rare and often brings snap-backs unless there is a structural catalyst.
Methodological notes (what the code actually does)
• Log returns are used for additivity and better statistical behavior: sim_ret is applied via exp(sim_ret) to evolve price.
• Seasonal arrays are updated online with EWMA (90/10) so the model keeps learning as each bar arrives.
• Leap years are handled; indexing still normalizes into a 365-slot map so the seasonal pattern remains stable.
• Gaussian engine (Daily mode) centers shocks on the seasonal bias with a conservative standard deviation.
• Bootstrap engine (Weekly mode) resamples from observed seasonal returns and adds a fraction of the bias, which captures skew and fat tails better.
• Volatility adjustment multiplies each daily shock by a factor derived from ATR(20)/price, clamped between 0.5 and 2.0 to avoid extreme cones.
• Performance guardrails : simulations are capped at 100 paths; the probability cone uses polylines (no heavy fills) and only draws on the last confirmed bar to keep charts responsive.
• Prerequisite data : at least ~30 seasonal entries are required before the model will draw a cone; otherwise it waits for more history.
Strengths and limitations
• Strengths :
– Probabilistic thinking replaces single-point guessing.
– Seasonality adds a small but meaningful directional bias that many markets exhibit.
– Volatility scaling adapts to the current regime so the cone stays realistic.
• Limitations :
– Seasonality can break around structural changes, policy shifts, or one-off events.
– The number of paths is performance-limited; percentile estimates are good for trading, not for academic precision.
– The model assumes tomorrow’s randomness resembles recent randomness; if regime shifts violently, the cone will lag until the EWMA adapts.
– Holidays and missing sessions can thin the seasonal sample for some assets; be cautious with very short histories.
Tuning guide
• Horizon : 10–20 bars for tactical trades; 30+ for swing planning when you care more about broad ranges than precise targets.
• Iterations : The default 100 is enough for stable 5/16/50/84/95 percentiles. If you crave smoother lines, shorten the horizon or run on higher timeframes.
• Daily vs. Weekly : Daily for equities and crypto where month-end and turn-of-month effects matter; Weekly for futures and FX where day-of-week behavior is strong.
• Volatility scaling : Keep it on. Turn off only when you intentionally want a “pure seasonality” cone unaffected by current turbulence.
Workflow examples
• Swing continuation : Cone slopes up, price pulls into the lower inner band, your system fires. Enter near the band, stop just outside the outer line for the next 3–5 bars, target near the median or the opposite inner band.
• Fade extremes : Cone is flat or down, price gaps to the upper outer band on news, then stalls. Favor mean-reversion toward the median, size small if volatility scaling is elevated.
• Event play : Before CPI or earnings on a proxy index, check cone width. If the inner band is already wide, cut size or prefer options structures that benefit from range.
Good habits
• Pair the cone with your entry engine (breakout, pullback, order flow). Let Monte Carlo do range math; let your system do signal quality.
• Do not anchor blindly to the median; recalc after each bar. When the cone’s slope flips or width jumps, the plan should adapt.
• Validate seasonality for your symbol and timeframe; not every market has strong calendar effects.
Summary
The Seasonality Monte Carlo Forecaster wraps institutional risk planning into a single overlay: a data-driven seasonal drift, realistic volatility scaling, and a probabilistic cone that answers “where could we be, with what odds?” within your trading horizon. Use it to place stops where randomness is less likely to take you out, to set targets aligned with realistic travel, and to size positions with confidence born from distributions rather than hunches. It will not predict the future, but it will keep your decisions anchored to probabilities—the language markets actually speak.

Advanced Currency Strength Meter# Advanced Currency Strength Meter (ACSM)
The Advanced Currency Strength Meter (ACSM) is a scientifically-based indicator that measures relative currency strength using established academic methodologies from international finance and behavioral economics. This indicator provides traders with a comprehensive view of currency market dynamics through multiple analytical frameworks.
### Theoretical Foundation
#### 1. Purchasing Power Parity (PPP) Theory
Based on Cassel's (1918) seminal work and refined by Froot & Rogoff (1995), PPP suggests that exchange rates should reflect relative price levels between countries. The ACSM momentum component captures deviations from long-term equilibrium relationships, providing insights into currency misalignments.
#### 2. Uncovered Interest Rate Parity (UIP) and Carry Trade Theory
Building on Fama (1984) and Lustig et al. (2007), the indicator incorporates volatility-adjusted momentum to capture carry trade flows and interest rate differentials that drive currency strength. This approach helps identify currencies benefiting from interest rate differentials.
#### 3. Behavioral Finance and Currency Momentum
Following Burnside et al. (2011) and Menkhoff et al. (2012), the model recognizes that currency markets exhibit persistent momentum effects due to behavioral biases and institutional flows. The indicator captures these momentum patterns for trading opportunities.
#### 4. Portfolio Balance Theory
Based on Branson & Henderson (1985), the relative strength matrix captures how portfolio rebalancing affects currency cross-rates and creates trading opportunities between different currency pairs.
### Technical Implementation
#### Core Methodologies:
- **Z-Score Normalization**: Following Sharpe (1994), provides statistical significance testing without arbitrary scaling
- **Momentum Analysis**: Uses return-based metrics (Jegadeesh & Titman, 1993) for trend identification
- **Volatility Adjustment**: Implements Average True Range methodology (Wilder, 1978) for risk-adjusted strength
- **Composite Scoring**: Equal-weight methodology to avoid overfitting and maintain robustness
- **Correlation Analysis**: Risk management framework based on Markowitz (1952) portfolio theory
#### Key Features:
- **Multi-Source Data Integration**: Supports OANDA, Futures, and CFD data sources
- **Scientific Methodology**: No arbitrary scaling or curve-fitting; all calculations based on established statistical methods
- **Comprehensive Dashboard**: Clean, professional table showing currency strengths and best trading pairs
- **Alert System**: Automated notifications for strong/weak currency conditions and extreme values
- **Best Pair Identification**: Algorithmic detection of highest-potential trading opportunities
### Practical Applications
#### For Swing Traders:
- Identify currencies in strong uptrends or downtrends
- Select optimal currency pairs based on relative strength divergence
- Time entries based on momentum convergence/divergence
#### For Day Traders:
- Use with real-time futures data for intraday opportunities
- Monitor currency correlations for risk management
- Detect early reversal signals through extreme value alerts
#### For Portfolio Managers:
- Multi-currency exposure analysis
- Risk management through correlation monitoring
- Strategic currency allocation decisions
### Visual Design
The indicator features a clean, professional dashboard that displays:
- **Currency Strength Values**: Each major currency (EUR, GBP, JPY, CHF, AUD, CAD, NZD, USD) with color-coded strength values
- **Best Trading Pairs**: Filtered list of highest-potential currency pairs with BUY/SELL signals
- **Market Analysis**: Real-time identification of strongest and weakest currencies
- **Potential Score**: Quantitative measure of trading opportunity strength
### Data Sources and Latency
The indicator supports multiple data sources to accommodate different trading needs:
- **OANDA (Delayed)**: Free data with 15-20 minute delay, suitable for swing trading
- **Futures (Real-time)**: CME currency futures for real-time analysis
- **CFDs**: Alternative real-time data source option
### Mathematical Framework
#### Strength Calculation:
Momentum = (Price - Price ) / Price * 100
Z-Score = (Price - Mean) / Standard Deviation
Volatility-Adjusted = Momentum / ATR-based Volatility
Composite = 0.5 * Momentum + 0.3 * Z-Score + 0.2 * Volatility-Adjusted
#### USD Strength Derivation:
USD strength is calculated as the weighted average of all USD-based pairs, providing a true baseline for relative strength comparison.
### Performance Considerations
The indicator is optimized for:
- **Computational Efficiency**: Uses Pine Script v6 best practices
- **Memory Management**: Appropriate lookback periods and array handling
- **Visual Clarity**: Clean table design optimized for both light and dark themes
- **Alert Reliability**: Robust signal generation with statistical significance testing
### Limitations and Risk Disclosure
- Model performance may vary during extreme market stress (Black Swan events)
- Requires stable data feeds for accurate calculations
- Not optimized for high-frequency scalping strategies
- Central bank interventions may temporarily distort signals
- Performance assumes normal market conditions with behavioral adjustments
### Academic References
- Branson, W. H., & Henderson, D. W. (1985). "The Specification and Influence of Asset Markets"
- Burnside, C., Eichenbaum, M., & Rebelo, S. (2011). "Carry Trade and Momentum in Currency Markets"
- Cassel, G. (1918). "Abnormal Deviations in International Exchanges"
- Fama, E. F. (1984). "Forward and Spot Exchange Rates"
- Froot, K. A., & Rogoff, K. (1995). "Perspectives on PPP and Long-Run Real Exchange Rates"
- Jegadeesh, N., & Titman, S. (1993). "Returns to Buying Winners and Selling Losers"
- Lustig, H., Roussanov, N., & Verdelhan, A. (2007). "Common Risk Factors in Currency Markets"
- Markowitz, H. (1952). "Portfolio Selection"
- Menkhoff, L., Sarno, L., Schmeling, M., & Schrimpf, A. (2012). "Carry Trades and Global FX Volatility"
- Sharpe, W. F. (1994). "The Sharpe Ratio"
- Wilder, J. W. (1978). "New Concepts in Technical Trading Systems"
### Usage Instructions
1. **Setup**: Add the indicator to your chart and select your preferred data source
2. **Currency Selection**: Choose which currencies to analyze (default: all major currencies)
3. **Methodology**: Select calculation method (Composite recommended for most users)
4. **Monitoring**: Watch the dashboard for strength changes and best pair opportunities
5. **Alerts**: Set up notifications for strong/weak currency conditions

OI Bahavior MapThis indicator visualizes Open Interest (OI) changes for Binance Futures and highlights the behavior of market participants — whether takers or makers are opening or closing positions.
📊 Supported display modes:
• Taker or Maker
• Longs or Shorts
• Cumulative or Per-Bar
• Displayed in USD or Coins
💡 Each candle color reflects the dominant trade direction (delta):
🟢 Green = Aggressive buying (Delta Buy)
🔴 Red = Aggressive selling (Delta Sell)
OI direction (↑/↓) determines whether positions are being opened or closed.
🛠️ Optional metrics:
• Moving average of OI (SMA, EMA, WMA, VWMA, LSMA)
• Volatility channels (Bollinger Bands or Extremums)
⚙️ How it works:
• Fetches OI data from the SYMBOL_OI ticker (e.g., BTCUSDT_OI)
• Compares current OI with the previous bar
• Uses signed volume delta (close - open) to infer intent
• Classifies bar as open/close, long/short, taker/maker
• Displays the net effect as a colored candle on a secondary chart
🤔 How to interpret Taker and Maker?
• Taker: The aggressive participant who removes liquidity (initiates the trade)
• Maker: The passive participant who provides liquidity (places resting orders)
You can choose to display the same event from either the Taker or Maker perspective — the chart will look the same, but the interpretation changes.
🧠 Core Logic Mapping
```
🟢 Green: Taker Longs (Buy, OI↑) | Maker Shorts (Buy, OI↓)
🔴 Red: Taker Shorts (Sell, OI↑) | Maker Longs (Sell, OI↓)
```
⚠️ Limitations:
• Works only for Binance Futures
• Requires existence of SYMBOL_OI ticker on TradingView
• Represents approximate intent based on OI + volume behavior
💬 Open Source
The script is open for the community. Suggestions and feedback are welcome in the comments!
__________________________________________________________________________________
Этот индикатор визуализирует изменения открытого интереса (OI) для Binance Futures и показывает поведение участников рынка — открывают или закрывают позиции тейкеры или мейкеры.
📊 Доступные режимы отображения:
• Taker или Maker
• Longs или Shorts
• Кумулятивный или по бару
• В USD или в монетах
💡 Каждый цвет свечи отражает преобладающее направление сделок (дельта):
🟢 Зеленый = Агрессивные покупки (Delta Buy)
🔴 Красный = Агрессивные продажи (Delta Sell)
Направление OI (↑/↓) показывает, открываются или закрываются позиции.
🛠️ Дополнительные метрики:
• Скользящая средняя OI (SMA, EMA, WMA, VWMA, LSMA)
• Волатильностные каналы (Bollinger Bands или экстремумы)
⚙️ Как работает:
• Получает данные OI из тикера SYMBOL_OI (например, BTCUSDT_OI)
• Сравнивает текущий OI с предыдущим баром
• Использует направленную дельту объема (close - open) для определения намерения
• Классифицирует бар как открытие/закрытие, лонг/шорт, тейкер/мейкер
• Отображает итог в виде цветной свечи на дополнительном графике
🤔 Как интерпретировать Taker и Maker?
• Taker: Агрессивный участник, который изымает ликвидность (инициирует сделку)
• Maker: Пассивный участник, который создает ликвидность (выставляет лимитные заявки)
Вы можете выбрать отображение события с позиции тейкера или мейкера — график будет одинаковым, но смысл меняется.
🧠 Схема логики
```
🟢 Зеленый: Taker Longs (Покупка, OI↑) | Maker Shorts (Покупка, OI↓)
🔴 Красный: Taker Shorts (Продажа, OI↑) | Maker Longs (Продажа, OI↓)
```
⚠️ Ограничения:
• Работает только для Binance Futures
• Требуется наличие тикера SYMBOL_OI на TradingView
• Показывает приблизительное намерение на основе OI и дельты объема
💬 Open Source
Скрипт открыт для сообщества. Предложения и обратная связь приветствуются в комментариях!

PumpC Opening Range Breakout (ORB) 5min Range📄 PumpC ORB 5-Minute Opening Range Breakout Indicator
✨ Overview
The PumpC ORB 5-Minute Opening Range Breakout indicator captures early session price action by tracking the high, low, and open of a defined 5-minute window at market open (customized for Futures or Stocks).
It plots breakout levels, extension targets, average range calculations, volume tracking, and provides visual and table-based data summaries.
This indicator is designed for traders seeking a complete, clean visualization of Opening Range Breakouts (ORB) with flexible customization.
⚙️ Main Features
Opening Range Box (ORB Box) Draws a box around the high and low of the first 5-minute session (8:30–8:35 ET for Futures, 9:30–9:35 ET for Stocks). Box extends from the session open to the session close (4:00 PM ET). Option to enable/disable historical boxes. Box color and opacity are customizable. Core ORB Levels Open Level: Plots the open price of the 5-minute ORB window. ORB Levels: Plots breakout levels at multiples: +0.5x the range +1.5x the range (customizable factor) Each level has independent color settings and visibility toggles. Option to show or hide historic extension levels. Table Display Compact table in the top-right corner showing: ORB ATR (average range) ORB ATR in ticks Today's ORB range ORB Volume ATR (average volume during ORB) Today's ORB Volume Volume is formatted automatically into "K" (thousands) or "M" (millions) for readability. Background Highlights After the ORB window closes: Blue highlight if today's ORB range is greater than the 10-day ATR average. Orange highlight if today's ORB range is smaller than the 10-day ATR average. Helps quickly assess relative strength or weakness compared to historical behavior. Alerts Breakout Confirmations: Fires when price closes above ORB High or below ORB Low. Fallout Traps: Alerts when price wick crosses ORB High/Low but closes back inside the range. Alerts use clean titles and simple messages for easy identification.
🔧 Inputs and Customization
Mode Toggle: Choose between Futures (8:30 ET open) or Stocks (9:30 ET open). Show/Hide Labels: Control label visibility for ORB and extension levels. Line Width Control: Customize thickness for ORB lines and extension levels. ORB Level Level Visibility: Independently enable or disable each extension line. Table Appearance: Customize table background color, font color, and padding. ORB Box Settings: Customize box color and control whether historical boxes are drawn.
📚 How to Use
Select Mode: Choose Futures or Stocks depending on your instrument. Observe the Opening Range: Focus on the ORB High and ORB Low during the first 5 minutes after the open. Monitor Breakouts: Breakout alerts will fire when price closes outside the ORB range, signaling potential continuation. Watch for Fallout Traps: Fallout alerts signal when price briefly wicks above/below but closes back inside the ORB range. Use Table Metrics: Instantly compare today's ORB range and volume versus historical averages to assess session strength or weakness.
🛡️ Notes
Best used on the 1-minute or 5-minute chart for intraday trading. Ensure your TradingView chart time zone is set to New York for correct functioning. Alerts must be manually configured after adding the indicator to your chart.
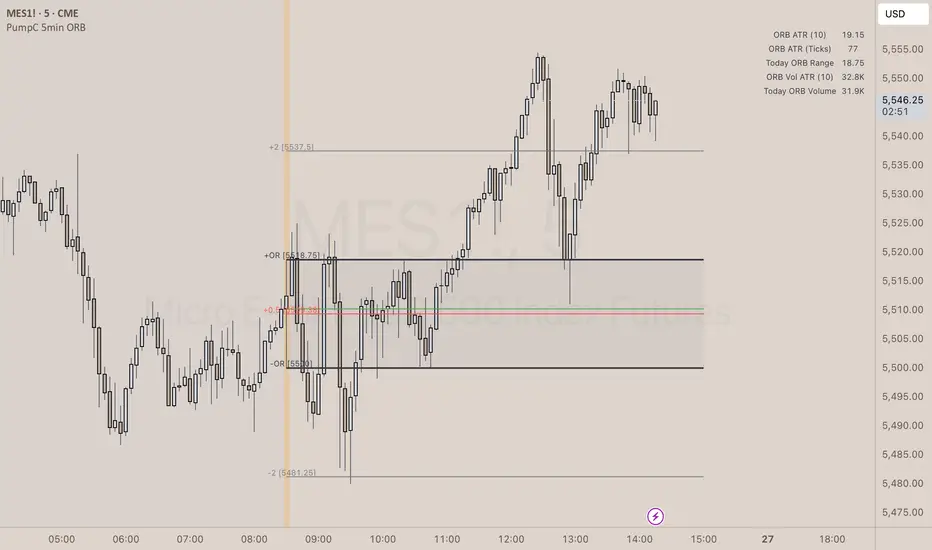
TASC 2025.05 Trading The Channel█ OVERVIEW
This script implements channel-based trading strategies based on the concepts explained by Perry J. Kaufman in the article "A Test Of Three Approaches: Trading The Channel" from the May 2025 edition of TASC's Traders' Tips . The script explores three distinct trading methods for equities and futures using information from a linear regression channel. Each rule set corresponds to different market behaviors, offering flexibility for trend-following, breakout, and mean-reversion trading styles.
█ CONCEPTS
Linear regression
Linear regression is a model that estimates the relationship between a dependent variable and one or more independent variables by fitting a straight line to the observed data. In the context of financial time series, traders often use linear regression to estimate trends in price movements over time.
The slope of the linear regression line indicates the strength and direction of the price trend. For example, a larger positive slope indicates a stronger upward trend, and a larger negative slope indicates the opposite. Traders can look for shifts in the direction of a linear regression slope to identify potential trend trading signals, and they can analyze the magnitude of the slope to support trading decisions.
One caveat to linear regression is that most financial time series data does not follow a straight line, meaning a regression line cannot perfectly describe the relationships between values. Prices typically fluctuate around a regression line to some degree. As such, analysts often project ranges above and below regression lines, creating channels to model the expected extent of the data's variability. This strategy constructs a channel based on the method used in Kaufman's article. It measures the maximum distances from points on the linear regression line to historical price values, then adds those distances and the current slope to the regression points.
Depending on the trading style, traders might look for prices to move outside an established channel for breakout signals, or they might look for price action to reach extremes within the channel for potential mean reversion opportunities.
█ STRATEGY CALCULATIONS
Primary trade rules
This strategy implements three distinct sets of rules for trend, breakout, and mean-reversion trades based on the methods Kaufman describes in his article:
Trade the trend (Rule 1) : Open new positions when the sign of the slope changes, indicating a potential trend reversal. Close short trades and enter a long trade when the slope changes from negative to positive, and do the opposite when the slope changes from positive to negative.
Trade channel breakouts (Rule 2) : Open new positions when prices cross outside the linear regression channel for the current sample. Close short trades and enter a long trade when the price moves above the channel, and do the opposite when the price moves below the channel.
Trade within the channel (Rule 3) : Open new positions based on price values within the channel's range. Close short trades and enter a long trade when the price is near the channel's low, within a specified percentage of the channel's range, and do the opposite when the price is near the channel's high. With this rule, users can also filter the trades based on the channel's slope. When the filter is active, long positions are allowed only when the slope is positive, and short positions are allowed only when it is negative.
Position sizing
Kaufman's strategy uses specific trade sizes for equities and futures markets:
For an equities symbol, the number of shares traded is $10,000 divided by the current price.
For a futures symbol, the number of contracts traded is based on a volatility-adjusted formula that divides $25,000 by the product of the 20-bar average true range and the instrument's point value.
By default, this script automatically uses these sizes for its trade simulation on equities and futures symbols and does not simulate trading on other symbols. However, users can control position sizes from the "Settings/Properties" tab and enable trade simulation on other symbol types by selecting the "Manual" option in the script's "Position sizing" input.
Stop-loss
This strategy includes the option to place an accompanying stop-loss order for each trade, which users can enable from the "SL %" input in the "Settings/Inputs" tab. When enabled, the strategy places a stop-loss order at a specified percentage distance from the closing price where the entry order occurs, allowing users to compare how the strategy performs with added loss protection.
█ USAGE
This strategy adapts its display logic for the three trading approaches based on the rule selected in the "Trade rule" input:
For all rules, the script plots the linear regression slope in a separate pane. The plot is color-coded to indicate whether the current slope is positive or negative.
When the selected rule is "Trade the trend", the script plots triangles in the separate pane to indicate when the slope's direction changes from positive to negative or vice versa. Additionally, it plots a color-coded SMA on the main chart pane, allowing visual comparison of the slope to directional changes in a moving average.
When the rule is "Trade channel breakouts" or "Trade within the channel", the script draws the current period's linear regression channel on the main chart pane, and it plots bands representing the history of the channel values from the specified start time onward.
When the rule is "Trade within the channel", the script plots overbought and oversold zones between the bands based on a user-specified percentage of the channel range to indicate the value ranges where new trades are allowed.
Users can customize the strategy's calculations with the following additional inputs in the "Settings/Inputs" tab:
Start date : Sets the date and time when the strategy begins simulating trades. The script marks the specified point on the chart with a gray vertical line. The plots for rules 2 and 3 display the bands and trading zones from this point onward.
Period : Specifies the number of bars in the linear regression channel calculation. The default is 40.
Linreg source : Specifies the source series from which to calculate the linear regression values. The default is "close".
Range source : Specifies whether the script uses the distances from the linear regression line to closing prices or high and low prices to determine the channel's upper and lower ranges for rules 2 and 3. The default is "close".
Zone % : The percentage of the channel's overall range to use for trading zones with rule 3. The default is 20, meaning the width of the upper and lower zones is 20% of the range.
SL% : If the checkbox is selected, the strategy adds a stop-loss to each trade at the specified percentage distance away from the closing price where the entry order occurs. The checkbox is deselected by default, and the default percentage value is 5.
Position sizing : Determines whether the strategy uses Kaufman's predefined trade sizes ("Auto") or allows user-defined sizes from the "Settings/Properties" tab ("Manual"). The default is "Auto".
Long trades only : If selected, the strategy does not allow short positions. It is deselected by default.
Trend filter : If selected, the strategy filters positions for rule 3 based on the linear regression slope, allowing long positions only when the slope is positive and short positions only when the slope is negative. It is deselected by default.
NOTE: Because of this strategy's trading rules, the simulated results for a specific symbol or channel configuration might have significantly fewer than 100 trades. For meaningful results, we recommend adjusting the start date and other parameters to achieve a reasonable number of closed trades for analysis.
Additionally, this strategy does not specify commission and slippage amounts by default, because these values can vary across market types. Therefore, we recommend setting realistic values for these properties in the "Cost simulation" section of the "Settings/Properties" tab.

Dskyz (DAFE) MAtrix with ATR-Powered Precision Dskyz (DAFE) MAtrix with ATR-Powered Precision
This cutting‐edge futures trading strategy built to thrive in rapidly changing market conditions. Developed for high-frequency futures trading on instruments such as the CME Mini MNQ, this strategy leverages a matrix of sophisticated moving averages combined with ATR-based filters to pinpoint high-probability entries and exits. Its unique combination of adaptable technical indicators and multi-timeframe trend filtering sets it apart from standard strategies, providing enhanced precision and dynamic responsiveness.
imgur.com
Core Functional Components
1. Advanced Moving Averages
A distinguishing feature of the DAFE strategy is its robust, multi-choice moving averages (MAs). Clients can choose from a wide array of MAs—each with specific strengths—in order to fine-tune their trading signals. The code includes user-defined functions for the following MAs:
imgur.com
Hull Moving Average (HMA):
The hma(src, len) function calculates the HMA by using weighted moving averages (WMAs) to reduce lag considerably while smoothing price data. This function computes an intermediate WMA of half the specified length, then a full-length WMA, and finally applies a further WMA over the square root of the length. This design allows for rapid adaptation to price changes without the typical delays of traditional moving averages.
Triple Exponential Moving Average (TEMA):
Implemented via tema(src, len), TEMA uses three consecutive exponential moving averages (EMAs) to effectively cancel out lag and capture price momentum. The final formula—3 * (ema1 - ema2) + ema3—produces a highly responsive indicator that filters out short-term noise.
Double Exponential Moving Average (DEMA):
Through the dema(src, len) function, DEMA calculates an EMA and then a second EMA on top of it. Its simplified formula of 2 * ema1 - ema2 provides a smoother curve than a single EMA while maintaining enhanced responsiveness.
Volume Weighted Moving Average (VWMA):
With vwma(src, len), this MA accounts for trading volume by weighting the price, thereby offering a more contextual picture of market activity. This is crucial when volume spikes indicate significant moves.
Zero Lag EMA (ZLEMA):
The zlema(src, len) function applies a correction to reduce the inherent lag found in EMAs. By subtracting a calculated lag (based on half the moving average window), ZLEMA is exceptionally attuned to recent price movements.
Arnaud Legoux Moving Average (ALMA):
The alma(src, len, offset, sigma) function introduces ALMA—a type of moving average designed to be less affected by outliers. With parameters for offset and sigma, it allows customization of the degree to which the MA reacts to market noise.
Kaufman Adaptive Moving Average (KAMA):
The custom kama(src, len) function is noteworthy for its adaptive nature. It computes an efficiency ratio by comparing price change against volatility, then dynamically adjusts its smoothing constant. This results in an MA that quickly responds during trending periods while remaining smoothed during consolidation.
Each of these functions—integrated into the strategy—is selectable by the trader (via the fastMAType and slowMAType inputs). This flexibility permits the tailored application of the MA most suited to current market dynamics and individual risk management preferences.
2. ATR-Based Filters and Risk Controls
ATR Calculation and Volatility Filter:
The strategy computes the Average True Range (ATR) over a user-defined period (atrPeriod). ATR is then used to derive both:
Volatility Assessment: Expressed as a ratio of ATR to closing price, ensuring that trades are taken only when volatility remains within a safe, predefined threshold (volatilityThreshold).
ATR-Based Entry Filters: Implemented as atrFilterLong and atrFilterShort, these conditions ensure that for long entries the price is sufficiently above the slow MA and vice versa for shorts. This acts as an additional confirmation filter.
Dynamic Exit Management:
The exit logic employs a dual approach:
Fixed Stop and Profit Target: Stops and targets are set at multiples of ATR (fixedStopMultiplier and profitTargetATRMult), helping manage risk in volatile markets.
Trailing Stop Adjustments: A trailing stop is calculated using the ATR multiplied by a user-defined offset (trailOffset), which captures additional profits as the trade moves favorably while protecting against reversals.
3. Multi-Timeframe Trend Filtering
The strategy enhances its signal reliability by leveraging a secondary, higher timeframe analysis:
15-Minute Trend Analysis:
By retrieving 15-minute moving averages (fastMA15m and slowMA15m) via request.security, the strategy determines the broader market trend. This secondary filter (enabled or disabled through useTrendFilter) ensures that entries are aligned with the prevailing market direction, thereby reducing the incidence of false signals.
4. Signal and Execution Logic
Combined MA Alignment:
The entry conditions are based primarily on the alignment of the fast and slow MAs. A long condition is triggered when the current price is above both MAs and the fast MA is above the slow MA—complemented by the ATR filter and volume conditions. The reverse applies for a short condition.
Volume and Time Window Validation:
Trades are permitted only if the current volume exceeds a minimum (minVolume) and the current hour falls within the predefined trading window (tradingStartHour to tradingEndHour). An additional volume spike check (comparing current volume to a moving average of past volumes) further filters for optimal market conditions.
Comprehensive Order Execution:
The strategy utilizes flexible order execution functions that allow pyramiding (up to 10 positions), ensuring that it can scale into positions as favorable conditions persist. The use of both market entries and automated exits (with profit targets, stop-losses, and trailing stops) ensures that risk is managed at every step.
5. Integrated Dashboard and Metrics
For transparency and real-time analysis, the strategy includes:
On-Chart Visualizations:
Both fast and slow MAs are plotted on the chart, making it easy to see the market’s technical foundation.
Dynamic Metrics Dashboard:
A built-in table displays crucial performance statistics—including current profit/loss, equity, ATR (both raw and as a percentage), and the percentage gap between the moving averages. These metrics offer immediate insight into the health and performance of the strategy.
Input Parameters: Detailed Breakdown
Every input is meticulously designed to offer granular control:
Fast & Slow Lengths:
Determine the window size for the fast and slow moving averages. Smaller values yield more sensitivity, while larger values provide a smoother, delayed response.
Fast/Slow MA Types:
Choose the type of moving average for fast and slow signals. The versatility—from basic SMA and EMA to more complex ones like HMA, TEMA, ZLEMA, ALMA, and KAMA—allows customization to fit different market scenarios.
ATR Parameters:
atrPeriod and atrMultiplier shape the volatility assessment, directly affecting entry filters and risk management through stop-loss and profit target levels.
Trend and Volume Filters:
Inputs such as useTrendFilter, minVolume, and the volume spike condition help confirm that a trade occurs in active, trending markets rather than during periods of low liquidity or market noise.
Trading Hours:
Restricting trade execution to specific hours (tradingStartHour and tradingEndHour) helps avoid illiquid or choppy markets outside of prime trading sessions.
Exit Strategies:
Parameters like trailOffset, profitTargetATRMult, and fixedStopMultiplier provide multiple layers of risk management and profit protection by tailoring how exits are generated relative to current market conditions.
Pyramiding and Fixed Trade Quantity:
The strategy supports multiple entries within a trend (up to 10 positions) and sets a predefined trade quantity (fixedQuantity) to maintain consistent exposure and risk per trade.
Dashboard Controls:
The resetDashboard input allows for on-the-fly resetting of performance metrics, keeping the strategy’s performance dashboard accurate and up-to-date.
Why This Strategy is Truly Exceptional
Multi-Faceted Adaptability:
The ability to switch seamlessly between various moving average types—each suited to particular market conditions—enables the strategy to adapt dynamically. This is a testament to the high level of coding sophistication and market insight infused within the system.
Robust Risk Management:
The integration of ATR-based stops, profit targets, and trailing stops ensures that every trade is executed with well-defined risk parameters. The system is designed to mitigate unexpected market swings while optimizing profit capture.
Comprehensive Market Filtering:
By combining moving average crossovers with volume analysis, volatility thresholds, and multi-timeframe trend filters, the strategy only enters trades under the most favorable conditions. This multi-layered filtering reduces noise and enhances signal quality.
-Final Thoughts-
The Dskyz Adaptive Futures Elite (DAFE) MAtrix with ATR-Powered Precision strategy is not just another trading algorithm—it is a multi-dimensional, fully customizable system built on advanced technical principles and sophisticated risk management techniques. Every function and input parameter has been carefully engineered to provide traders with a system that is both powerful and transparent.
For clients seeking a state-of-the-art trading solution that adapts dynamically to market conditions while maintaining strict discipline in risk management, this strategy truly stands in a class of its own.
****Please show support if you enjoyed this strategy. I'll have more coming out in the near future!!
-Dskyz
Caution
DAFE is experimental, not a profit guarantee. Futures trading risks significant losses due to leverage. Backtest, simulate, and monitor actively before live use. All trading decisions are your responsibility.

EMA SHIFT & PARALLEL [n_dot]BINANCE:ETHUSDT.P
This strategy was developed for CRYPTO FUTURES, (the settings for ETHUSDT.P) . I aimed for the strategy to function in a live environment, so I focused on making its operation realistic:
When determining the position, only 80% (adjustable) of the available cash is invested to reduce the risk of position liquidation.
I account for a 0.05% commission, typical on the futures market, for each entry and exit.
Concept:
I modified a simple, well-known method: the crossover of two exponential moving averages (FAST, SLOW) generates the entry and exit signals.
I enhanced the base idea as follows:
For the fast EMA, I incorporated a multiplier (offset) to filter out market noise and focus only on strong signals.
I use different EMAs for long and short entry points; both have their own FAST and SLOW EMAs and their own offset. For longs, the FAST EMA is adjusted downward (<1), while for shorts, it is adjusted upward (>1). Consequently, the signal is generated when the modified FAST EMA crosses the SLOW EMA.
Risk Management:
The position includes the following components:
Separate stop-losses for long and short positions.
Separate trailers for long and short positions.
The strategy operates so that the entry point is determined by the EMA crossover, while the exit is governed only by the Stop Loss or Trailer. Optionally, it can be set to close the position at the EMA recrossing ("Close at Signal").
Trailer Operation:
An entry percentage and offset are defined. The trailer activates when the price surpasses the entry price, calculated automatically by the system.
The trailer closes the position when the price drops by the offset percentage from the highest reached price.
Example for trailer:
Purchase Price = 100
Trailer Enter = 5% → Activation Price = 105 (triggers trailer if market price crosses it).
Trailer Offset = 2%
If the price rises to 110, the exit price becomes 107.8.
If the price goes to 120, the exit price becomes 117.6.
If the price falls below 117.6, the trailer closes the position.
Settings:
Source: Determines the market price reference.
End Close: Closes positions at the end of the simulation to avoid "shadow positions" and provide an objective result.
Lot proportional to free cash (%): Only a portion of free cash is invested to meet margin requirements.
Plot Short, Plot Long: Simplifies displayed information by toggling indicator lines on/off.
Long Position (toggleable):
EMA Fast ws: Window size for FAST EMA.
EMA Slow ws: Window size for SLOW EMA.
EMA Fast down shift: Adjustment factor for FAST EMA.
Stop Loss long (%): Percent drop to close the position.
Trailer enter (%): Percent above the purchase price to activate the trailer.
Trailer offset (%): Percent drop to close the position.
Short Position (toggleable):
EMA Fast ws: Window size for FAST EMA.
EMA Slow ws: Window size for SLOW EMA.
EMA Fast up shift: Adjustment factor for FAST EMA.
Stop Loss short (%): Percent rise to close the position.
Trailer enter (%): Percent below the purchase price to activate the trailer.
Trailer offset (%): Percent rise to close the position.
Operational Framework:
If in a long position and a short EMA crossover occurs, the strategy closes the long and opens a short (flip).
If in a short position and a long EMA crossover occurs, the strategy closes the short and opens a long (flip).
A position can close in three ways:
Stop Loss
Trailer
Signal Recrossing
If none are active, the position remains open until the end of the simulation.
Observations:
Shifts significantly deviating from 1 increase overfitting risk. Recommended ranges: 0.96–0.99 (long) and 1.01–1.05 (short).
The strategy's advantage lies in risk management, crucial in leveraged futures markets. It operates with relatively low DrawDown.
Recommendations:
Bullish Market: Higher entry threshold (e.g., 6%) and larger offset (e.g., 3%).
Volatile/Sideways Market: Tighter parameters (e.g., 3%, 1%).
The method is stable, and minor parameter adjustments do not significantly impact results, helping assess overfitting: if small changes lead to drastic differences, the strategy is over-optimized.
EMA Settings: Adjust FAST and SLOW EMAs based on the asset's volatility and cyclicality.
On the crypto market, especially in the Futures market, short time periods (1–15 minutes) often show significant noise, making patterns/repetitions hard to identify. I recommend setting the interval to at least 1 hour.
I hope this contributes to your success!

Multiple Naked LevelsPURPOSE OF THE INDICATOR
This indicator autogenerates and displays naked levels and gaps of multiple types collected into one simple and easy to use indicator.
VALUE PROPOSITION OF THE INDICATOR AND HOW IT IS ORIGINAL AND USEFUL
1) CONVENIENCE : The purpose of this indicator is to offer traders with one coherent and robust indicator providing useful, valuable, and often used levels - in one place.
2) CLUSTERS OF CONFLUENCES : With this indicator it is easy to identify levels and zones on the chart with multiple confluences increasing the likelihood of a potential reversal zone.
THE TYPES OF LEVELS AND GAPS INCLUDED IN THE INDICATOR
The types of levels include the following:
1) PIVOT levels (Daily/Weekly/Monthly) depicted in the chart as: dnPIV, wnPIV, mnPIV.
2) POC (Point of Control) levels (Daily/Weekly/Monthly) depicted in the chart as: dnPoC, wnPoC, mnPoC.
3) VAH/VAL STD 1 levels (Value Area High/Low with 1 std) (Daily/Weekly/Monthly) depicted in the chart as: dnVAH1/dnVAL1, wnVAH1/wnVAL1, mnVAH1/mnVAL1
4) VAH/VAL STD 2 levels (Value Area High/Low with 2 std) (Daily/Weekly/Monthly) depicted in the chart as: dnVAH2/dnVAL2, wnVAH2/wnVAL2, mnVAH1/mnVAL2
5) FAIR VALUE GAPS (Daily/Weekly/Monthly) depicted in the chart as: dnFVG, wnFVG, mnFVG.
6) CME GAPS (Daily) depicted in the chart as: dnCME.
7) EQUILIBRIUM levels (Daily/Weekly/Monthly) depicted in the chart as dnEQ, wnEQ, mnEQ.
HOW-TO ACTIVATE LEVEL TYPES AND TIMEFRAMES AND HOW-TO USE THE INDICATOR
You can simply choose which of the levels to be activated and displayed by clicking on the desired radio button in the settings menu.
You can locate the settings menu by clicking into the Object Tree window, left-click on the Multiple Naked Levels and select Settings.
You will then get a menu of different level types and timeframes. Click the checkboxes for the level types and timeframes that you want to display on the chart.
You can then go into the chart and check out which naked levels that have appeared. You can then use those levels as part of your technical analysis.
The levels displayed on the chart can serve as additional confluences or as part of your overall technical analysis and indicators.
In order to back-test the impact of the different naked levels you can also enable tapped levels to be depicted on the chart. Do this by toggling the 'Show tapped levels' checkbox.
Keep in mind however that Trading View can not shom more than 500 lines and text boxes so the indocator will not be able to give you the complete history back to the start for long duration assets.
In order to clean up the charts a little bit there are two additional settings that can be used in the Settings menu:
- Selecting the price range (%) from the current price to be included in the chart. The default is 25%. That means that all levels below or above 20% will not be displayed. You can set this level yourself from 0 up to 100%.
- Selecting the minimum gap size to include on the chart. The default is 1%. That means that all gaps/ranges below 1% in price difference will not be displayed on the chart. You can set the minimum gap size yourself.
BASIC DESCRIPTION OF THE INNER WORKINGS OF THE INDICTATOR
The way the indicator works is that it calculates and identifies all levels from the list of levels type and timeframes above. The indicator then adds this level to a list of untapped levels.
Then for each bar after, it checks if the level has been tapped. If the level has been tapped or a gap/range completely filled, this level is removed from the list so that the levels displayed in the end are only naked/untapped levels.
Below is a descrition of each of the level types and how it is caluclated (algorithm):
PIVOT
Daily, Weekly and Monthly levels in trading refer to significant price points that traders monitor within the context of a single trading day. These levels can provide insights into market behavior and help traders make informed decisions regarding entry and exit points.
Traders often use D/W/M levels to set entry and exit points for trades. For example, entering long positions near support (daily close) or selling near resistance (daily close).
Daily levels are used to set stop-loss orders. Placing stops just below the daily close for long positions or above the daily close for short positions can help manage risk.
The relationship between price movement and daily levels provides insights into market sentiment. For instance, if the price fails to break above the daily high, it may signify bearish sentiment, while a strong breakout can indicate bullish sentiment.
The way these levels are calculated in this indicator is based on finding pivots in the chart on D/W/M timeframe. The level is then set to previous D/W/M close = current D/W/M open.
In addition, when price is going up previous D/W/M open must be smaller than previous D/W/M close and current D/W/M close must be smaller than the current D/W/M open. When price is going down the opposite.
POINT OF CONTROL
The Point of Control (POC) is a key concept in volume profile analysis, which is commonly used in trading.
It represents the price level at which the highest volume of trading occurred during a specific period.
The POC is derived from the volume traded at various price levels over a defined time frame. In this indicator the timeframes are Daily, Weekly, and Montly.
It identifies the price level where the most trades took place, indicating strong interest and activity from traders at that price.
The POC often acts as a significant support or resistance level. If the price approaches the POC from above, it may act as a support level, while if approached from below, it can serve as a resistance level. Traders monitor the POC to gauge potential reversals or breakouts.
The way the POC is calculated in this indicator is by an approximation by analysing intrabars for the respective timeperiod (D/W/M), assigning the volume for each intrabar into the price-bins that the intrabar covers and finally identifying the bin with the highest aggregated volume.
The POC is the price in the middle of this bin.
The indicator uses a sample space for intrabars on the Daily timeframe of 15 minutes, 35 minutes for the Weekly timeframe, and 140 minutes for the Monthly timeframe.
The indicator has predefined the size of the bins to 0.2% of the price at the range low. That implies that the precision of the calulated POC og VAH/VAL is within 0.2%.
This reduction of precision is a tradeoff for performance and speed of the indicator.
This also implies that the bigger the difference from range high prices to range low prices the more bins the algorithm will iterate over. This is typically the case when calculating the monthly volume profile levels and especially high volatility assets such as alt coins.
Sometimes the number of iterations becomes too big for Trading View to handle. In these cases the bin size will be increased even more to reduce the number of iterations.
In such cases the bin size might increase by a factor of 2-3 decreasing the accuracy of the Volume Profile levels.
Anyway, since these Volume Profile levels are approximations and since precision is traded for performance the user should consider the Volume profile levels(POC, VAH, VAL) as zones rather than pin point accurate levels.
VALUE AREA HIGH/LOW STD1/STD2
The Value Area High (VAH) and Value Area Low (VAL) are important concepts in volume profile analysis, helping traders understand price levels where the majority of trading activity occurs for a given period.
The Value Area High/Low is the upper/lower boundary of the value area, representing the highest price level at which a certain percentage of the total trading volume occurred within a specified period.
The VAH/VAL indicates the price point above/below which the majority of trading activity is considered less valuable. It can serve as a potential resistance/support level, as prices above/below this level may experience selling/buying pressure from traders who view the price as overvalued/undervalued
In this indicator the timeframes are Daily, Weekly, and Monthly. This indicator provides two boundaries that can be selected in the menu.
The first boundary is 70% of the total volume (=1 standard deviation from mean). The second boundary is 95% of the total volume (=2 standard deviation from mean).
The way VAH/VAL is calculated is based on the same algorithm as for the POC.
However instead of identifying the bin with the highest volume, we start from range low and sum up the volume for each bin until the aggregated volume = 30%/70% for VAL1/VAH1 and aggregated volume = 5%/95% for VAL2/VAH2.
Then we simply set the VAL/VAH equal to the low of the respective bin.
FAIR VALUE GAPS
Fair Value Gaps (FVG) is a concept primarily used in technical analysis and price action trading, particularly within the context of futures and forex markets. They refer to areas on a price chart where there is a noticeable lack of trading activity, often highlighted by a significant price movement away from a previous level without trading occurring in between.
FVGs represent price levels where the market has moved significantly without any meaningful trading occurring. This can be seen as a "gap" on the price chart, where the price jumps from one level to another, often due to a rapid market reaction to news, events, or other factors.
These gaps typically appear when prices rise or fall quickly, creating a space on the chart where no transactions have taken place. For example, if a stock opens sharply higher and there are no trades at the prices in between the two levels, it creates a gap. The areas within these gaps can be areas of liquidity that the market may return to “fill” later on.
FVGs highlight inefficiencies in pricing and can indicate areas where the market may correct itself. When the market moves rapidly, it may leave behind price levels that traders eventually revisit to establish fair value.
Traders often watch for these gaps as potential reversal or continuation points. Many traders believe that price will eventually “fill” the gap, meaning it will return to those price levels, providing potential entry or exit points.
This indicator calculate FVGs on three different timeframes, Daily, Weekly and Montly.
In this indicator the FVGs are identified by looking for a three-candle pattern on a chart, signalling a discrete imbalance in order volume that prompts a quick price adjustment. These gaps reflect moments where the market sentiment strongly leans towards buying or selling yet lacks the opposite orders to maintain price stability.
The indicator sets the gap to the difference from the high of the first bar to the low of the third bar when price is moving up or from the low of the first bar to the high of the third bar when price is moving down.
CME GAPS (BTC only)
CME gaps refer to price discrepancies that can occur in charts for futures contracts traded on the Chicago Mercantile Exchange (CME). These gaps typically arise from the fact that many futures markets, including those on the CME, operate nearly 24 hours a day but may have significant price movements during periods when the market is closed.
CME gaps occur when there is a difference between the closing price of a futures contract on one trading day and the opening price on the following trading day. This difference can create a "gap" on the price chart.
Opening Gaps: These usually happen when the market opens significantly higher or lower than the previous day's close, often influenced by news, economic data releases, or other market events occurring during non-trading hours.
Gaps can result from reactions to major announcements or developments, such as earnings reports, geopolitical events, or changes in economic indicators, leading to rapid price movements.
The importance of CME Gaps in Trading is the potential for Filling Gaps: Many traders believe that prices often "fill" gaps, meaning that prices may return to the gap area to establish fair value.
This can create potential trading opportunities based on the expectation of gap filling. Gaps can act as significant support or resistance levels. Traders monitor these levels to identify potential reversal points in price action.
The way the gap is identified in this indicator is by checking if current open is higher than previous bar close when price is moving up or if current open is lower than previous day close when price is moving down.
EQUILIBRIUM
Equilibrium in finance and trading refers to a state where supply and demand in a market balance each other, resulting in stable prices. It is a key concept in various economic and trading contexts. Here’s a concise description:
Market Equilibrium occurs when the quantity of a good or service supplied equals the quantity demanded at a specific price level. At this point, there is no inherent pressure for the price to change, as buyers and sellers are in agreement.
Equilibrium Price is the price at which the market is in equilibrium. It reflects the point where the supply curve intersects the demand curve on a graph. At the equilibrium price, the market clears, meaning there are no surplus goods or shortages.
In this indicator the equilibrium level is calculated simply by finding the midpoint of the Daily, Weekly, and Montly candles respectively.
NOTES
1) Performance. The algorithms are quite resource intensive and the time it takes the indicator to calculate all the levels could be 5 seconds or more, depending on the number of bars in the chart and especially if Montly Volume Profile levels are selected (POC, VAH or VAL).
2) Levels displayed vs the selected chart timeframe. On a timeframe smaller than the daily TF - both Daily, Weekly, and Monthly levels will be displayed. On a timeframe bigger than the daily TF but smaller than the weekly TF - the Weekly and Monthly levels will be display but not the Daily levels. On a timeframe bigger than the weekly TF but smaller than the monthly TF - only the Monthly levels will be displayed. Not Daily and Weekly.
CREDITS
The core algorithm for calculating the POC levels is based on the indicator "Naked Intrabar POC" developed by rumpypumpydumpy (https:www.tradingview.com/u/rumpypumpydumpy/).
The "Naked intrabar POC" indicator calculates the POC on the current chart timeframe.
This indicator (Multiple Naked Levels) adds two new features:
1) It calculates the POC on three specific timeframes, the Daily, Weekly, and Monthly timeframes - not only the current chart timeframe.
2) It adds functionaly by calculating the VAL and VAH of the volume profile on the Daily, Weekly, Monthly timeframes .

Funding Rate [CryptoSea]The Funding Rate Indicator by is a comprehensive tool designed to analyze funding rates across multiple cryptocurrency exchanges. This indicator is essential for traders who want to monitor funding rates and their impact on market trends.
Key Features
Exchange Coverage: Includes data from major exchanges such as Binance, Bitmex, Bybit, HTX, Kraken, OKX, Bitstamp, and Coinbase.
Perpetual Futures and Spot Markets: Fetches and analyzes pricing data from both perpetual futures and spot markets to provide a holistic view.
Smoothing and Customization: Allows users to smooth funding rates using a moving average, with customizable MA lengths for tailored analysis.
Dynamic Candle Coloring: Option to color candles based on trading conditions, enhancing visual analysis.
In the example below, the indicator shows how the funding rate shifts with market conditions, providing clear visual cues for bullish and bearish trends.
How it Works
Data Integration: Uses a secure security fetching function to retrieve pricing data while preventing look-ahead bias, ensuring accurate and reliable information.
TWAP Calculation: Computes Time-Weighted Average Prices (TWAP) for both perpetual futures and spot prices, forming the basis for funding rate calculations.
Funding Rate Calculation: Determines the raw funding rate by comparing TWAPs of perpetual futures and spot prices, then applies smoothing to highlight significant trends.
Color Coding: Highlights the funding rate with distinct colors (bullish and bearish), making it easier to interpret market conditions at a glance.
In the example below, the indicator effectively differentiates between bullish and bearish funding rates, aiding traders in making informed decisions based on current market dynamics.
Application
Market Analysis: Enables traders to analyze the impact of funding rates on market trends, facilitating more strategic decision-making.
Trend Identification: Assists in identifying potential market reversals by monitoring shifts in funding rates.
Customizable Settings: Provides extensive input settings for exchange selection, MA length, and candle coloring, allowing for personalized analysis.
The Funding Rate Indicator by is a powerful addition to any trader's toolkit, offering detailed insights into funding rates across multiple exchanges to navigate the cryptocurrency market effectively.
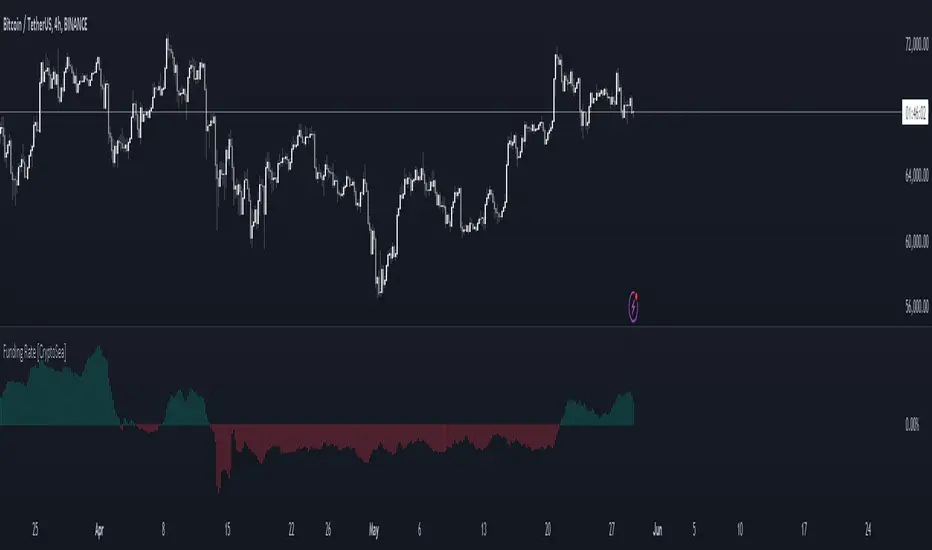
Algoflow's Levels PlotterAlgoflow's Levels Plotter - Indicator
Release Date: Jan. 15, 2024
Release version: v3 r1
Release notes date: Jan. 15, 2024
Overview
Parses user's input of levels to be plotted and labeled on the chart for NQ & ES futures
Features
Quick plotting of predetermined price levels.
- Type or copy from another source of values in a predetermined output format.
Supports separate line plotting for Weekly, OVN and RTH values
- Plot only Weekly, OVN or RTH levels, or all
- Configure colors separately for Inflection Points, Weekly, OVN & RTH levels
- Shift/place price labels separately to easily identify levels
User Impacts of Changes
Requires users to remove previous version and re-add indicator "Algoflow's Levels Plotter", then re-add values. Colors and shift values will need to be re-entered and/or reconfigured
Support
Questions, feedbacks, and requests are welcomed. Please feel free to use Comments or direct private message via TradingView.
Quick usage notes:
The indicator allows you to enter data for both ES & NQ at the same time. This is useful in single chart window/layout situations, like viewing on the phone. When you switch between futures, the data is already there.
If you leave the entries blank, nothing will be plotted. This is useful if you want to have separate charts for ES & NQ. So you can just enter only the relevant data of either.
As an indicator, input values are saved within it, until it is removed from the chart. Input for one chart will not update other charts of the same ticker, even in the same layout.
The easiest and quickest way to share the inputs across all charts and layouts is to use the Indicator Templates feature.
- After input values are entered (for both ES & NQ futures) via the indicator's Settings, select ""Save as Default"".
- Click on ""Indicator Templates"" (4 squares icon), and click on ""Save Indicator template...""
- Remove the previous version of the indicator in other charts.
- Click on ""Indicator Templates"" icon, and select the newly created template. Repeat this for other charts of the same futures ticker
The labels can be disabled in settings > Style tab. Use the Inputs tab to configure orientation (left or right of current bar on chart), and how much spacing from the current (in distance of bars)
Format example:
Primary directional inflection point: 1234
For Bulls: 1244.25, 1254, 1264.50
For Bears: 1224, 1214, 1204
Changes
v3 r1 - Fixed erroneous default values in Weekly input sections. Added options to en/disable display of each set (session) of levels. Default label text size to normal, from small.
- Jan 15, 2024
v2 r9 - Added support for USTEC & US500.
- Dec. 10, 2023
v2 r8 - Added configuration features for users to modify the labels' text colors and size. Simplified code further by moving inputs processing modules into a single user function.
- Oct. 31, 2023
v2 r7 - Added support for the micro NQ & ES. Modified to ignore string case in inputs
- Oct 18, 2023
v2 r4 - Added support of weekly lines and labels features. Began the process of optimizing/simplifying code
- Oct. 15, 2023
v2 r3 - Made Inflection Point levels' colors configurable
- Oct. 04, 2023
v2 r2 - Removed comments & debug codes from development build revision #518
- Oct. 04, 2023
v2 r1 - Released from development revision #518. Major rewrite to fix previous and overlapping plots of lines and labels.
- Oct. 04, 2023
v1 r2 - First release of indicator
- Oct. 02, 2023

Pairs strategyHello, Tradingview community,
I am been playing with this idea that nowadays trading instruments are interconnected and when one goes too far "out of order" it should return to the mean.
So, here's a relatively simple idea.
This is a LONG-ONLY strategy.
Buy when your traded instrument's last bar closes down, and the comparing instrument closes up.
Sell when close is higher than the previous bar's high.
Best results I found with medium timeframes: 45min, 120min, 180min.
Also, feel free to test non-typical timeframes such as 59min, 119min, 179min, etc.
My reasoning for medium timeframes would be, that they are big enough to avoid "market noise"
of smaller timeframes + commissions & slippage is less negligible, and small enough to avoid exposure of higher timeframes, although, I haven't tested D timeframe and above.
The best results, I found were with instruments that aren't directly correlated. I mostly tested equities and equity futures, so for equity indexes, equity index futures, or large-cap stocks, NASDAQ:SMH , NASDAQ:NVDA , EURUSD, and Crude Oil would be a good candidate for comparing symbols.
When testing either futures or stocks, please adjust the commission for each asset, for stocks I use % equity, so it compounds over time, whereas, for futures, I use 1 contract all the time.
Here's NASDAQ:MSFT on 119min chart
Here's AMEX:SPY on 59min chart using NASDAQ:NVDA as comparison
Here's CME_MINI:ES1! on 179min chart using NYMEX:CL1! as comparison
To change comparison symbol just insert your symbol between the brackets on both fields down here.
SymbolClose = request.security("YOUR SYMBOL HERE", timeframe.period, close)
SymbolOpen = request.security("YOUR SYMBOL HERE", timeframe.period, open)
Since I am still relatively new to testing, hence, I am publishing this idea, so you can point out some crucial things I may have missed.
Thanks,
Enjoy the strategy!

COT MCIThe COT MCI script is a market indicator based on the data from the Commitment of Traders Reports.
Integration of COT Report Data:
The script sources COT data from futures contracts, including:
Treasury Bonds (ZB), Dollar Index (DX), 10-Year Treasury Notes (ZN)
Commodities like Soybeans (ZS), Soy Meal (ZM), Soy Oil (ZL), Corn (ZC), Wheat (ZW), Kansas City Wheat (KE), Pork (HE), Cattle (LE)
Precious Metals such as Gold (GC), Silver (SI), Palladium (PA), Platinum (PL)
Industrial Metals like Copper (HG), Aluminum (AUP), Steel (HRC)
Energy Products like Crude Oil (CL), Heating Oil (HO), Gasoline (RB), Natural Gas (NG), Brent Crude (BB)
Currencies such as AUD (6A), GBP (6B), CAD (6C), EUR (6E), JPY (6J), CHF (6S), NZD (6N), BRL (6L), MXN (6M), RUB (6R), ZAR (6Z)
Others: Sugar (SB), Coffee (KC), Cocoa (CC), Cotton (CT), Ethanol (EH), Rice (ZR), Oats (ZO), Whey (DC), Orange Juice (OJ), Lumber (LBS), Livestock (GF), E-mini S&P 500 (ES), E-mini Russell 2000 (RTY), E-mini Dow Jones (YM), E-mini NASDAQ-100 (NQ), VIX Futures (VX), S&P 500 (SP), DJIA (DJIA)
Cryptocurrencies such as Bitcoin (BTC) and Ethereum (ETH)
Functions and Logic of the Script:
COT Calculation: Determines the net positions for commercial actors and large speculators. Also Available are short and long positions of commercials or large speculators.
Position Change Analysis: Analyzes the percentage changes in net positions and open interest data over a period of 6 weeks (Weekly Chart).
Average Value Calculation: Determines short-term and long-term trend averages.
Trend Analysis: Buy and sell signals (represented in colors) are based on linear regressions and average calculations.
Usage and Application Examples:
Ideal for traders looking for a detailed analysis of market dynamics and position changes in the futures market. Suitable for decision-making in transaction timing and assessing market sentiment.
Usage Notes:
Users should be familiar with the interpretation of COT data and basic concepts of futures trading. Particularly suitable for medium to long-term trading strategies.

Variation from Opening📈 Purpose: This script provides traders with a clear visualization of the percentage variation from the opening price for two major futures contracts: ES1! (S&P 500 futures) and NQ1! (Nasdaq 100 futures).
🔑 Key Features:
Real-Time Price Retrieval: Fetches the latest opening prices for ES1! and NQ1! contracts.
Percentage Variation Computation: Determines the percentage change from the opening price, offering traders an immediate view of market dynamics.
Clear Visualization: Plots the percentage variation for both contracts in distinct colors (red for ES1! and blue for NQ1!) for easy differentiation.
💡 Benefits:
Informed Trading: Understand intraday price movements to make better trading decisions.
Versatility: While tailored for ES1! and NQ1!, the script can be adapted for other securities.
Clean Display: A focused, clutter-free chart ensures traders can quickly gauge market movements.
🎯 Ideal For: Traders looking to monitor intraday price shifts of major futures contracts.
Equip yourself with the "Variation from Opening" script and enhance your trading insights!

Bitcoin CME Gap TrackerCME Bitcoin Futures Gaps: What Are They and Why Are They Important?
Gaps are breaks between price candles on charts, illustrating the intervals between the closing price of the previous period and the opening price of the next. For Bitcoin on CME, these gaps arise due to the particular workings of this market.
Bitcoin and other cryptocurrencies trade 24/7 without breaks. However, CME Bitcoin Futures, like many other financial instruments on traditional exchanges, have weekends and trading pauses. When the Bitcoin market continues to move during weekends or CME closures, and then CME opens on the subsequent trading day, a price disparity can occur, perceived as a gap.
Several studies suggest that in most cases (approximately 70% and more), the market reverts to "close" these gaps. This phenomenon is observed because large liquidity is concentrated at these gap points. There are many unfilled orders in gap zones, placed at specific prices. When the price reaches these levels, it can swiftly react to this "clustering" of orders, potentially leading to the gap's closure.
Therefore, CME Bitcoin Futures gaps not only reflect crucial psychological moments in the market but can also serve as potential entry or exit points, considering the high liquidity in these zones.
Technical Description:
The script is designed to identify gaps in the Bitcoin Futures chart on CME. It automatically detects gaps that appear on Mondays (since CME is closed on weekends) and are larger than the user-specified percentage.
Key Features:
Identification of the weekday to detect gaps that arose on Monday.
Calculation of positive and negative gaps by comparing the highs and lows of the previous candles with the current ones.
Graphical representation of the gaps using lines and labels on the chart.
User Guide:
Add this script to your TradingView chart.
You can adjust the "Show gaps larger than %" parameter to determine the minimum gap size of interest.
Gaps will be automatically displayed on your chart with lines and labels.
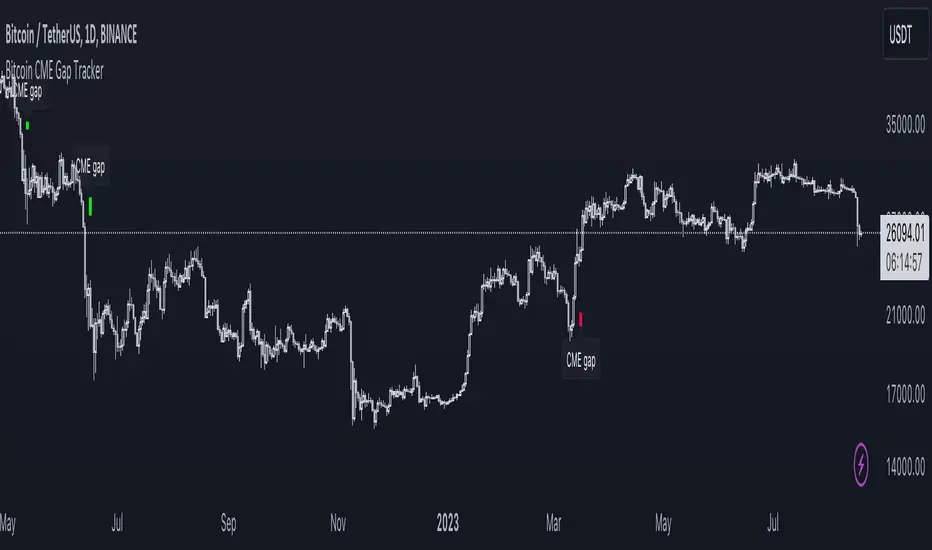
3-Signal Directional Trend Strategy for E-MinisThis is a conceptual strategy intended for E-mini S&P 500 futures with hourly bars.
It uses three signals, going long or short when two or more change in the same direction.
First is MACD. A positive oscillator is considered a bullish signal and a falling oscillator is interpreted bearishly.
Next, stochastics are used as an overbought/oversold indicator. Overbought conditions are considered bearish and oversold readings are viewed as bullish.
Third is a custom indicator based on our Moving Average Speed script. It takes the rate of change of the 50-hour simple moving average (SMA), and then smooths it using a 10-period average. This provides a directional signal.
Traders may want to experiment with different settings for moving average speed.
Note: This is intended for use with stock index futures, which have round-the clock price data to populate the data in the indicators. It may not yield good results with stocks or ETFs.
TradeStation has, for decades, advanced the trading industry, providing access to stocks, options, futures and cryptocurrencies. See our Overview for more.
Important Information
TradeStation Securities, Inc., TradeStation Crypto, Inc., and TradeStation Technologies, Inc. are each wholly owned subsidiaries of TradeStation Group, Inc., all operating, and providing products and services, under the TradeStation brand and trademark. TradeStation Crypto, Inc. offers to self-directed investors and traders cryptocurrency brokerage services. It is neither licensed with the SEC or the CFTC nor is it a Member of NFA. When applying for, or purchasing, accounts, subscriptions, products, and services, it is important that you know which company you will be dealing with. Please click here for further important information explaining what this means.
This content is for informational and educational purposes only. This is not a recommendation regarding any investment or investment strategy. Any opinions expressed herein are those of the author and do not represent the views or opinions of TradeStation or any of its affiliates.
Investing involves risks. Past performance, whether actual or indicated by historical tests of strategies, is no guarantee of future performance or success. There is a possibility that you may sustain a loss equal to or greater than your entire investment regardless of which asset class you trade (equities, options, futures, or digital assets); therefore, you should not invest or risk money that you cannot afford to lose. Before trading any asset class, first read the relevant risk disclosure statements on the Important Documents page, found here: www.tradestation.com .
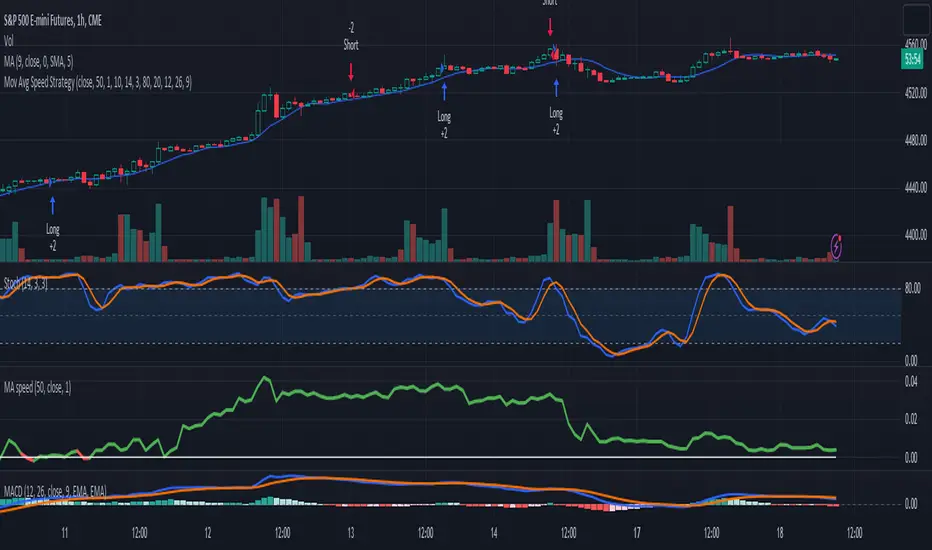
BSM OPM 1973 w/ Continuous Dividend Yield [Loxx]Generalized Black-Scholes-Merton w/ Analytical Greeks is an adaptation of the Black-Scholes-Merton Option Pricing Model including Analytical Greeks and implied volatility calculations. The following information is an excerpt from Espen Gaarder Haug's book "Option Pricing Formulas". The options sensitivities (Greeks) are the partial derivatives of the Black-Scholes-Merton ( BSM ) formula. Analytical Greeks for our purposes here are broken down into various categories:
Delta Greeks: Delta, DDeltaDvol, Elasticity
Gamma Greeks: Gamma, GammaP, DGammaDSpot/speed, DGammaDvol/Zomma
Vega Greeks: Vega , DVegaDvol/Vomma, VegaP
Theta Greeks: Theta
Rate/Carry Greeks: Rho, Rho futures option, Carry Rho, Phi/Rho2
Probability Greeks: StrikeDelta, Risk Neutral Density
(See the code for more details)
Black-Scholes-Merton Option Pricing
The Black-Scholes-Merton model can be "generalized" by incorporating a cost-of-carry rate b. This model can be used to price European options on stocks, stocks paying a continuous dividend yield, options on futures, and currency options:
c = S * e^((b - r) * T) * N(d1) - X * e^(-r * T) * N(d2)
p = X * e^(-r * T) * N(-d2) - S * e^((b - r) * T) * N(-d1)
where
d1 = (log(S / X) + (b + v^2 / 2) * T) / (v * T^0.5)
d2 = d1 - v * T^0.5
b = r ... gives the Black and Scholes (1973) stock option model.
b = r — q ... gives the Merton (1973) stock option model with continuous dividend yield q. <== this is the one used for this indicator!
b = 0 ... gives the Black (1976) futures option model.
b = 0 and r = 0 ... gives the Asay (1982) margined futures option model.
b = r — rf ... gives the Garman and Kohlhagen (1983) currency option model.
Inputs
S = Stock price.
X = Strike price of option.
T = Time to expiration in years.
r = Risk-free rate
d = dividend yield
v = Volatility of the underlying asset price
cnd (x) = The cumulative normal distribution function
nd(x) = The standard normal density function
convertingToCCRate(r, cmp ) = Rate compounder
gImpliedVolatilityNR(string CallPutFlag, float S, float x, float T, float r, float b, float cm , float epsilon) = Implied volatility via Newton Raphson
gBlackScholesImpVolBisection(string CallPutFlag, float S, float x, float T, float r, float b, float cm ) = implied volatility via bisection
Implied Volatility: The Bisection Method
The Newton-Raphson method requires knowledge of the partial derivative of the option pricing formula with respect to volatility ( vega ) when searching for the implied volatility . For some options (exotic and American options in particular), vega is not known analytically. The bisection method is an even simpler method to estimate implied volatility when vega is unknown. The bisection method requires two initial volatility estimates (seed values):
1. A "low" estimate of the implied volatility , al, corresponding to an option value, CL
2. A "high" volatility estimate, aH, corresponding to an option value, CH
The option market price, Cm , lies between CL and cH . The bisection estimate is given as the linear interpolation between the two estimates:
v(i + 1) = v(L) + (c(m) - c(L)) * (v(H) - v(L)) / (c(H) - c(L))
Replace v(L) with v(i + 1) if c(v(i + 1)) < c(m), or else replace v(H) with v(i + 1) if c(v(i + 1)) > c(m) until |c(m) - c(v(i + 1))| <= E, at which point v(i + 1) is the implied volatility and E is the desired degree of accuracy.
Implied Volatility: Newton-Raphson Method
The Newton-Raphson method is an efficient way to find the implied volatility of an option contract. It is nothing more than a simple iteration technique for solving one-dimensional nonlinear equations (any introductory textbook in calculus will offer an intuitive explanation). The method seldom uses more than two to three iterations before it converges to the implied volatility . Let
v(i + 1) = v(i) + (c(v(i)) - c(m)) / (dc / dv (i))
until |c(m) - c(v(i + 1))| <= E at which point v(i + 1) is the implied volatility , E is the desired degree of accuracy, c(m) is the market price of the option, and dc/ dv (i) is the vega of the option evaluaated at v(i) (the sensitivity of the option value for a small change in volatility ).
Things to know
Only works on the daily timeframe and for the current source price.
You can adjust the text size to fit the screen

Cox-Ross-Rubinstein Binomial Tree Options Pricing Model [Loxx]Cox-Ross-Rubinstein Binomial Tree Options Pricing Model is an options pricing panel calculated using an N-iteration (limited to 300 in Pine Script due to matrices size limits) "discrete-time" (lattice based) method to approximate the closed-form Black–Scholes formula. Joshi (2008) outlined varying binomial options pricing model furnishes a numerical approach for the valuation of options. Significantly, the American analogue can be estimated using the binomial tree. This indicator is the complex calculation for Binomial option pricing. Most folks take a shortcut and only calculate 2 iterations. I've coded this to allow for up to 300 iterations. This can be used to price American Puts/Calls and European Puts/Calls. I'll be updating this indicator will be updated with additional features over time. If you would like to learn more about options, I suggest you check out the book textbook Options, Futures and other Derivative by John C Hull.
***This indicator only works on the daily timeframe!***
A quick graphic of what this all means:
In the graphic, "n" are the steps, in this case we can do up to 300, in production we'd need to do 5-15K. That's a lot of steps! You can see here how the binomial tree fans out. As I said previously, most folks only calculate 2 steps, here we are calculating up to 300.
Want to learn more about Simple Introduction to Cox, Ross Rubinstein (1979) ?
Watch this short series "Introduction to Basic Cox, Ross and Rubinstein (1979) model."
Limitations of Black Scholes options pricing model
This is a widely used and well-known options pricing model, factors in current stock price, options strike price, time until expiration (denoted as a percent of a year), and risk-free interest rates. The Black-Scholes Model is quick in calculating any number of option prices. But the model cannot accurately calculate American options, since it only considers the price at an option's expiration date. American options are those that the owner may exercise at any time up to and including the expiration day.
What are Binomial Trees in options pricing?
A useful and very popular technique for pricing an option involves constructing a binomial tree. This is a diagram representing different possible paths that might be followed by the stock price over the life of an option. The underlying assumption is that the stock price follows a random walk. In each time step, it has a certain probability of moving up by a certain percentage amount and a certain probability of moving down by a certain percentage amount. In the limit, as the time step becomes smaller, this model is the same as the Black–Scholes–Merton model.
What is the Binomial options pricing model ?
This model uses a tree diagram with volatility factored in at each level to show all possible paths an option's price can take, then works backward to determine one price. The benefit of the Binomial Model is that you can revisit it at any point for the possibility of early exercise. Early exercise is executing the contract's actions at its strike price before the contract's expiration. Early exercise only happens in American-style options. However, the calculations involved in this model take a long time to determine, so this model isn't the best in rushed situations.
What is the Cox-Ross-Rubinstein Model?
The Cox-Ross-Rubinstein binomial model can be used to price European and American options on stocks without dividends, stocks and stock indexes paying a continuous dividend yield, futures, and currency options. Option pricing is done by working backwards, starting at the terminal date. Here we know all the possible values of the underlying price. For each of these, we calculate the payoffs from the derivative, and find what the set of possible derivative prices is one period before. Given these, we can find the option one period before this again, and so on. Working ones way down to the root of the tree, the option price is found as the derivative price in the first node.
Inputs
Spot price: select from 33 different types of price inputs
Calculation Steps: how many iterations to be used in the Binomial model. In practice, this number would be anywhere from 5000 to 15000, for our purposes here, this is limited to 300
Strike Price: the strike price of the option you're wishing to model
% Implied Volatility: here you can manually enter implied volatility
Historical Volatility Period: the input period for historical volatility; historical volatility isn't used in the CRRBT process, this is to serve as a sort of benchmark for the implied volatility,
Historical Volatility Type: choose from various types of implied volatility, search my indicators for details on each of these
Option Base Currency: this is to calculate the risk-free rate, this is used if you wish to automatically calculate the risk-free rate instead of using the manual input. this uses the 10 year bold yield of the corresponding country
% Manual Risk-free Rate: here you can manually enter the risk-free rate
Use manual input for Risk-free Rate? : choose manual or automatic for risk-free rate
% Manual Yearly Dividend Yield: here you can manually enter the yearly dividend yield
Adjust for Dividends?: choose if you even want to use use dividends
Automatically Calculate Yearly Dividend Yield? choose if you want to use automatic vs manual dividend yield calculation
Time Now Type: choose how you want to calculate time right now, see the tool tip
Days in Year: choose how many days in the year, 365 for all days, 252 for trading days, etc
Hours Per Day: how many hours per day? 24, 8 working hours, or 6.5 trading hours
Expiry date settings: here you can specify the exact time the option expires
Take notes:
Futures don't risk free yields. If you are pricing options of futures, then the risk-free rate is zero.
Dividend yields are calculated using TradingView's internal dividend values
This indicator only works on the daily timeframe
Included
Option pricing panel
Loxx's Expanded Source Types
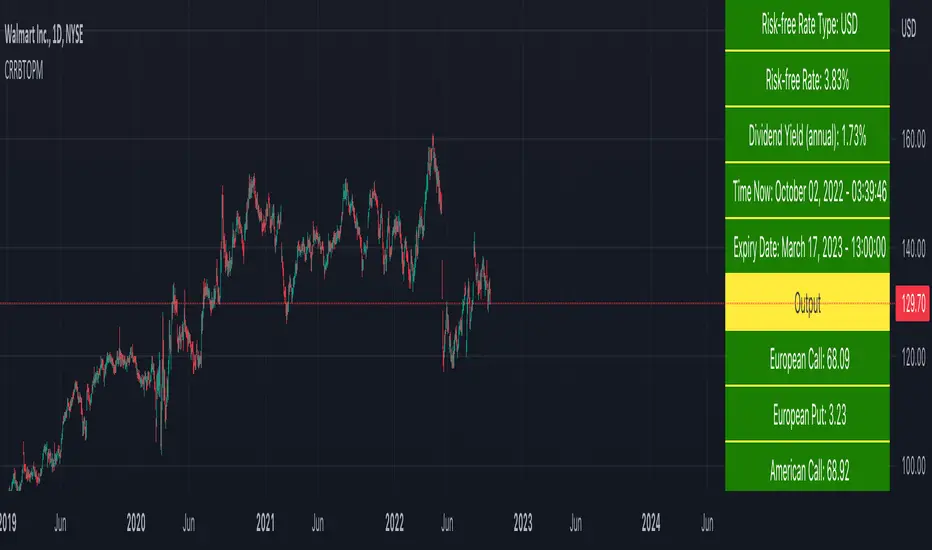
Advanced Volume ProfileTHIS SCRIPT CURRENTLY ONLY WORKS FOR ASSETS THAT TRADE 24/7 OR CBOE FUTURES HOURS!
This script plots volume relative to an asset's historical volume profile.
Usage:
As a companion to my "Unusual Time Frame Volume" (UTF Volume) script, this plots volume against the same historical volume profile used for UTF Volume.
The same high volume (relative to historical) threshold alert is available (yellow bar).
Likewise, if the volume exceeds the historical threshold, but is below the alert threshold, the bar color is orange.
At the top of the chart is an indicator which is green if a bar has higher volume than the previous bar.
You can also set a threshold for this such that if the volume of a bar exceeds the previous bar by a certain multiplier which will turn the indicator yellow.
For example, if the threshold is set to "1.5", then the indicator will be yellow (instead of green) on an increase in volume over the previous bar of 1.5x.
NOTES:
Again, this script currently only works for assets that trade 24/7 or CBOE Futures hours!
Make sure you set the "Asset Mode" and "Time Frame (minutes)" to values that match your asset and chart setting.
For example, if you are trading Futures on a 2m chart, set the Asset Mode to Futures and Time Frame to 2m.
If you are trading crypto on a 5m chart, set the Asset Mode to 24/7 and Time Frame to 5m.
If the settings are not set appropriately, the output will be incorrect/invalid.
If you choose a "Look-back (Days)" setting that is too far back given the time frame, the script will produce an error.
I suggest playing with settings from "1" (compares volume to the previous day's volume) to the highest number that doesn't break the script.
For example, at a 2m time frame, the maximum look-back will be "6" or "7" depending on which mode you are using.
Longer chart time settings allow larger look-back values.
I find that the default value ("6") does a decent job in general.
Please feel free to reuse or further develop this script.
I would greatly appreciate it if you would send me a message below if you find it useful.
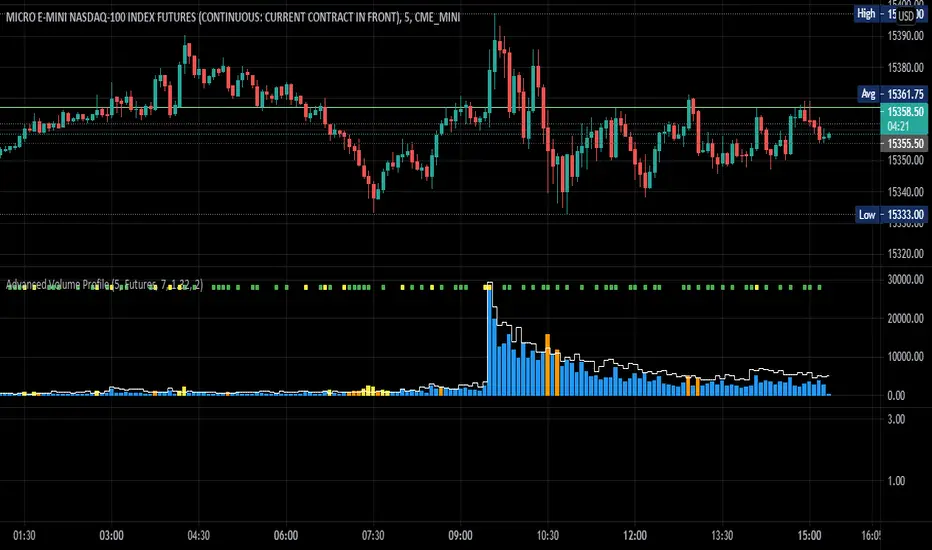
Waindrops [Makit0]█ OVERALL
Plot waindrops (custom volume profiles) on user defined periods, for each period you get high and low, it slices each period in half to get independent vwap, volume profile and the volume traded per price at each half.
It works on intraday charts only, up to 720m (12H). It can plot balanced or unbalanced waindrops, and volume profiles up to 24H sessions.
As example you can setup unbalanced periods to get independent volume profiles for the overnight and cash sessions on the futures market, or 24H periods to get the full session volume profile of EURUSD
The purpose of this indicator is twofold:
1 — from a Chartist point of view, to have an indicator which displays the volume in a more readable way
2 — from a Pine Coder point of view, to have an example of use for two very powerful tools on Pine Script:
• the recently updated drawing limit to 500 (from 50)
• the recently ability to use drawings arrays (lines and labels)
If you are new to Pine Script and you are learning how to code, I hope you read all the code and comments on this indicator, all is designed for you,
the variables and functions names, the sometimes too big explanations, the overall structure of the code, all is intended as an example on how to code
in Pine Script a specific indicator from a very good specification in form of white paper
If you wanna learn Pine Script form scratch just start HERE
In case you have any kind of problem with Pine Script please use some of the awesome resources at our disposal: USRMAN , REFMAN , AWESOMENESS , MAGIC
█ FEATURES
Waindrops are a different way of seeing the volume and price plotted in a chart, its a volume profile indicator where you can see the volume of each price level
plotted as a vertical histogram for each half of a custom period. By default the period is 60 so it plots an independent volume profile each 30m
You can think of each waindrop as an user defined candlestick or bar with four key values:
• high of the period
• low of the period
• left vwap (volume weighted average price of the first half period)
• right vwap (volume weighted average price of the second half period)
The waindrop can have 3 different colors (configurable by the user):
• GREEN: when the right vwap is higher than the left vwap (bullish sentiment )
• RED: when the right vwap is lower than the left vwap (bearish sentiment )
• BLUE: when the right vwap is equal than the left vwap ( neutral sentiment )
KEY FEATURES
• Help menu
• Custom periods
• Central bars
• Left/Right VWAPs
• Custom central bars and vwaps: color and pixels
• Highly configurable volume histogram: execution window, ticks, pixels, color, update frequency and fine tuning the neutral meaning
• Volume labels with custom size and color
• Tracking price dot to be able to see the current price when you hide your default candlesticks or bars
█ SETTINGS
Click here or set any impar period to see the HELP INFO : show the HELP INFO, if it is activated the indicator will not plot
PERIOD SIZE (max 2880 min) : waindrop size in minutes, default 60, max 2880 to allow the first half of a 48H period as a full session volume profile
BARS : show the central and vwap bars, default true
Central bars : show the central bars, default true
VWAP bars : show the left and right vwap bars, default true
Bars pixels : width of the bars in pixels, default 2
Bars color mode : bars color behavior
• BARS : gets the color from the 'Bars color' option on the settings panel
• HISTOGRAM : gets the color from the Bearish/Bullish/Neutral Histogram color options from the settings panel
Bars color : color for the central and vwap bars, default white
HISTOGRAM show the volume histogram, default true
Execution window (x24H) : last 24H periods where the volume funcionality will be plotted, default 5
Ticks per bar (max 50) : width in ticks of each histogram bar, default 2
Updates per period : number of times the histogram will update
• ONE : update at the last bar of the period
• TWO : update at the last bar of each half period
• FOUR : slice the period in 4 quarters and updates at the last bar of each of them
• EACH BAR : updates at the close of each bar
Pixels per bar : width in pixels of each histogram bar, default 4
Neutral Treshold (ticks) : delta in ticks between left and right vwaps to identify a waindrop as neutral, default 0
Bearish Histogram color : histogram color when right vwap is lower than left vwap, default red
Bullish Histogram color : histogram color when right vwap is higher than left vwap, default green
Neutral Histogram color : histogram color when the delta between right and left vwaps is equal or lower than the Neutral treshold, default blue
VOLUME LABELS : show volume labels
Volume labels color : color for the volume labels, default white
Volume Labels size : text size for the volume labels, choose between AUTO, TINY, SMALL, NORMAL or LARGE, default TINY
TRACK PRICE : show a yellow ball tracking the last price, default true
█ LIMITS
This indicator only works on intraday charts (minutes only) up to 12H (720m), the lower chart timeframe you can use is 1m
This indicator needs price, time and volume to work, it will not work on an index (there is no volume), the execution will not be allowed
The histogram (volume profile) can be plotted on 24H sessions as limit but you can plot several 24H sessions
█ ERRORS AND PERFORMANCE
Depending on the choosed settings, the script performance will be highly affected and it will experience errors
Two of the more common errors it can throw are:
• Calculation takes too long to execute
• Loop takes too long
The indicator performance is highly related to the underlying volatility (tick wise), the script takes each candlestick or bar and for each tick in it stores the price and volume, if the ticker in your chart has thousands and thousands of ticks per bar the indicator will throw an error for sure, it can not calculate in time such amount of ticks.
What all of that means? Simply put, this will throw error on the BITCOIN pair BTCUSD (high volatility with tick size 0.01) because it has too many ticks per bar, but lucky you it will work just fine on the futures contract BTC1! (tick size 5) because it has a lot less ticks per bar
There are some options you can fine tune to boost the script performance, the more demanding option in terms of resources consumption is Updates per period , by default is maxed out so lowering this setting will improve the performance in a high way.
If you wanna know more about how to improve the script performance, read the HELP INFO accessible from the settings panel
█ HOW-TO SETUP
The basic parameters to adjust are Period size , Ticks per bar and Pixels per bar
• Period size is the main setting, defines the waindrop size, to get a better looking histogram set bigger period and smaller chart timeframe
• Ticks per bar is the tricky one, adjust it differently for each underlying (ticker) volatility wise, for some you will need a low value, for others a high one.
To get a more accurate histogram set it as lower as you can (min value is 1)
• Pixels per bar allows you to adjust the width of each histogram bar, with it you can adjust the blank space between them or allow overlaping
You must play with these three parameters until you obtain the desired histogram: smoother, sharper, etc...
These are some of the different kind of charts you can setup thru the settings:
• Balanced Waindrops (default): charts with waindrops where the two halfs are of same size.
This is the default chart, just select a period (30m, 60m, 120m, 240m, pick your poison), adjust the histogram ticks and pixels and watch
• Unbalanced Waindrops: chart with waindrops where the two halfs are of different sizes.
Do you trade futures and want to plot a waindrop with the first half for the overnight session and the second half for the cash session? you got it;
just adjust the period to 1860 for any CME ticker (like ES1! for example) adjust the histogram ticks and pixels and watch
• Full Session Volume Profile: chart with waindrops where only the first half plots.
Do you use Volume profile to analize the market? Lucky you, now you can trick this one to plot it, just try a period of 780 on SPY, 2760 on ES1!, or 2880 on EURUSD
remember to adjust the histogram ticks and pixels for each underlying
• Only Bars: charts with only central and vwap bars plotted, simply deactivate the histogram and volume labels
• Only Histogram: charts with only the histogram plotted (volume profile charts), simply deactivate the bars and volume labels
• Only Volume: charts with only the raw volume numbers plotted, simply deactivate the bars and histogram
If you wanna know more about custom full session periods for different asset classes, read the HELP INFO accessible from the settings panel
EXAMPLES
Full Session Volume Profile on MES 5m chart:
Full Session Unbalanced Waindrop on MNQ 2m chart (left side Overnight session, right side Cash Session):
The following examples will have the exact same charts but on four different tickers representing a futures contract, a forex pair, an etf and a stock.
We are doing this to be able to see the different parameters we need for plotting the same kind of chart on different assets
The chart composition is as follows:
• Left side: Volume Labels chart (period 10)
• Upper Right side: Waindrops (period 60)
• Lower Right side: Full Session Volume Profile
The first example will specify the main parameters, the rest of the charts will have only the differences
MES :
• Left: Period size: 10, Bars: uncheck, Histogram: uncheck, Execution window: 1, Ticks per bar: 2, Updates per period: EACH BAR,
Pixels per bar: 4, Volume labels: check, Track price: check
• Upper Right: Period size: 60, Bars: check, Bars color mode: HISTOGRAM, Histogram: check, Execution window: 2, Ticks per bar: 2,
Updates per period: EACH BAR, Pixels per bar: 4, Volume labels: uncheck, Track price: check
• Lower Right: Period size: 2760, Bars: uncheck, Histogram: check, Execution window: 1, Ticks per bar: 1, Updates per period: EACH BAR,
Pixels per bar: 2, Volume labels: uncheck, Track price: check
EURUSD :
• Upper Right: Ticks per bar: 10
• Lower Right: Period size: 2880, Ticks per bar: 1, Pixels per bar: 1
SPY :
• Left: Ticks per bar: 3
• Upper Right: Ticks per bar: 5, Pixels per bar: 3
• Lower Right: Period size: 780, Ticks per bar: 2, Pixels per bar: 2
AAPL :
• Left: Ticks per bar: 2
• Upper Right: Ticks per bar: 6, Pixels per bar: 3
• Lower Right: Period size: 780, Ticks per bar: 1, Pixels per bar: 2
█ THANKS TO
PineCoders for all they do, all the tools and help they provide and their involvement in making a better community
scarf for the idea of coding a waindrops like indicator, I did not know something like that existed at all
All the Pine Coders, Pine Pros and Pine Wizards, people who share their work and knowledge for the sake of it and helping others, I'm very grateful indeed
I'm learning at each step of the way from you all, thanks for this awesome community;
Opensource and shared knowledge: this is the way! (said with canned voice from inside my helmet :D)
█ NOTE
This description was formatted following THIS guidelines
═════════════════════════════════════════════════════════════════════════
I sincerely hope you enjoy reading and using this work as much as I enjoyed developing it :D
GOOD LUCK AND HAPPY TRADING!
