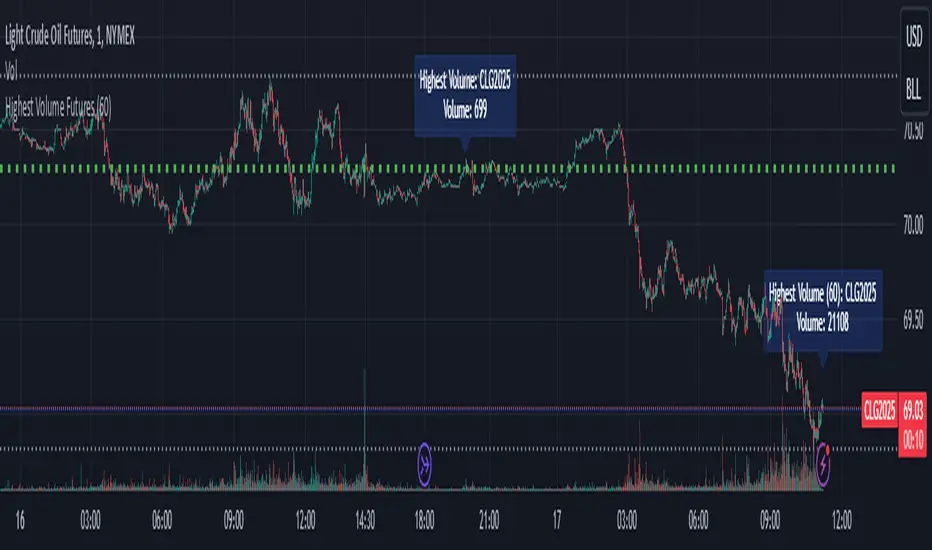
Highest Volume FuturesScript tracks the volume of futures contracts which are not expired for the current and next year. Provides a label at the real-time bar and when a different contract has higher volume in the last bar of the timeframe input as long as it is different from the current ticker. It should display on continuous and lower volume contract charts.
Intended to be used with a higher timeframe input.
Currently supports ES, MES, NQ, MNQ, RTY, M2K, YM, MYM, BTC, MBT, CL, MCL, GC, MGC, E7 and J7. If you'd like to add your own, then include the syminfo.root of your ticker and the appropriate month codes for that contract in the validMonthCodes switch list.
Cerca negli script per "Futures"
Binance Futures Swap-Spot Basis LabelNote: This script will only work with Binance Futures Symbols
This script calculates the basis between the Binance Future and Binance Spot market for the coin you are currently viewing and paints a label on the chart which displays the percentage difference between future and spot. If the future is trading below the spot market the text will be red indicating backwardation and if the future is trading above spot, it will be green indicating contango. Please note this script will only work on Binance perps against Binance spot. The script will change based on what perp you are looking at, no inputs are required.

ICT Index Futures Vertical LinesLearning to trade is complicated enough, so to make the process it little less daunting, I decided to create something helpful.
This indicator relieves you of drawing the same lines and levels over and over each trading day.
It also provides key price levels for you to watch when the trading session starts.
This project is inspired by the ICT 2022 Mentorship.
This indicator was designed and tested to practice and trade the CME Index Futures like Nasdaq, S&P500 and the DOW.
The concepts by ICT are known to work on other markets like Crypto, but I haven't tested that so use at your own risk.
Features:
When a new trading day starts, the following lipstick is put on the chart:
Vertical lines:
- Globex (Overnight) Session Start @17.00
- New York Midnight @ 00:00
- New York AM Session Start @ 08.30
- CME Open @ 09.30
- New York Lunch Start @12.00
- New York PM Session Start @13.00
- New York PM Session End @ 16.30
Important levels:
- Globex (Overnight) Session Opening price
- Globex (Overnight) Session High
- Globex (Overnight) Session Low
- New York Mignight Opening Price
Additional features:
- Shows the day of the week at the bottom for your convenience
- London Killzone Vertical lines
- London Killzone Highlight
- NY Lunch No-Trade-Zone Highlight
- Important levels have a small label to show their meaning and price
- Almost everything is customizable: colors, line types, times, etc
- Customizable timezone setting in case you don't want to work on ICT's recommended timezone (New York UTC-4)
- Toggle to Show only Today's drawings on the chart. You can choose to display all chart lipstick from almost a month of trading data to do your research. Ideal if you want to determine the daily profiles for example.
Screenshots:
London Killzone Highlight turned on:
Multi Day Lipstick:

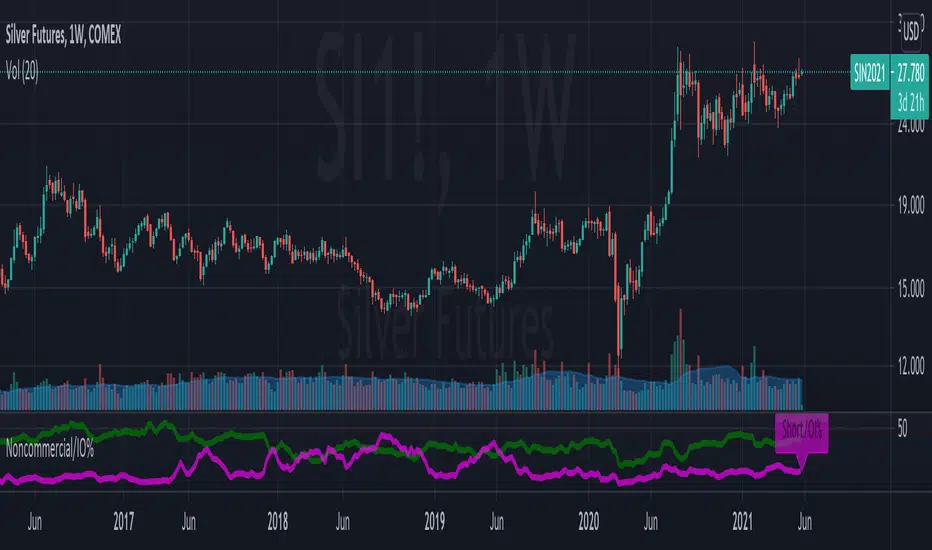
Noncommercial long futures position to overall Open InterestThis is an indicator that gets data from Quandl and presents weekly CFTC futures data (www.cftc.gov). In this indicator, the noncommercial long/short positions are calculated as a percentage of overall Open Interest. This indicates the bullish/bearish sentiment of the market.

Market Profile for Futures with Session and After Hours SplitAdapted existing Market Profile scripts to be move suitable for Futures Markets with Session and After Hours split
Script Provides split Market Profiles for Session and After Hours
Users can customize the Session and AH hours inputs to suit any ticker and their interpretation of prime and non-prime hours

CME & XBT - BTC Futures Settlement DatesHi everyone
This in an indicator inspired by Scarrff
I added the XBT quarterly and yearly settlement dates
Enjoy
David

Bitmex BTC FuturesBitmex / Bitcoin indicator.
Just a simple overlay to visualise the contango / backwardation on Bitmex btc futures products so you know which to take position in, at a glance.
There are two selectable instruments (I have Dec18 and Mar19 selected already). By default the one with nearest settlement date is plotted with a filled coloured band from current price, the other plots a cross symbol.

Index Vs Futures for OKEX Quarterly Contracts 5.0*****Please note that all old versions of this script are depreciated and will report incorrect data!*****
This "indicator" is made to display the history of the price difference between OKEX's quarterly contracts and the market that it is supposed to be tracking. Contango differences are natural, but it's nice to visualize how they change over time.
This update to this script brings in further functionality when OKEX changed the index that the futures contracts are based off of to remove chinese exchanges from the mix. This script reflects that change and crosses-over when that change was made.
The new index removed chinese exchanges which are (currently) trading at a significant discount which will give bad data when using my old code.

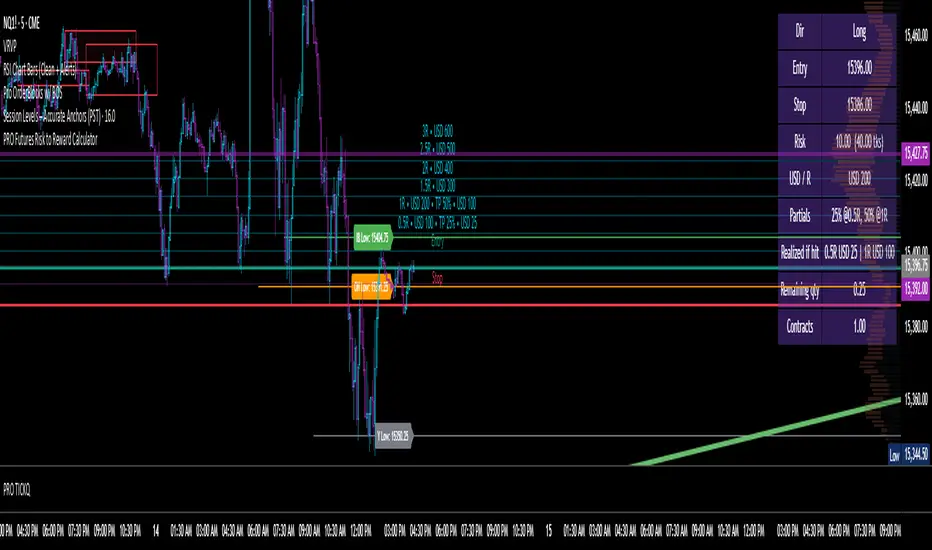
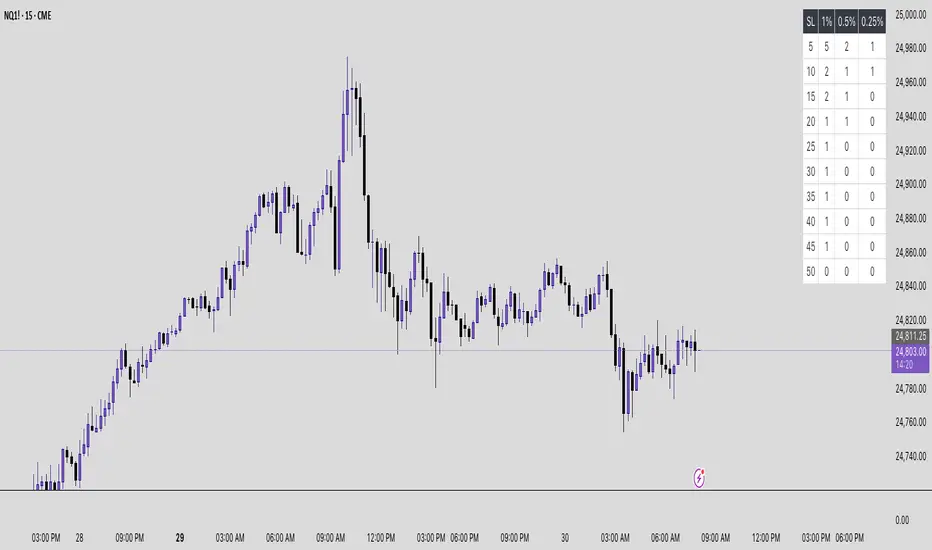
Futures Risk to Reward CalculatorFutures Risk to Reward Calculator with NQ, MNQ, ES, MES, etc price per tick built in.
Futures Risk Contract TableFutures risk table for NQ MNQ YM MYM ES and MES
changeable capital and risk percentage along with points.
FuturesVsSpotShows the difference between Futures and Spot.
- Credits go to Josh Olszewicz / someone in whaleclub ts


Futures Beta Overview with Different BenchmarksBeta Trading and Its Implementation with Futures
Understanding Beta
Beta is a measure of a security's volatility in relation to the overall market. It represents the sensitivity of the asset's returns to movements in the market, typically benchmarked against an index like the S&P 500. A beta of 1 indicates that the asset moves in line with the market, while a beta greater than 1 suggests higher volatility and potential risk, and a beta less than 1 indicates lower volatility.
The Beta Trading Strategy
Beta trading involves creating positions that exploit the discrepancies between the theoretical (or expected) beta of an asset and its actual market performance. The strategy often includes:
Long Positions on High Beta Assets: Investors might take long positions in assets with high beta when they expect market conditions to improve, as these assets have the potential to generate higher returns.
Short Positions on Low Beta Assets: Conversely, shorting low beta assets can be a strategy when the market is expected to decline, as these assets tend to perform better in down markets compared to high beta assets.
Betting Against (Bad) Beta
The paper "Betting Against Beta" by Frazzini and Pedersen (2014) provides insights into a trading strategy that involves betting against high beta stocks in favor of low beta stocks. The authors argue that high beta stocks do not provide the expected return premium over time, and that low beta stocks can yield higher risk-adjusted returns.
Key Points from the Paper:
Risk Premium: The authors assert that investors irrationally demand a higher risk premium for holding high beta stocks, leading to an overpricing of these assets. Conversely, low beta stocks are often undervalued.
Empirical Evidence: The paper presents empirical evidence showing that portfolios of low beta stocks outperform portfolios of high beta stocks over long periods. The performance difference is attributed to the irrational behavior of investors who overvalue riskier assets.
Market Conditions: The paper suggests that the underperformance of high beta stocks is particularly pronounced during market downturns, making low beta stocks a more attractive investment during volatile periods.
Implementation of the Strategy with Futures
Futures contracts can be used to implement the betting against beta strategy due to their ability to provide leveraged exposure to various asset classes. Here’s how the strategy can be executed using futures:
Identify High and Low Beta Futures: The first step involves identifying futures contracts that have high beta characteristics (more sensitive to market movements) and those with low beta characteristics (less sensitive). For example, commodity futures like crude oil or agricultural products might exhibit high beta due to their price volatility, while Treasury bond futures might show lower beta.
Construct a Portfolio: Investors can construct a portfolio that goes long on low beta futures and short on high beta futures. This can involve trading contracts on stock indices for high beta stocks and bonds for low beta exposures.
Leverage and Risk Management: Futures allow for leverage, which means that a small movement in the underlying asset can lead to significant gains or losses. Proper risk management is essential, using stop-loss orders and position sizing to mitigate the inherent risks associated with leveraged trading.
Adjusting Positions: The positions may need to be adjusted based on market conditions and the ongoing performance of the futures contracts. Continuous monitoring and rebalancing of the portfolio are essential to maintain the desired risk profile.
Performance Evaluation: Finally, investors should regularly evaluate the performance of the portfolio to ensure it aligns with the expected outcomes of the betting against beta strategy. Metrics like the Sharpe ratio can be used to assess the risk-adjusted returns of the portfolio.
Conclusion
Beta trading, particularly the strategy of betting against high beta assets, presents a compelling approach to capitalizing on market inefficiencies. The research by Frazzini and Pedersen emphasizes the benefits of focusing on low beta assets, which can yield more favorable risk-adjusted returns over time. When implemented using futures, this strategy can provide a flexible and efficient means to execute trades while managing risks effectively.
References
Frazzini, A., & Pedersen, L. H. (2014). Betting against beta. Journal of Financial Economics, 111(1), 1-25.
Fama, E. F., & French, K. R. (1992). The cross-section of expected stock returns. Journal of Finance, 47(2), 427-465.
Black, F. (1972). Capital Market Equilibrium with Restricted Borrowing. Journal of Business, 45(3), 444-454.
Ang, A., & Chen, J. (2010). Asymmetric volatility: Evidence from the stock and bond markets. Journal of Financial Economics, 99(1), 60-80.
By utilizing the insights from academic literature and implementing a disciplined trading strategy, investors can effectively navigate the complexities of beta trading in the futures market.

Futures Confluence Delta (FCD) - Histogram
The Futures Confluence Delta (FCD) Histogram is a powerful trend-following indicator tailored for scalping futures on 1-minute charts. Displayed in a bottom panel like RSI or volume, it visualizes cumulative volume delta to identify bullish or bearish market momentum. The histogram turns green for positive delta (buying pressure, suggesting a long trend) and red for negative delta (selling pressure, indicating a short trend), providing quick insight into market direction.
This indicator is ideal for futures traders seeking confluence with other tools, such as VWMA or order block strategies. It uses a simple yet effective delta calculation (buy volume for up candles, sell volume for down candles, smoothed with EMA) to highlight trend strength, making it perfect for fast-paced scalping environments.
Key Features:
Cumulative Delta Histogram: Tracks buying vs. selling pressure, smoothed with an EMA for clarity.
Color-Coded Trend Signals: Green for bullish (long) trends, red for bearish (short) trends.
Customizable Settings: Adjust the delta lookback period and enable/disable daily reset for flexibility.
Optimized for 1-minute charts on futures.
Alert Support: Set alerts for trend changes to stay ahead of market shifts.
How to Use:
Add the indicator to your 1-minute chart. Observe the histogram in the bottom panel:
Green bars (positive delta) suggest a bullish trend, favoring long entries.
Red bars (negative delta) indicate a bearish trend, favoring short entries.
Combine with other indicators (e.g., VWMA, order blocks, or FVGs) for confluence.
Set alerts for trend changes via the FCD Long Trend or FCD Short Trend conditions.
Adjust settings (delta lookback, daily reset) to match your trading style.
Settings:
Delta Lookback Period (default: 14): Controls the EMA smoothing of the delta. Lower values increase sensitivity; higher values smooth trends.
Reset Delta Daily (default: true): Resets cumulative delta at the start of each trading day for futures session alignment.
Long Color (default: green): Color for bullish delta.
Short Color (default: red): Color for bearish delta.
Notes:
Ensure sufficient historical data (500+ bars) for accurate delta calculations.
Test on NQ for higher volatility, as it may show stronger delta signals compared to GC or ES.
Check the Pine Logs pane (“More” > “Pine Logs”) for any NA data issues if the histogram doesn’t display.
Share your feedback or suggestions in the comments!

Futures Correlation VisualizerOVERVIEW
This indicator plots the normalized price changes of commonly traded futures. Visualizing data in this way makes studying and understanding market participation and sentiment easier.
Note:
Only 20 symbols can be plotted. The "request" functions are limited to 40 calls , 1 timeframe counts as a call, and 2 timeframes are used per symbol. Normalized values are derived by dividing the charts timeframe by 1D data. A runtime error will occur when more than 20 symbols are enabled. This limitation is unavoidable.
INPUTS
You can configure:
Colors and color scheme
Symbols to plot (most common futures)
Norm. source (todays open / yesterdays close)
Measurement type (%, ‱, Δ)
Label, zone, and zero options

Futures time zoneMarks the different time zones of futures. The time zones are Globex, Kill zone, Pre market, Post market and lunch time

Futures Trend SignalerWhat this indicator is
Futures Trend Signaler is a compact trend/bias dashboard built for futures (and any liquid symbol) that combines:
EMA trend alignment (EMA9 vs EMA21), and
Micro price positioning versus a higher‑timeframe EMA (e.g., 15s and 1s price relative to the 1m EMA9),
plus crossover markers on the chart to timestamp regime shifts.
It’s designed to answer, in seconds:
“Is the market in a bullish or bearish EMA structure?”
“Are the lower timeframes aligned with the higher timeframe?”
“When was the most recent bull/bear crossover?”
What it shows (table)
The table includes:
1m EMA9 vs EMA21
State: EMA9 > EMA21 / EMA9 < EMA21 / neutral
Bias: Bullish / Bearish / Neutral
“Last cross” context (so you know what the most recent regime shift was)
15s EMA9 vs EMA21
Same state/bias logic as the 1m row
1s EMA9 vs EMA21
Same state/bias logic as the 1m row
15s Price vs 1m EMA9
Shows whether micro price is above or below the 1m EMA9
1s Price vs 1m EMA9
Same, but even more “micro”
This structure gives you a quick “stacked timeframe” view:
1m EMA structure = your baseline regime,
15s/1s EMA structure = your momentum alignment,
15s/1s price vs 1m EMA9 = your immediate pressure/positioning vs the baseline.
What it plots (crossover markers)
For each EMA crossover set (1m, 15s, 1s), the script plots:
Bull cross marker (arrow up)
Bear cross marker (arrow down)
To keep the chart clean:
It keeps only the most recent bull cross and most recent bear cross per tracked timeframe.
When a new bull/bear cross happens, the prior marker of that same type/timeframe is removed.
Markers are differentiated by:
Color and/or a mini label on the marker (e.g., “1m”, “15s”, “1s”), so you can instantly tell which timeframe produced the signal.
Inputs / customization
Typical controls include:
Show/hide table
Table position + text size
Lower‑timeframe selections (so you can change 15s/1s if your symbol or plan doesn’t support seconds data)
Optional marker sizing / visibility settings (if you decide to expose them)
Recommended usage
Use the 1m EMA9/EMA21 as your baseline bias filter.
Use 15s & 1s EMA alignment to confirm momentum is in agreement before entries.
Use 15s/1s price vs 1m EMA9 as a quick “pressure” check (continuation vs mean‑reversion risk).
Use the most recent crossover markers to avoid trading into a fresh regime change without confirmation.
Limitations / notes
Seconds‑based signals require seconds data availability for your symbol/account. If not supported, switch those inputs to a higher LTF (e.g., 1m / 5m).
Because the indicator uses multi‑timeframe data, responsiveness can depend on your current chart timeframe and how often TradingView updates each series.
Disclaimer
This indicator is for educational/informational purposes only and does not constitute trading or investment advice. Futures trading involves substantial risk and can result in significant losses. Always manage risk and follow your plan.

Futures Support & Resistance LevelsMulti-Timeframe Support & Resistance Levels for Futures Trading
Description:
This indicator automatically identifies and displays key support and resistance levels using multiple technical analysis methods. Designed specifically for futures traders (ES, NQ, etc.), it provides a clean, organized view of important price levels.
Key Features:
Multiple Detection Methods: Combines pivot points, daily ranges, and psychological levels
Smart Ranking System: Levels are numbered by strength (1 = strongest)
Clean Visualization: Extended lines across the chart with clear price labels
Confluence Detection: Highlights areas where multiple levels converge
Customizable Display: Adjust colors, line styles, and label sizes
Level Types Identified:
Daily High/Low (current session)
Previous Daily High/Low
Pivot-based Support/Resistance
Psychological Round Numbers
Confluence Zones (multiple levels clustering)
Technical Approach:
The indicator uses a strength-scoring algorithm to rank levels by importance. Daily levels receive the highest weighting (2.0), followed by previous daily levels (1.5), pivot points (1.0), and psychological levels (0.5). This helps traders focus on the most significant levels.
Visual Elements:
Solid lines = Strong levels
Dashed lines = Medium levels
Dotted lines = Weak levels
Optional technical condition markers for educational analysis
Best Used For:
Identifying key intraday levels for futures trading
Finding high-probability reversal zones
Setting logical stop-loss and take-profit levels
Recognizing confluence areas for stronger setups
Note:
This is a technical analysis tool for educational purposes. No indicator can predict future price movements. Always use proper risk management and combine with other forms of analysis.

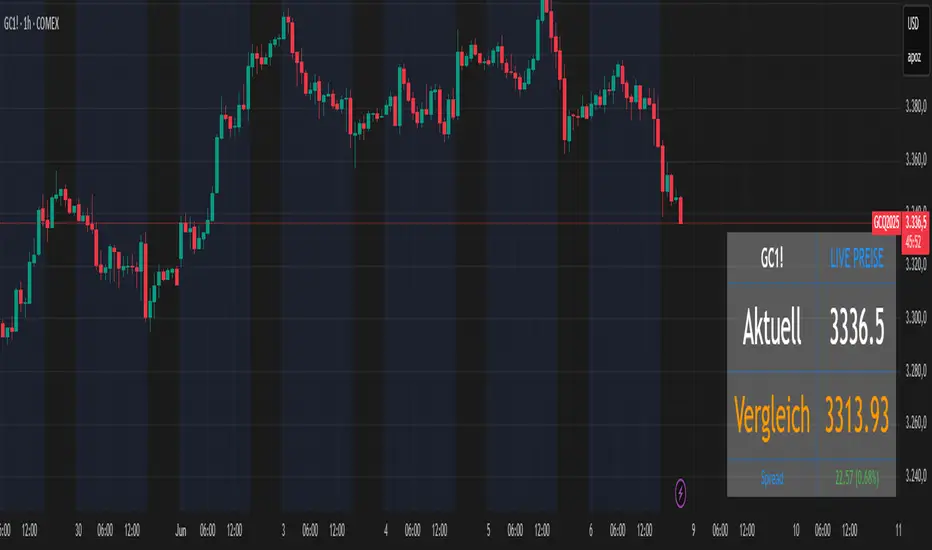
Futures vs CFD Price Display
🎯 Trading the same asset in CFDs and Futures but tired of switching charts to compare prices? This is your indicator!
Stop the constant chart hopping! This live price comparison shows you instantly where the better conditions are.
✨ What you get:
Bidirectional: Works in both Futures AND CFD charts
Live prices: Real-time comparison of both markets
Spread calculation: Automatic difference in points and percentage
Fully customizable: Colors, position, size to your liking
Professional design: Clean display with symbol header
🎯 Perfect for:
Gold traders (Futures vs CFD)
Arbitrage strategies
Spread monitoring
Multi-broker comparisons
⚙️ Customization:
3 sizes (Small/Normal/Large) for all screens
4 positions available
Individual color schemes
Toggle features on/off
💡 Simply enter the symbol and keep both markets in sight!
Notice: "Co-developed with Claude AI (Anthropic) - because even AI needs to pay the server bills! 😄"
Futures Engulfing Candle Size Strategy (Ticks, TP/SL)The Futures Candle Size Strategy is designed to identify and trade significant price movements in the futures market based on candle size. It is optimized for futures instruments like ES, NQ, or CL, where precise tick-level calculations are essential. The strategy includes a customizable take profit and stop loss in ticks and operates only within a specified time window (e.g., 7:00 AM to 9:15 AM CST).
Key Features:
Candle Size Threshold: Trades are triggered when the candle's high-to-low range exceeds the defined threshold in ticks.
Time Filter: Limits trades to the most active market hours, specifically between 7:00 AM and 9:15 AM CST.
Take Profit and Stop Loss: Customizable exit levels in ticks to manage risk and lock in profits.
Long and Short Trades: Automatically places buy or sell orders based on the candle's direction (bullish or bearish).
Alerts: Sends alerts whenever a trade is triggered, helping you stay informed in real-time.
How It Works:
The strategy calculates the size of each candle in ticks and compares it to the user-defined threshold.
If the candle size meets or exceeds the threshold within the specified time range, it triggers a long or short trade.
The trade automatically exits when the price hits the take profit or stop loss levels.

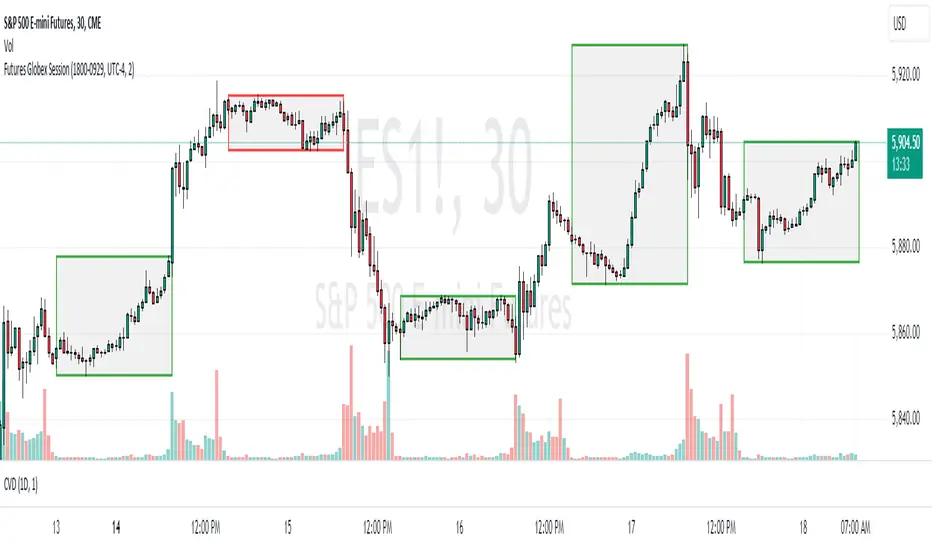
Futures Globex Session(s)This indicator draws a box around the Globex Session for the various Futures markets. The box height defines the highs and lows of that session, and the width defines the timeframe of that session. The boxes are outlined green if price rose during that period, and red if price fell during that period. The default Globex Session is set for the Equity Index Futures and is set in the UTC-4 time zone (Eastern Time). In the settings you can adjust the session time and time zone of your Globex Session to reflect the trading times of that market. Below are the session times for various Futures markets set in time zone UTC-4.
Equity Indexes: 18:00 - 9:30
(ES, NQ, YM, RTY)
Treasuries: 18:00 - 8:20
(ZN, ZB)
Metals: 18:00 - 8:20
(GC)
Energies: 18:00 - 9:00
(CL, NG)
Agricultures: 20:00 - 9:30
(ZS, ZW)