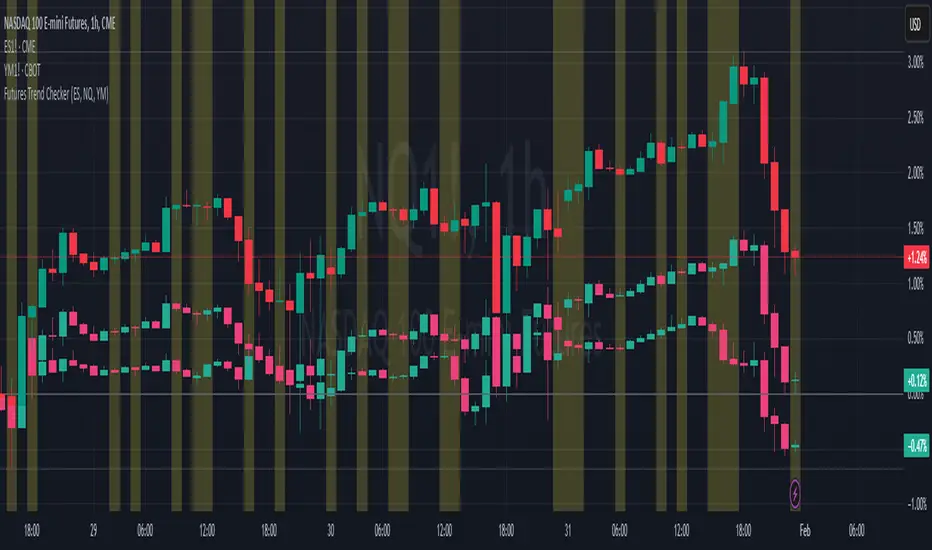
ELHAI Futures Trend Checker (ES, NQ, YM)The ELHAI Futures Trend Checker is a powerful TradingView indicator designed for futures traders who want to monitor the trend synchronization of the three major U.S. futures indices:
✅ E-mini S&P 500 (ES1!)
✅ E-mini Nasdaq 100 (NQ1!)
✅ E-mini Dow Jones (YM1!)
This indicator checks whether all three futures indices are bullish or bearish during each candle formation. If one of them is out of sync (e.g., two indices are bullish while one is bearish), the indicator triggers an alert and highlights the background in red, helping traders identify potential market indecision or divergence.
Key Features
📌 Designed for Futures Traders – Focuses on ES, NQ, and YM futures contracts.
📌 Live Market Monitoring – Works in real-time and updates dynamically with each tick.
📌 Bullish/Bearish Trend Confirmation – Detects when all three indices are in sync.
📌 Mismatch Detection – Alerts you when at least one index is out of trend.
📌 Custom Alerts – Set up TradingView alerts to be notified instantly when a trend mismatch occurs.
📌 Visual Background Highlight – A red background warns of a market divergence.
How It Works
The script retrieves open and close prices for ES, NQ, and YM.
Determines whether each futures index is bullish (close > open) or bearish (close < open).
If all three indices are bullish or all are bearish, it remains neutral.
If one index is different, an alert is triggered and the background turns red.
How to Use
Apply the indicator to your TradingView chart.
Choose any timeframe – Works well on intraday, daily, or higher timeframes.
Enable alerts: Go to Alerts → Create Alert, select "Futures Trend Mismatch", and set your preferred alert frequency.
Use alongside other indicators like moving averages, RSI, or MACD for better trade confirmation.
Best Use Cases
✔ Day traders & scalpers – Quickly spot market divergence in live trading.
✔ Swing traders – Identify when futures markets lose synchronization.
✔ Trend followers – Confirm if all major futures markets are aligned before making a move.
Final Notes
This indicator was built for Elhai to provide real-time trend analysis across major U.S. futures indices. Use it as a confirmation tool to improve market timing and decision-making.
Cerca negli script per "Futures"
whookLibrary "whook"
This library provides functions for generating trading alerts for `whook`
check this -> github.com
Currently supported exchanges:
Kucoin futures
Bitget futures
Coinex futures
Bingx
OKX futures ( also its demo mode )
Bybit futures ( also Bybit testnet )
Binance futures ( also Binance futures testnet )
Phemex futures ( also Phemex testnet )
Kraken futures ( also Kraken futures testnet )
# --- Test Cases ---
Note: These test cases are for demonstration purposes only and may not cover all scenarios.
// buy(string account, float amount, string unit = "units", float leverage = 1)
buy("MyAccount", 100, "units", 1)
buy("MyAccount", 1000, "USDT", 5)
buy("MyAccount", 50, "percent", 2)
// sell(string account, float amount, string unit = "units", float leverage = 1)
sell("MyAccount", 50, "units", 1)
sell("MyAccount", 500, "USDT", 3)
sell("MyAccount", 25, "percent", 2)
// set_position(string account, float amount, string unit = "units", float leverage = 1)
set_position("MyAccount", 100, "units", 1)
set_position("MyAccount", 1000, "USDT", 5)
set_position("MyAccount", 50, "percent", 2)
// limit_buy(string account, float amount, float price, string unit = "units", float leverage = 1, string id = "")
limit_buy("MyAccount", 100, 10000, "units", 1, "MyBuyOrder")
limit_buy("MyAccount", 1000, 10500, "USDT", 5)
limit_buy("MyAccount", 50, 11000, "percent", 2)
// limit_sell(string account, float amount, float price, string unit = "units", float leverage = 1, string id = "")
limit_sell("MyAccount", 50, 10000, "units", 1, "MySellOrder")
limit_sell("MyAccount", 500, 9500, "USDT", 3)
limit_sell("MyAccount", 25, 9000, "percent", 2)
// close_percent(string account, float pct = 100)
close_percent("MyAccount", 100)
close_percent("MyAccount", 50)
buy(account, amount, unit, leverage)
Sends a trading alert to execute a market buy order.
Parameters:
account (string) : The account ID.
amount (float) : The amount to buy (can be in USD, units, or percentage).
unit (string) : The unit of the amount (optional, defaults to "units").
leverage (float) : The leverage to use (optional, defaults to 1x).
sell(account, amount, unit, leverage)
Sends a trading alert to execute a market sell order.
Parameters:
account (string) : The account ID.
amount (float) : The amount to sell (can be in USD, units, or percentage).
unit (string) : The unit of the amount (optional, defaults to "units").
leverage (float) : The leverage to use (optional, defaults to 1x).
set_position(account, amount, unit, leverage)
Sends a trading alert to set a position.
Parameters:
account (string) : The account ID.
amount (float) : The amount to set the position to (can be in USD, units, or percentage).
unit (string) : The unit of the amount (optional, defaults to "units").
leverage (float) : The leverage to use (optional, defaults to 1x).
limit_buy(account, amount, price, unit, leverage, id)
Sends a trading alert to place a limit buy order.
Parameters:
account (string) : The account ID.
amount (float) : The amount to buy (can be in USD, units, or percentage).
price (float) : The limit price.
unit (string) : The unit of the amount (optional, defaults to "units").
leverage (float) : The leverage to use (optional, defaults to 1x).
id (string) : An optional custom ID for the limit order.
limit_sell(account, amount, price, unit, leverage, id)
Sends a trading alert to place a limit sell order.
Parameters:
account (string) : The account ID.
amount (float) : The amount to sell (can be in USD, units, or percentage).
price (float) : The limit price.
unit (string) : The unit of the amount (optional, defaults to "units").
leverage (float) : The leverage to use (optional, defaults to 1x).
id (string) : An optional custom ID for the limit order.
close_percent(account, pct)
Sends an alert to close a position on Phemex.
Parameters:
account (string) : The account ID.
pct (float) : The percentage of the position to close (optional, defaults to 100%).
Annualized Spot-Future DifferenceThe "Annualized Spot-Future Difference" indicator (ASFD) compares the closing prices of a futures contract and its underlying spot asset. It calculates the price difference between the two instruments and annualizes this difference to provide a standardized measure for comparison.
The indicator takes inputs for the futures ticker symbol and the spot ticker symbol, allowing flexibility in selecting the specific assets for analysis. Additionally, it allows the user to input the contract date, which represents the expiration date of the futures contract.
The ASFD indicator plots the annualized difference between the futures and spot prices. It calculates the price difference by subtracting the spot price from the futures price. To annualize this difference, it considers the remaining days to the contract expiration and scales the difference accordingly.
The annualized difference can provide insights into market expectations, as it reflects the market's perception of the future price movement of the underlying asset. A positive value indicates that the futures price is higher than the spot price, potentially suggesting bullish sentiment. Conversely, a negative value suggests bearish sentiment, with the futures price lower than the spot price.
Traders and analysts can utilize the ASFD indicator to identify potential opportunities for arbitrage or evaluate market sentiment regarding the underlying asset. By monitoring changes in the annualized difference over time, they can gain insights into market dynamics and make informed trading decisions.
It's important to note that the ASFD indicator relies on accurate and up-to-date pricing data for both the futures and spot assets. Traders should verify that the selected ticker symbols correspond to the desired instruments and ensure that the contract date aligns with the relevant futures contract expiration.
Overall, the ASFD indicator provides a quantitative measure of the annualized price difference between futures and spot assets, enabling traders and analysts to assess market expectations and identify potential trading opportunities.

ATR Risk Display - Multi FuturesWhat This Does
I got tired of manually calculating my ATR stops and risk for different futures contracts, especially when switching between ES, NQ, and their micro versions. This indicator automatically detects what futures symbol you're trading and shows you the exact tick count and dollar risk for your stop loss.
The Problem It Solves
If you trade futures with ATR-based stops, you know the hassle:
Different contracts have different tick values
You need to calculate position risk in dollars
Switching between symbols means redoing all the math
Renko charts make it even more confusing since ATR needs to come from regular candles
This handles all of that automatically.
Key Features
Auto-detects futures symbols - ES, NQ, YM, RTY, GC, CL, and all the micros (MES, MNQ, etc.)
Shows everything you need in one line: ATR(timeframe) × multiplier = X ticks ($XXX)
Works on Renko charts - pulls ATR from regular timeframe charts (super important if you use Renko)
Adjustable position sizing - set your contract count and see total risk instantly
Clean, minimal display - just the info you need, no clutter
How to Use
Add it to any futures chart
Set your preferred ATR timeframe (I use 5-minute)
Set your ATR multiplier (I use 1.5x for my stops)
Set your contract size
That's it - the indicator handles the rest
The display will show something like: "ES ATR(5) × 1.5 = 12 ticks ($150)"
Settings Explained
ATR Timeframe: What timeframe to calculate ATR from (always uses regular candles, even on Renko)
ATR Multiplier: How many ATRs for your stop (1.5 is common, 2.0 for wider stops)
Number of Contracts: Your position size for risk calculation
Auto-Detect Symbol: Leave on unless you want to manually override
Supported Futures
Full size: ES, NQ, YM, RTY, GC, CL, ZB, ZN, 6E, 6J
Micros: MES, MNQ, MYM, M2K, MGC, MCL
Notes
Made this primarily for my own ES trading but figured others might find it useful
The tick values are based on standard CME specs
If you trade other futures, you can modify the code to add them
Works great alongside level indicators for risk management
Why This Exists
I use ATR trailing stops on all my trades and got tired of doing mental math every time I switched between charts or contracts. Especially useful if you trade both full-size and micro contracts - the risk difference is huge and easy to mess up.
Hope this helps your trading! Feel free to suggest improvements.

EMA Cross + RSI + ADX - Autotrade Strategy V2Overview
A versatile trend-following strategy combining EMA 9/21 crossovers with RSI momentum filtering and optional ADX trend strength confirmation. Designed for both cryptocurrency and traditional futures/options markets with built-in stop loss management and automated position reversals.
Key Features
Multi-Market Compatibility: Works on both crypto futures (Bitcoin, Ethereum) and traditional markets (NIFTY, Bank NIFTY, S&P 500 futures, equity options)
Triple Confirmation System: EMA crossover + RSI filter + ADX strength (optional)
Automated Risk Management: 2% stop loss with wick-touch detection
Position Auto-Reversal: Opposite signals automatically close and reverse positions
Webhook Ready: Six distinct alert messages for automation (Entry Buy/Sell, Close Long/Short, SL Hit Long/Short)
Performance Metrics
NIFTY Futures (15min): 50%+ win rate with ADX filter OFF
Crypto Markets: Requires extensive backtesting before live deployment
Optimal Timeframes: 15-minute to 1-hour charts (patience required for higher timeframes)
Strategy Logic
Entry Signals:
LONG: EMA 9 crosses above EMA 21 + RSI > 55 + ADX > 20 (if enabled)
SHORT: EMA 9 crosses below EMA 21 + RSI < 45 + ADX > 20 (if enabled)
Exit Signals:
Opposite EMA crossover (auto-closes current position)
Stop loss hit at 2% from entry price (tracks candle wicks)
Technical Indicators:
Fast EMA: 9-period (short-term trend)
Slow EMA: 21-period (primary trend)
RSI: 14-period with 55/45 thresholds (momentum confirmation)
ADX: 14-period with 20 threshold (trend strength filter - optional)
Market-Specific Settings
Traditional Markets (NIFTY, Bank NIFTY, S&P Futures, Options)
Recommended Settings:
ADX Filter: Turn OFF (less choppy, cleaner trends)
Timeframe: 15-minute chart
Win Rate: 50%+ on NIFTY Futures
Why No ADX: Traditional markets have more institutional participation and smoother price action, making ADX unnecessary
Cryptocurrency Markets (BTC, ETH, Altcoins)
Recommended Settings:
ADX Filter: Turn ON (ADX > 20)
Timeframe: 15-minute to 1-hour
Extensive backtesting required before live trading
Why ADX: Crypto markets are highly volatile and prone to false breakouts; ADX filters low-quality chop
Best Practices
✅ Backtest thoroughly on your specific instrument and timeframe
✅ Use larger timeframes (1H, 4H) for higher quality signals and better risk/reward
✅ Adjust RSI thresholds based on market volatility (try 52/48 for more signals, 60/40 for fewer but stronger)
✅ Monitor ADX effectiveness - disable for traditional markets, enable for crypto
✅ Proper position sizing - adjust default_qty_value based on your capital and instrument price
✅ Paper trade first - test for 2-4 weeks before risking real capital
Risk Management
Fixed 2% stop loss per trade (adjustable)
Stop loss tracks candle wicks for accurate execution
Positions auto-reverse on opposite signals (no manual intervention needed)
0.075% commission built into backtest (adjust for your broker)
Customization Options
All parameters are adjustable via inputs:
EMA periods (default: 9/21)
RSI length and thresholds (default: 14-period, 55/45 levels)
ADX length and threshold (default: 14-period, 20 threshold)
Stop loss percentage (default: 2%)
Webhook Automation
This strategy includes six distinct alert messages for automated trading:
"Entry Buy" - Long position opened
"Entry Sell" - Short position opened
"Close Long" - Long position closed on opposite crossover
"Close Short" - Short position closed on opposite crossover
"SL Hit Long" - Long stop loss triggered
"SL Hit Short" - Short stop loss triggered
Compatible with Delta Exchange, Binance Futures, 3Commas, Alertatron, and other webhook platforms.
Important Notes
⚠️ Crypto markets require extensive backtesting - volatility patterns differ significantly from traditional markets
⚠️ Higher timeframes = better results - 15min works but 1H/4H provide cleaner signals
⚠️ ADX toggle is critical - OFF for traditional markets, ON for crypto
⚠️ Not financial advice - always conduct your own research and use proper risk management
⚠️ Past performance ≠ future results - backtest results may not reflect live trading conditions
Disclaimer
This strategy is for educational and informational purposes only. Trading futures and options involves substantial risk of loss. Always backtest thoroughly, start with paper trading, and never risk more than you can afford to lose. The author assumes no responsibility for any trading losses incurred using this strategy.

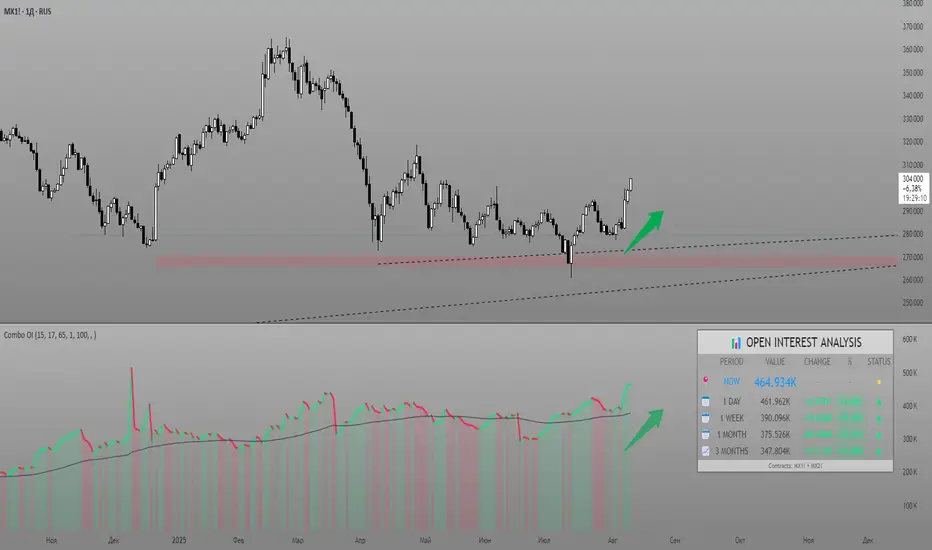
Combined Futures Open Interest [Sam SDF-Solutions]The Combined Futures Open Interest indicator is designed to provide comprehensive analysis of market positioning by aggregating open interest data from the two nearest futures contracts. This dual-contract approach captures the complete picture of market participation, including rollover dynamics between front and back month contracts, offering traders crucial insights into institutional positioning and market sentiment.
Key Features:
Dual-Contract Aggregation: Automatically identifies and combines open interest from the first and second nearest futures contracts (e.g., ES1! + ES2!), providing a complete view of market positioning that single-contract analysis might miss.
Multi-Period Analysis: Tracks open interest changes across multiple timeframes:
1 Day: Immediate market sentiment shifts
1 Week: Short-term positioning trends
1 Month: Medium-term institutional flows
3 Months: Quarterly positioning aligned with contract expiration cycles
Smart Data Handling: Utilizes last known values when data is temporarily unavailable, preventing false signals from data gaps while clearly indicating when stale data is being used.
EMA Smoothing: Incorporates a customizable Exponential Moving Average (default 65 periods) to identify the underlying trend in open interest, filtering out daily noise and highlighting significant deviations.
Dynamic Visualization:
Color-coded main line showing directional changes (green for increases, red for decreases)
Optional fill areas between OI and EMA to visualize momentum
Separate contract lines for detailed rollover analysis
Customizable labels for significant percentage changes
Comprehensive Information Table: Displays real-time statistics including:
Current total open interest across both contracts
Period-over-period changes in absolute and percentage terms
EMA deviation metrics
Visual status indicators for quick assessment
Contract symbols and data quality warnings
Alert System: Configurable alerts for:
Significant daily changes (customizable threshold)
EMA crossovers indicating trend changes
Large percentage movements suggesting institutional activity
How It Works:
Contract Detection: The indicator automatically identifies the base futures symbol and constructs the appropriate contract codes for the two nearest expirations, or accepts manual symbol input for non-standard contracts.
Data Aggregation: Open interest data from both contracts is retrieved and summed, providing a complete picture that accounts for positions rolling between contracts.
Historical Comparison: The indicator calculates changes from multiple lookback periods (1/5/22/66 days) to show how positioning has evolved across different time horizons.
Trend Analysis: The EMA overlay helps identify whether current open interest is above or below its smoothed average, indicating momentum in position building or reduction.
Visual Feedback: The main line changes color based on daily changes, while the optional table provides detailed numerical analysis for traders requiring precise data.
___________________
This indicator is essential for futures traders, particularly those focused on index futures, commodities, or currency futures where understanding the aggregate positioning across nearby contracts is crucial. It's especially valuable during rollover periods when positions shift between contracts, and for identifying institutional accumulation or distribution patterns that single-contract analysis might miss. By combining multiple timeframe analysis with intelligent data handling and clear visualization, it simplifies the complex task of monitoring open interest dynamics across the futures curve.
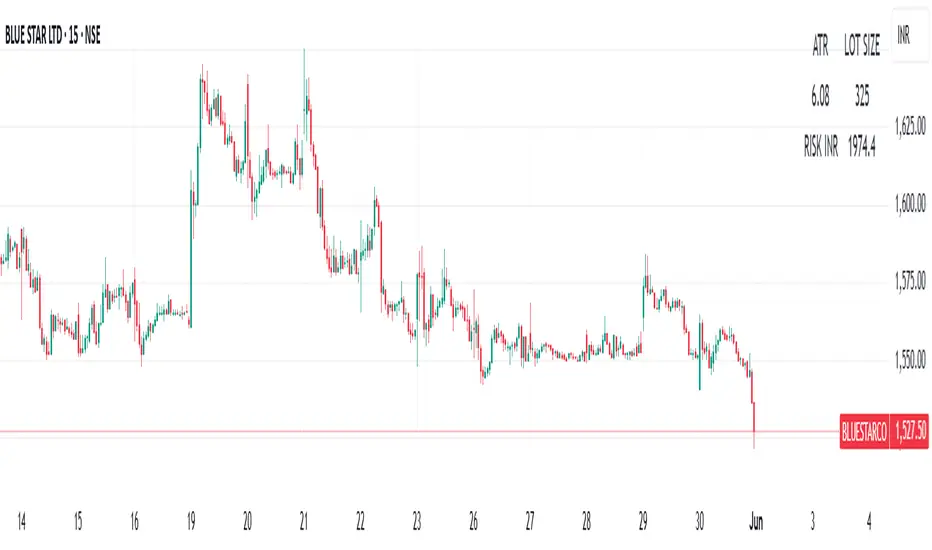
ATR | LOTSIZE | Risk (Futures)This Pine Script is a futures-specific trading utility designed to help F\&O (Futures and Options) traders quickly assess the volatility and position sizing for any selected stock on the chart — even if it's not a futures chart.
What the Script Does:
* Automatically detects the futures symbol for the underlying equity using a dynamic mapping system.
* Calculates the ATR (Average True Range) of the futures contract using either SMA or EMA.
* Fetches the Lot Size (Point Value) of the futures instrument.
* Computes risk per lot by multiplying ATR with lot size (Risk = ATR × Lot Size).
* Displays all 3 values — ATR, Lot Size, and Risk in INR — in a compact table on the chart.
Why This Is Useful for F\&O Traders:
* ✅ Quick Risk Assessment: Helps traders understand how much is at risk per lot without switching to the actual futures chart.
* ✅ Position Sizing: Provides data to calculate how many lots to trade based on a defined risk per trade.
* ✅ Volatility Awareness:ATR gives insights into how much the stock typically moves, guiding stop-loss and target placements.
* ✅ Efficient Workflow:No need to load separate futures charts or lookup lot sizes manually — saves time and reduces error.
This tool is ideal for discretionary and systematic traders who want risk and volatility context for every trade, especially in the NSE Futures & Options segment.
UM Futures Dashboard with Moving Average DirectionUM Futures Dashboard with Moving Average Direction
Description :
This futures dashboard gives you quick glance of all “major” futures prices and percentage changes. The text color and trends are based on your configured moving average type and length. The dashboard will display LONG in green text when the configure MA is trending higher and SHORT in red when the configured MA is trending lower. The dashboard also includes the VIX futures roll yield and VIX futures status of Contango or Backwardation.
I have included the indicator twice on the sample chart to illustrate different table settings. I also included an 8 period WMA overlay on the price chart since this is the default of the dashboard. (The Moving Average color change is another one of my indicators titled “UM EMA SMA WMA HMA with Directional Color Change”)
Defaults and Configuration :
The default MA type is the Weighted Moving Average, (WMA) with a daily setting of 8. Choices include WMA, SMA, and EMA. The table location defaults to the upper right corner in landscape mode. It can also be set to “flip” to portrait mode. I have added the table to the chart twice to illustrate the table orientations.
Table location, orientation, timeframe, moving average type and length are user-configurable. The configured dashboard timeframe is independent of the chart timeframe. Percentage changes and Moving Averages are based on the configured dashboard timeframe.
Alerts :
Alerts can be configured on the directional change of the dashboard moving average. For example, if the daily 8 period weighted moving average begins trending higher it will turn from red to green. This color change would fire a LONG alert. A color trend change of the weighted moving average from green to red would fire a SHORT alert. Alerts are disabled by default but can be set for any or all of the futures contracts included.
Suggested Uses :
If you follow or trade futures, add this dashboard indicator to your chart layout. Configure your favorite moving average. Use this to quickly see where all the major futures are trading. This saved me from thumbing through the CNBC app on my phone.
One thing I do is to “stretch” moving average to a smaller timeframe. For example, if you like the 8 period WMA on the daily, try the 192 WMA on the hourly. ( The daily 8 period WMA is roughly a 192 WMA on an hourly chart) This can smooth out some of the violent price action and give better entries/exits.
Setup a FUTURES indicator template. I do this with the dashboard and couple other of my favorite indicators.
Suggested Settings :
Daily charts: 8 WMA

Arbitrage Spot-Futures Don++Strategy: Spot-Futures Arbitrage Don++
This strategy has been designed to detect and exploit arbitrage opportunities between the Spot and Futures markets of the same trading pair (e.g. BTC/USDT). The aim is to take advantage of price differences (spreads) between the two markets, while minimizing risk through dynamic position management.
[Operating principle
The strategy is based on calculating the spread between Spot and Futures prices. When this spread exceeds a certain threshold (positive or negative), reverse positions are opened simultaneously on both markets:
- i] Long Spot + Short Futures when the spread is positive.
- i] Short Spot + Long Futures when the spread is negative.
Positions are closed when the spread returns to a value close to zero or after a user-defined maximum duration.
[Strategy strengths
1. Adaptive thresholds :
- Entry/exit thresholds can be dynamic (based on moving averages and standard deviations) or fixed, offering greater flexibility to adapt to market conditions.
2. Robust data management :
- The script checks the validity of data before executing calculations, thus avoiding errors linked to missing or invalid data.
3. Risk limitation :
- A position size based on a percentage of available capital (default 10%) limits exposure.
- A time filter limits the maximum duration of positions to avoid losses due to persistent spreads.
4. Clear visualization :
- Charts include horizontal lines for entry/exit thresholds, as well as visual indicators for spread and Spot/Futures prices.
5. Alerts and logs :
- Alerts are triggered on entries and exits to inform the user in real time.
[Points for improvement or completion
Although this strategy is functional and robust, it still has a few limitations that could be addressed in future versions:
1. [Limited historical data :
- TradingView does not retrieve real-time data for multiple symbols simultaneously. This can limit the accuracy of calculations, especially under conditions of high volatility.
2. [Lack of liquidity management :
- The script does not take into account the volumes available on the order books. In conditions of low liquidity, it may be difficult to execute orders at the desired prices.
3. [Non-dynamic transaction costs :
- Transaction costs (exchange fees, slippage) are set manually. A dynamic integration of these costs via an external API would be more realistic.
4. User-dependency for symbols :
- Users must manually specify Spot and Futures symbols. Automatic symbol validation would be useful to avoid configuration errors.
5. Lack of advanced backtesting :
- Backtesting is based solely on historical data available on TradingView. An implementation with third-party data (via an API) would enable the strategy to be tested under more realistic conditions.
6. [Parameter optimization :
- Certain parameters (such as analysis period or spread thresholds) could be optimized for each specific trading pair.
[How can I contribute?
If you'd like to help improve this strategy, here are a few ideas:
1. Add additional filters:
- For example, a filter based on volume or volatility to avoid false signals.
2. Integrate dynamic costs:
- Use an external API to retrieve actual costs and adjust thresholds accordingly.
3. Improve position management:
- Implement hedging or scalping mechanisms to maximize profits.
4. Test on other pairs:
- Evaluate the strategy's performance on other assets (ETH, SOL, etc.) and adjust parameters accordingly.
5. Publish backtesting results :
- Share detailed analyses of the strategy's performance under different market conditions.
[Conclusion
This Spot-Futures arbitrage strategy is a powerful tool for exploiting price differentials between markets. Although it is already functional, it can still be improved to meet more complex trading scenarios. Feel free to test, modify and share your ideas to make this strategy even more effective!
[Thank you for contributing to this open-source community!
If you have any questions or suggestions, please feel free to comment or contact me directly.

US Futures Momentum OverviewThe "US Futures Momentum Overview" indicator is designed to provide a comprehensive view of momentum across various U.S. futures markets. It calculates the Rate of Change (ROC) for multiple futures contracts and displays them as lines on a chart. Each futures market is plotted with a unique color for easy differentiation, allowing traders to quickly assess the momentum in different markets.
Features:
ROC Calculation: Measures the percentage change in price over a specified period, indicating the rate of change in momentum.
Futures Markets Covered: Includes major U.S. indices, commodities, and agricultural products.
How to Use:
Momentum Analysis: Observe the ROC lines for each futures market. A positive ROC indicates increasing momentum, while a negative ROC suggests decreasing momentum.
Trend Identification: Use the ROC values to identify strong trends in different markets. Markets with higher positive ROC values show stronger upward momentum.
Comparison: Compare momentum across various futures markets to identify which ones are showing stronger trends and might offer better trading opportunities.

Bitcoin Futures vs. Spot Tri-Frame - Strategy [presentTrading]Prove idea with a backtest is always true for trading.
I developed and open-sourced it as an educational material for crypto traders to understand that the futures and spot spread may be effective but not be as effective as they might think. It serves as an indicator of sentiment rather than a reliable predictor of market trends over certain periods. It is better suited for specific trading environments, which require further research.
█ Introduction and How it is Different
The "Bitcoin Futures vs. Spot Tri-Frame Strategy" utilizes three different timeframes to calculate the Z-Score of the spread between BTC futures and spot prices on Binance and OKX exchanges. The strategy executes long or short trades based on composite Z-Score conditions across the three timeframes.
The spread refers to the difference in price between BTC futures and BTC spot prices, calculated by taking a weighted average of futures prices from multiple exchanges (Binance and OKX) and subtracting a weighted average of spot prices from the same exchanges.
BTCUSD 1D L/S Performance
█ Strategy, How It Works: Detailed Explanation
🔶 Calculation of the Spread
The spread is the difference in price between BTC futures and BTC spot prices. The strategy calculates the spread by taking a weighted average of futures prices from multiple exchanges (Binance and OKX) and subtracting a weighted average of spot prices from the same exchanges. This spread serves as the primary metric for identifying trading opportunities.
Spread = Weighted Average Futures Price - Weighted Average Spot Price
🔶 Z-Score Calculation
The Z-Score measures how many standard deviations the current spread is from its historical mean. This is calculated for each timeframe as follows:
Spread Mean_tf = SMA(Spread_tf, longTermSMA)
Spread StdDev_tf = STDEV(Spread_tf, longTermSMA)
Z-Score_tf = (Spread_tf - Spread Mean_tf) / Spread StdDev_tf
Local performance
🔶 Composite Entry Conditions
The strategy triggers long and short entries based on composite Z-Score conditions across all three timeframes:
- Long Condition: All three Z-Scores must be greater than the long entry threshold.
Long Condition = (Z-Score_tf1 > zScoreLongEntryThreshold) and (Z-Score_tf2 > zScoreLongEntryThreshold) and (Z-Score_tf3 > zScoreLongEntryThreshold)
- Short Condition: All three Z-Scores must be less than the short entry threshold.
Short Condition = (Z-Score_tf1 < zScoreShortEntryThreshold) and (Z-Score_tf2 < zScoreShortEntryThreshold) and (Z-Score_tf3 < zScoreShortEntryThreshold)
█ Trade Direction
The strategy allows the user to specify the trading direction:
- Long: Only long trades are executed.
- Short: Only short trades are executed.
- Both: Both long and short trades are executed based on the Z-Score conditions.
█ Usage
The strategy can be applied to BTC or Crypto trading on major exchanges like Binance and OKX. By leveraging discrepancies between futures and spot prices, traders can exploit market inefficiencies. This strategy is suitable for traders who prefer a statistical approach and want to diversify their timeframes to validate signals.
█ Default Settings
- Input TF 1 (60 minutes): Sets the first timeframe for Z-Score calculation.
- Input TF 2 (120 minutes): Sets the second timeframe for Z-Score calculation.
- Input TF 3 (180 minutes): Sets the third timeframe for Z-Score calculation.
- Long Entry Z-Score Threshold (3): Defines the threshold above which a long trade is triggered.
- Short Entry Z-Score Threshold (-3): Defines the threshold below which a short trade is triggered.
- Long-Term SMA Period (100): The period used to calculate the simple moving average for the spread.
- Use Hold Days (true): Enables holding trades for a specified number of days.
- Hold Days (5): Number of days to hold the trade before exiting.
- TPSL Condition (None): Defines the conditions for taking profit and stop loss.
- Take Profit (%) (30.0): The percentage at which the trade will take profit.
- Stop Loss (%) (20.0): The percentage at which the trade will stop loss.
By fine-tuning these settings, traders can optimize the strategy to suit their risk tolerance and trading style, enhancing overall performance.

VIX Futures Spread StrategyThis script was an exercise in learning Pinescript and exploring the futures curve of the VIX in relation to SPY. Was deleted by TV, trying to republish it now with updated parameters for slippage and commission and a more detailed description.
"VIX Futures Spread Strategy" is a trading strategy that capitalizes on the spread between the 3-month VIX futures (VIX3M) and the spot VIX index. This strategy is based on the idea that the VIX futures spread can serve as a contrarian indicator of market sentiment, with extreme negative spreads potentially signaling oversold conditions and opportunities for long positions.
Ordinarily the VIX curve is in contango as futures contracts are priced at a premium to the current spot price and are used to hedge future uncertainty in the market. When the spot price of VIX spikes the curve can invert and enter backwardation; this strategy detects this condition and uses it as a trigger to open a long position in SPY. The spread going negative tends to correlate with excessive fear and uncertainty in the short term while expecting lower volatility in the long term, in this case 3 months out.
The strategy is designed to enter a long position when the VIX futures spread is negative and to exit the position when the spread rises above 3 -- when the curve is in contango again. The strategy employs a pyramiding approach, allowing up to 10 additional orders to be placed while the entry condition is met, with each order consisting of 10 contracts. This approach aims to maximize potential profits during periods of favorable market conditions.
In this strategy, the VIX futures spread is calculated as the difference between the 3-month VIX futures (VIX3M) and the spot VIX index. The spread is plotted as a histogram on the chart, with the zero line representing no spread, and horizontal lines at 0 and 3 indicating the entry and exit thresholds, respectively.
The strategy's backtesting settings use an initial capital of HKEX:10 ,000, a commission of 0.5% per trade, and a maximum of 10 pyramiding orders, and a slippage of 2 ticks.
Please note that this strategy is intended for educational purposes and should not be considered as financial advice. Before using this strategy in live trading, make sure to thoroughly test and optimize its parameters to suit your risk tolerance and specific trading conditions.

Weiss Wave Open Interest BarsFirstly :
LazyBear ' s "Weiss Wave " codes are used for open interests.
Original Weiss Wave Volume :
Let's start :
Open Interest vs. Volume: An Overview
Volume and open interest are two key measurements that describe the liquidity and activity of contracts In the options and futures markets. However, their meanings and applications are different. Volume refers to the number of contracts traded in a given period, while open interest denotes the number of active contracts.
Volume
Trading volume measures the number of options or futures contracts being exchanged between buyers and sellers, identifying the level of activity for that particular contract. For every buyer, there is a seller, and the transaction itself counts toward the daily volume.
Open Interest
Open interest indicates the number of options or futures contracts that are held by traders and investors in active positions. These positions have not been closed out, expired, or exercised. Open interest decreases when holders and writers of options (or buyers and sellers of futures) close out their positions. To close out positions, they must take offsetting positions or exercise their options. Open interest increases once again when investors and traders open new long positions or writers/sellers take on new short positions. Open interest also increases when new options or futures contracts are created.
Options or futures contract trading volume can only increase while open interest can either increase or decrease. While trading volume indicates the number of contracts that have been bought or sold, open interest identifies the number of contracts that are currently held.
Reference : www.investopedia.com
*** Worked to define all futures . You can look them in codes (between line : 13 to line 94 )
** CAUTION 1 : Since each instrument in the list has its own unique contract data, you must first enter its name to display it. I recommend you to select OANDA from the markets. Finally, when the COT reports are issued, it may repaints. However, this repaint is usually close to closing or after close .(When COT reports are so sharp ) So use this script only 1W ( 1 week ) or 1 M ( 1 month ) timeframe.
** CAUTION 2 : This data is taken to Tradingview with the help of Quandl. This is a tremendous possibility, but the system will not work if there is a malfunction.
Best regards.

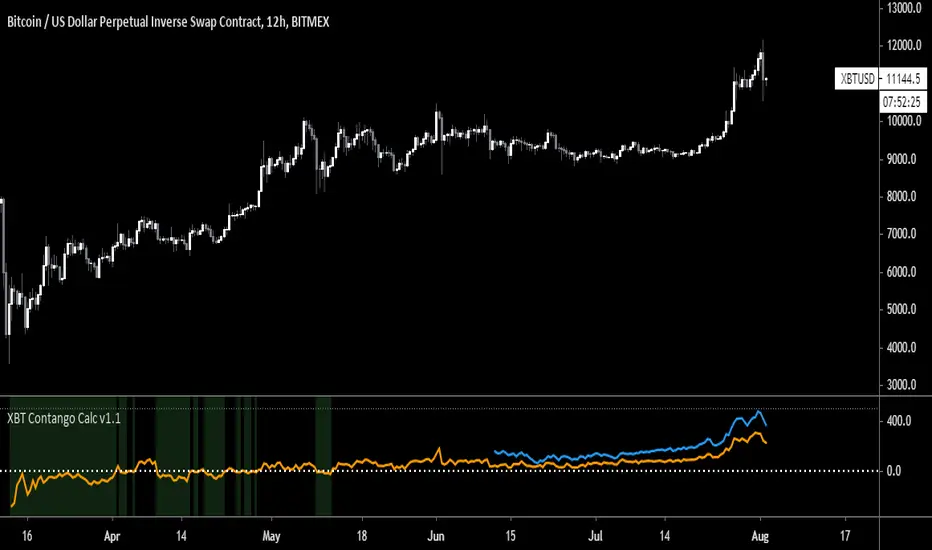
XBT Contango Calculator v1.1
This indicator measures value of basis (or spread) of current Futures contracts compared to spot. The default settings are specifically for Bitmex XBTU19 and XBTZ19 futures contracts. These will need to be updated after expiration. Also, it seems that Tradingview does not keep charts of expired contracts. If anyone knows how to import data from previous expired contracts, please let me know. This historical data could be valuable for evaluating previous XBT futures curves.
Also, VERY important to understand is this indicator only works with Spot Bitcoin charts (XBTUSD, BTCUSD, etc). If you add this to any other asset chart, it would not be useful (unless you changed settings to evaluate a different Futures product).
Contango and Backwardation are important fundamental indicators to keep track of while trading Futures markets. For a better explanation, Ugly Old Goat had done several medium articles on this. Please check out link below for his latest article on the subject...
uglyoldgoat.com
Notes on chart above should explain most of what you need to know on to use this indicator. The zero line is the spot price on the chart, so a positive value means Futures are trading at a premium (or in Contango). You can set a value of extreme Contango which will give an alert as red background (default setting is +$500). Green background will appear when Futures are trading at a discount to spot (Backwardation).
Hope some people get some use out of this. This is my first attempt at coding anything, so any feedback would be greatly appreciated!
BTC Donations: 3CypEdvBcvVHbqzHUt1FDiUG53U7pYWviV
Basic Key Levels | Feng FuturesKey Levels | Feng Futures (Basic) automatically plots the most essential daily reference levels used by futures traders to establish intraday context and structure.
This lightweight version focuses on the three levels that matter most for session bias and liquidity reference:
Previous Day High (PDH)
Previous Day Low (PDL)
Session Open (18:00 NY for futures)
These levels are commonly used by professional and institutional participants as decision points for:
directional bias
continuation vs. reversal context
risk definition and invalidation
Features:
• Auto-plotted PDH and PDL
• Futures session open (18:00 NY)
• Clean, non-repainting levels
• Lines extend forward for intraday use
• Optional price labels pinned to the right edge
• Minimal design to reduce chart clutter
• Full color, width, and label customization
• Optimized for intraday futures trading
This indicator does not provide trade signals or alerts.
It is designed to support planning, execution, and review within your own trading framework.
Best used on:
ES, NQ, RTY, YM (intraday timeframes)
PDH / PDL levels can be used as take profit targets or to help form bias. For example, if we break out of PDH, we may look for longs.
Disclaimer:
This indicator is for educational purposes only and does not constitute financial advice. Trading futures involves significant risk and may not be suitable for all investors. Always do your own research and use proper risk management.

BTC Spread: Coinbase Spot vs CME Futures (skullcap)BTC Spread: Coinbase Spot vs CME Futures
This indicator plots the real-time spread between Coinbase Spot BTC (COINBASE:BTCUSD) and CME Bitcoin Futures (CME:BTC1!).
It allows traders to monitor the premium or discount between spot and futures markets directly in one chart.
⸻
📊 How it Works
• The script pulls Coinbase spot BTC closing prices and CME front-month BTC futures prices on your selected timeframe.
• The spread is calculated as:
Spread = CME Price – Coinbase Spot Price
🔧 How to Use
1. Add the indicator to your chart (set to any timeframe you prefer).
2. The orange line represents the spread (USD difference).
3. The grey dashed line marks the zero level (parity between CME and Coinbase).
4. Use it to:
• Compare futures vs. spot market structure
• Track premium/discount cycles around funding or expiry
• Identify arbitrage opportunities or market dislocations
⸻
⚠️ Notes
• This indicator is informational only and does not provide trading signals.
• Useful for traders analysing derivatives vs spot price action.
• Works best when paired with order flow, funding rate, and open interest data.

Index Futures vs Cash ArbitrageThis indicator measures the statistical spread between major stock index futures and their corresponding cash indices (e.g., ES vs SPX, NQ vs NDX) using Z-score normalization. It automatically detects commonly traded index pairs (S&P 500, Nasdaq, Dow Jones, Russell 2000) and calculates a smoothed spread between futures and spot prices. A Z-score is then derived from this spread to highlight potential overpricing or underpricing conditions.
Traders can use customizable thresholds to identify mean-reversion opportunities where the futures contract may be temporarily overvalued or undervalued relative to the index. The histogram highlights the direction of the Z-score (green = futures > index, red = futures < index), while built-in alerts notify users of key threshold breaches or zero-line crosses.
This tool is designed for discretionary traders, pairs traders, or anyone exploring statistical arbitrage strategies between futures and spot markets. It is not a buy/sell signal by itself and should be used with additional confluence or risk management techniques.

Dskyz Options Flow Flux (OFF) - FuturesDskyz Options Flow Flux (OFF) - Futures
*This is a repost due to moderator intervention on use of ™ in my scripts. I'm in the process of getting this rectified. This was originally posted around mid-night CDT.
🧠 The Dskyz Options Flow Flux (OFF) - Futures indicator is a game changer for futures traders looking to tap into institutional activity with limited resources. Designed for TradingView this tool simulates options flow data (call/put volume and open interest) for futures contracts like MNQ MES NQ and ES giving u actionable insights through volume spike detection volatility adjustments and stunning visuals like aurora flux bands and round number levels. Whether u’re a beginner learning the ropes or a pro hunting for an edge this indicator delivers real time market sentiment and key price levels to boost ur trading game
Key Features
⚡ Simulated Options Flow: Breaks down call/put volume and open interest using market momentum and volatility
📈 Spike Detection: Spots big moves in volume and open interest with customizable thresholds
🧠 Volatility Filter: Adapts to market conditions using ATR for smarter spike detection
✨ Aurora Flux Bands: Glows with market sentiment showing u bullish or bearish vibes at a glance
🎯 Round Number Levels: Marks key psychological levels where big players might step in
📊 Interactive Dashboard: Real time metrics like sentiment score and volatility factor right on ur chart
🚨 Alerts: Get notified of bullish or bearish spikes so u never miss a move
How It Works
🧠 This indicator is built to make complex options flow analysis simple even with the constraints of Pine Script. Here’s the step by step:
Simulated Volume Data (Dynamic Split):
Pulls daily volume for ur chosen futures contract (MNQ1! MES1! NQ1! ES1!)
Splits it into call and put volume based on momentum (ta.mom) and volatility (ATR vs its 20 period average)
Estimates open interest (OI) for calls and puts (1.15x for calls 1.1x for puts)
Formula: callRatio = 0.5 + (momentum / close) * 10 + (volatility - 1) * 0.1 capped between 0.3 and 0.7
Why It Matters: Mimics how big players might split their trades giving u a peek into institutional sentiment
Spike Detection:
Compares current volume/OI to short term (lookbackShort) and long term (lookbackLong) averages
Flags spikes when volume/OI exceeds the average by ur set threshold (spikeThreshold for regular highConfidenceThreshold for strong)
Adjusts for volatility so u’re not fooled by choppy markets
Output: optionsSignal (2 for strong bullish -2 for strong bearish 1 for bullish -1 for bearish 0 for neutral)
Why It Matters: Pinpoints where big money might be stepping in
Volatility Filter:
Uses ATR (10 periods) and its 20 period average to calculate a volatility factor (volFactor = ATR / avgAtr)
Scales spike thresholds based on market conditions (volAdjustedThreshold = spikeThreshold * max(1 volFactor * volFilter))
Why It Matters: Keeps ur signals reliable whether the market is calm or wild
Sentiment Score:
Calculates a call/put ratio (callVolume / putVolume) and adjusts for volatility
Converts it to a 0 to 100 score (higher = bullish lower = bearish)
Formula: sentimentScore = min(max((volAdjustedSentiment - 1) * 50 0) 100)
Why It Matters: Gives u a quick read on market bias
Round Number Detection:
Finds the nearest round number (e.g. 100 for MNQ1! 50 for MES1!)
Checks for volume spikes (volume > 3 period SMA * spikeThreshold) and if price is close (within ATR * atrMultiplier)
Updates the top activity level every 15 minutes when significant activity is detected
Why It Matters: Highlights psychological levels where price often reacts
Visuals and Dashboard:
Combines aurora flux bands glow effects round number lines and a dashboard to make insights pop (see Visual Elements below)
Plots triangles for call/put spikes (green/red for strong lime/orange for regular)
Sets up alerts for key market moves
Why It Matters: Makes complex data easy to read at a glance
Inputs and Customization
⚙️ Beginners can tweak these settings to match their trading style while pros can dig deeper for precision:
Futures Symbol (symbol): Pick ur contract (MNQ1! MES1! NQ1! ES1!). Default: MNQ1!
Short Lookback (lookbackShort): Days for short term averages. Smaller = more sensitive. Range: 1+. Default: 5
Long Lookback (lookbackLong): Days for long term averages. Range: 5+. Default: 10
Spike Threshold (spikeThreshold): How big a spike needs to be (e.g. 1.1 = 10% above average). Range: 1.0+. Default: 1.1
High Confidence Threshold (highConfidenceThreshold): For strong spikes (e.g. 3.0 = 3x average). Range: 2.0+. Default: 3.0
Volatility Filter (volFilter): Adjusts for market volatility (e.g. 1.2 = 20% stricter in volatile markets). Range: 1.0+. Default: 1.2
Aurora Flux Transparency (glowOpacity): Controls band transparency (0 = solid 100 = invisible). Range: 0 to 100. Default: 65
Show Show OFF Dashboard (showDashboard): Toggles the dashboard with key metrics. Default: true
Show Nearest Round Number (showRoundNumbers): Displays round number levels. Default: true
ATR Multiplier for Proximity (atrMultiplier): How close price needs to be to a round number (e.g. 1.5 = within 1.5x ATR). Range: 0.5+. Default: 1.5
Functions and Logic
🧠 Here’s the techy stuff pros will love:
Simulated Volume Data : Splits daily volume into call/put volume and OI using momentum and volatility
Volatility Filter: Scales thresholds with volFactor = atr / avgAtr for adaptive detection
Spike Detection: Flags spikes and assigns optionsSignal (2, -2, 1, -1, 0) for sentiment
Sentiment Score: Converts call/put ratio into a 0-100 score for quick bias reads
Round Number Detection: Identifies key levels and significant activity for trading zones
Dashboard Display: Updates real time metrics like sentiment score and volatility factor
Visual Elements
✨ These visuals make data come alive:
Gradient Background: Green (bullish) red (bearish) or yellow (neutral/choppy) at 95% transparency to show trend
Aurora Flux Bands: Stepped bands (linewidth 3) around a 14 period EMA ± ATR * 1.8. Colors shift with sentiment (green red lime orange gray) with glow effects at 85% transparency
Round Number Visualization: Stepped lines (linewidth 2) at key levels (solid if active dashed if not) with labels (black background white text size.normal)
Visual Signals: Triangles above/below bars for spikes (size.small for strong size.tiny for regular)
Dashboard: Bottom left table (2 columns 10 rows) with a black background (29% transparency) gray border and metrics:
⚡ Round Number Activity: “Detected” or “None”
📈 Trend: “Bullish” “Bearish” or “Neutral” (colored green/red/gray)
🧠 ATR: Current 10 period ATR
📊 ATR Avg: 20 period SMA of ATR
📉 Volume Spike: “YES” (green) or “NO” (red)
📋 Call/Put Ratio: Current ratio
✨ Flux Signal: “Strong Bullish” “Strong Bearish” “Bullish” “Bearish” or “Neutral” (colored green/red/gray)
⚙️ Volatility Factor: Current volFactor
📈 Sentiment Score: 0-100 score
Usage and Strategy Recommendations
🎯 For Beginners: Use high confidence spikes (green/red triangles) for easy entries. Check the dashboard for a quick market read (sentiment score above 60 = bullish below 40 = bearish). Watch round number levels for support/resistance
💡 For Pros: Combine flux signals with round number activity for high probability setups. Adjust lookbackShort/lookbackLong for trending vs choppy markets. Use volFactor for position sizing (higher = smaller positions)

Dskyz Adaptive Futures Elite (DAFE)Dskyz Adaptive Futures Edge (DAFE)
imgur.com
A Dynamic Futures Trading Strategy
DAFE adapts to market volatility and price action using technical indicators and advanced risk management. It’s built for high-stakes futures trading (e.g., MNQ, BTCUSDT.P), offering modular logic for scalpers and swing traders alike.
Key Features
Adaptive Moving Averages
Dynamic Logic: Fast and slow SMAs adjust lengths via ATR, reacting to momentum shifts and smoothing in calm markets.
Signals: Long entry on fast SMA crossing above slow SMA with price confirmation; short on cross below.
RSI Filtering (Optional)
Momentum Check: Confirms entries with RSI crossovers (e.g., above oversold for longs). Toggle on/off with custom levels.
Fine-Tuning: Adjustable lookback and thresholds (e.g., 60/40) for precision.
Candlestick Pattern Recognition
Eng|Enhanced Detection: Identifies strong bullish/bearish engulfing patterns, validated by volume and range strength (vs. 10-period SMA).
Conflict Avoidance: Skips trades if both patterns appear in the lookback window, reducing whipsaws.
Multi-Timeframe Trend Filter
15-Minute Alignment: Syncs intrabar trades with 15-minute SMA trends; optional for flexibility.
Dollar-Cost Averaging (DCA) New!
Scaling: Adds up to a set number of entries (e.g., 4) on pullbacks/rallies, spaced by ATR multiples.
Control: Caps exposure and resets on exit, enhancing trend-following potential.
Trade Execution & Risk Management
Entry Rules: Prioritizes moving averages or patterns (user choice), with volume, volatility, and time filters.
Stops & Trails:
Initial Stop: ATR-based (2–3.5x, volatility-adjusted).
Trailing Stop: Locks profits with configurable ATR offset and multiplier.
Discipline
Cooldown: Pauses post-exit (e.g., 0–5 minutes).
Min Hold: Ensures trades last a set number of bars (e.g., 2–10).
Visualization & Tools
Charts: Overlays MAs, stops, and signals; trend shaded in background.
Dashboard: Shows position, P&L, win rate, and more in real-time.
Debugging: Logs signal details for optimization.
Input Parameters
Parameter Purpose Suggested Use
Use RSI Filter - Toggle RSI confirmation *Disable 4 price-only
trading
RSI Length - RSI period (e.g., 14) *7–14 for sensitivity
RSI Overbought/Oversold - Adjust for market type *Set levels (e.g., 60/40)
Use Candlestick Patterns - Enables engulfing signals *Disable for MA focus
Pattern Lookback - Pattern window (e.g., 19) *10–20 bars for balance
Use 15m Trend Filter - Align with 15-min trend *Enable for trend trades
Fast/Slow MA Length - Base MA lengths (e.g., 9/19) *10–25 / 30–60 per
timeframe
Volatility Threshold - Filters volatile spikes *Max ATR/close (e.g., 1%)
Min Volume - Entry volume threshold *Avoid illiquid periods
(e.g., 10)
ATR Length - ATR period (e.g., 14) *Standard volatility
measure
Trailing Stop ATR Offset - Trail distance (e.g., 0.5) *0.5–1.5 for tightness
Trailing Stop ATR Multi - Trail multiplier (e.g., 1.0) *1–3 for trend room
Cooldown Minutes - Post-exit pause (e.g., 0–5) *Prevents overtrading
Min Bars to Hold - Min trade duration (e.g., 2) *5–10 for intraday
Trading Hours - Active window (e.g., 9–16) *Focus on key sessions
Use DCA - Toggle DCA *Enable for scaling
Max DCA Entries - Cap entries (e.g., 4) *Limit risk exposure
DCA ATR Multiplier Entry spacing (e.g., 1.0) *1–2 for wider gaps
Compliance
Realistic Testing: Fixed quantities, capital, and slippage for accurate backtests.
Transparency: All logic is user-visible and adjustable.
Risk Controls: Cooldowns, stops, and hold periods ensure stability.
Flexibility: Adapts to various futures and timeframes.
Summary
DAFE excels in volatile futures markets with adaptive logic, DCA scaling, and robust risk tools. Currently in prop account testing, it’s a powerful framework for precision trading.
Caution
DAFE is experimental, not a profit guarantee. Futures trading risks significant losses due to leverage. Backtest, simulate, and monitor actively before live use. All trading decisions are your responsibility.

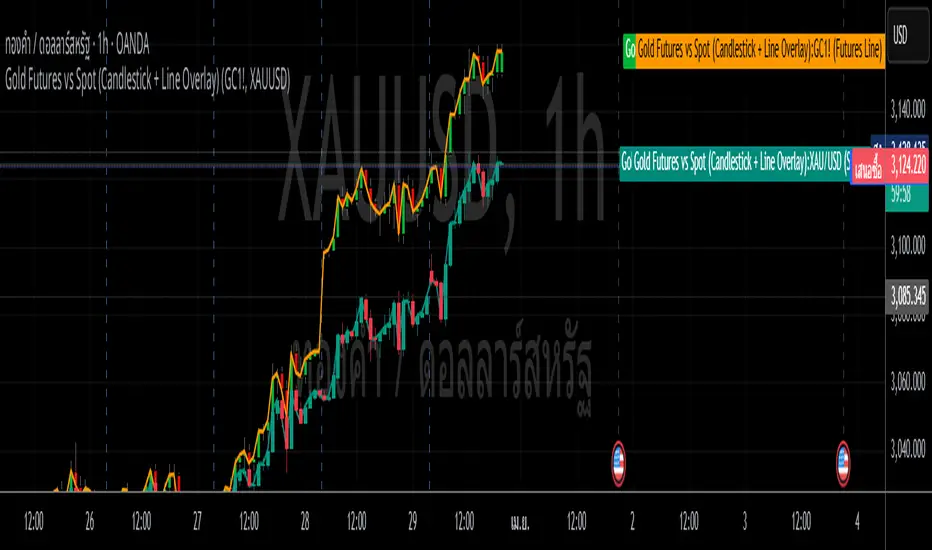
Gold Futures vs Spot (Candlestick + Line Overlay)📝 Script Description: Gold Futures vs Spot
This script was developed to compare the price movements between Gold Futures and Spot Gold within a specific time frame. The primary goals of this script are:
To analyze the price spread between Gold Futures and Spot
To identify potential arbitrage opportunities caused by price discrepancies
To assist in decision-making and enhance the accuracy of gold market analysis
🔧 Key Features:
Fetches price data from both Spot and Futures markets (from APIs or chart sources)
Converts and aligns data for direct comparison
Calculates the price spread (Futures - Spot)
Visualizes the spread over time or exports the data for further analysis
📅 Date Created:
🧠 Additional Notes:
This script is ideal for investors, gold traders, or analysts who want to understand the relationship between the Futures and Spot markets—especially during periods of high volatility. Unusual spreads may signal shifts in market sentiment or the actions of institutional players.
QQQ and SPY Price Levels [MW]Introduction:
Don’t let SPY and QQQ resistance levels hurt your futures trading anymore. The QQQ and SPY Price Levels indicator automagically provides easily accessible QQQ price levels for NASDAQ-related charts such as QQQ, /NQ and /MNQ futures, and leveraged ETFs such as TQQQ and SQQQ as well as for SPY price levels for S&P 500-related charts such as SPY, /ES and /MES futures, SPX, and leveraged ETFs such as UPRO and SPXU. If you’ve ever traded futures, or anything QQQ- or SPY-related and wanted to know at what price would the corresponding asset reach a key whole number level of QQQ or SPY, like 400, 440, 445, or even 447.50, this tool is for you. Key 10x, 5x, and even 2.5x multiples of QQQ and SPY can act as support or resistance for other related-assets. Until now, there hasn’t been an indicator that can serve as an easy visual cue to know exactly when that is about to happen across assets.
This indicator is a fork of the original SPY Price Levels indicator, which only considered SPY-related assets.
Settings:
QQQ/SPY 2.5x: Show closest levels above and below that are multiples of 2.5 on QQQ
QQQ/SPY 5x: Show closest levels above and below that are multiples of 5 on QQQ
QQQ/SPY 10x: Show closest levels above and below that are multiples of 10 on QQQ
Show QQQ/SPY Price Label: Show the current QQQ/SPY price
Extend lines to the left: Extend label lines for each price level to the beginning of the chart
Calculations:
This indicator defines the ratio between the price of QQQ/SPY and another NASDAQ/S&P-related asset and uses that multiplier once the user-defined price increments are defined. For example, if /MNQ is at 19000 and QQQ is at 465, then the ratio would be 40.8.
The incremental QQQ levels that are above and below the QQQ price are calculated using the following equations:
qqqLevelUp = _multiplier * math.ceil(_qqqClose / _multiplier)
qqqLevelDown = _multiplier * math.floor(_qqqClose / _multiplier)
The conversion ratio is then multiplied by that amount to get the final estimated corresponding price using the calculation:
levelUp := _conversion * qqqLevelUp
levelDown := _conversion * qqqLevelDown
For leveraged assets, the conversion must be used on the difference between the current QQQ price and the incremental upper and lower levels.
For example, the calculation for the next level up looks like the following:
levelUpDelta := math.abs(_qqqClose - qqqLevelUp)
levelUp := close + _conversion * (levelUpDelta * _leverage)
This logic is identical for SPY-related assets.
How to Use:
The QQQ and SPY Price Levels indicator aims to be as unobtrusive as possible. The default view shows 3 labels and 2 lines that are all aligned to the right of the main chart, so that it interferes as little as possible with any other indicators. It can be added to any /NQ or /MNQ futures chart, SQQQ, TQQQ, and, of course, QQQ as well as any /ES /MES futures chart, SPXU, UPRO, SPX, and of course SPY. The most immediate price levels for each multiplier appears above and below the current price along with the price of QQQ/SPY.
For example, MNQU2024 is currently at 19594. By looking at the indicator the next QQQ increment below is at 475, or 19556 on the MNQU2024 chart. This potential support is marked with a green label that shows both prices. The next increment above is at QQQ 477.50, or 19659 on the MESU2024 chart. And the QQQ price itself, is also shown (and can be removed) at 475.92.
QQQ and SPY price increments of 2.5, 5, and 10 tend to consistently act at the very least as emotional support and resistance levels. Weak, or weakening volume and/or momentum when these levels are hit can trigger a strong rejection, and can sometimes precipitate lengthy consolidation periods at those levels. Watching an NASDAQ- and S&P 500-related asset come to a halt, fall off a cliff, or react in some other unintuitive way could very well be the result of a QQQ/SPY level being reached. Even though many of us know that this relationship exists, it’s easy to forget. So, this indicator helps to ensure that its users keep that relationship front and center.
By extending the lines into the past on QQQ/SPY and their related assets, you can see what reactions happened at these key levels.
Other Usage Notes and Limitations:
The calculations used only provide an estimated relationship or a close approximation, and are not exact.
It's important for traders to be aware of the limitations of any indicator and to use them as part of a broader, well-rounded trading strategy that includes risk management, fundamental analysis, and other tools that can help with reducing false signals, determining trend direction, and providing additional confirmation for a trade decision. Diversifying strategies and not relying solely on one type of indicator or analysis can help mitigate some of these risks.

ILM NSE Futures - Open Interest Analysis - FnOUse this indicator on Daily Timeframe
This script works only on India NSE Futures (Indices and Fno Stocks)
This script pulls Stock/Index Price/Volume Info + Futures Current/Next Price/Volume/Open Interest Info
Calculates the Combined OI and identifies the OI Buildup based on the Price Change and color codes the info for easy reading
This script also calculates Stock/Futures Volume action to identify if big players are aggressively trading in Futures
Also OI Buildup to Future Volume is calculated to track the presence of big players.
Summary Row is displayed at the bottom which shows Futures Premium/Discount to Index/Stock

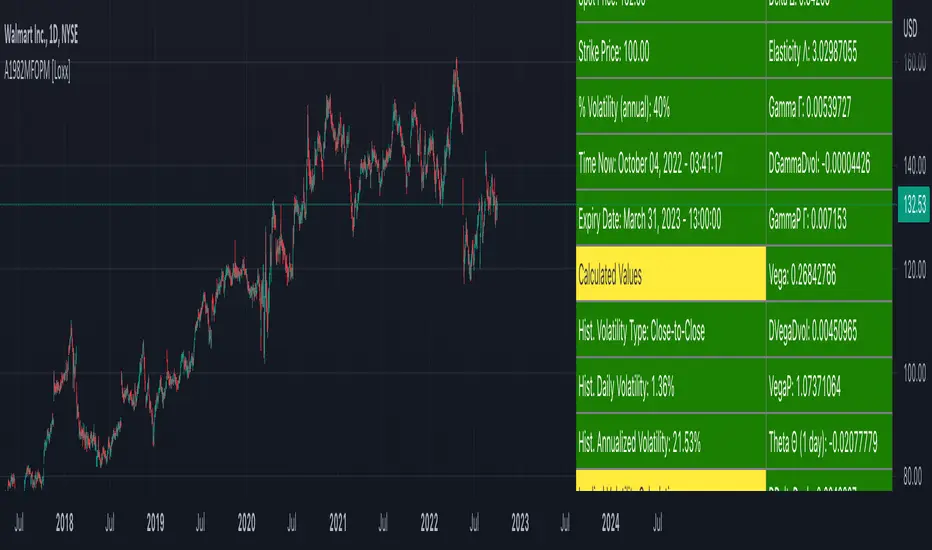
Asay (1982) Margined Futures Option Pricing Model [Loxx]Asay (1982) Margined Futures Option Pricing Model is an adaptation of the Black-Scholes-Merton Option Pricing Model including Analytical Greeks and implied volatility calculations. The following information is an excerpt from Espen Gaarder Haug's book "Option Pricing Formulas". This version is to price Options on Futures where premium is fully margined. This means the Risk-free Rate, dividend, and cost to carry are all zero. The options sensitivities (Greeks) are the partial derivatives of the Black-Scholes-Merton ( BSM ) formula. Analytical Greeks for our purposes here are broken down into various categories:
Delta Greeks: Delta, DDeltaDvol, Elasticity
Gamma Greeks: Gamma, GammaP, DGammaDvol, Speed
Vega Greeks: Vega , DVegaDvol/Vomma, VegaP
Theta Greeks: Theta
Probability Greeks: StrikeDelta, Risk Neutral Density
(See the code for more details)
Black-Scholes-Merton Option Pricing
The Black-Scholes-Merton model can be "generalized" by incorporating a cost-of-carry rate b. This model can be used to price European options on stocks, stocks paying a continuous dividend yield, options on futures , and currency options:
c = S * e^((b - r) * T) * N(d1) - X * e^(-r * T) * N(d2)
p = X * e^(-r * T) * N(-d2) - S * e^((b - r) * T) * N(-d1)
where
d1 = (log(S / X) + (b + v^2 / 2) * T) / (v * T^0.5)
d2 = d1 - v * T^0.5
b = r ... gives the Black and Scholes (1973) stock option model.
b = r — q ... gives the Merton (1973) stock option model with continuous dividend yield q.
b = 0 ... gives the Black (1976) futures option model.
b = 0 and r = 0 ... gives the Asay (1982) margined futures option model. <== this is the one used for this indicator!
b = r — rf ... gives the Garman and Kohlhagen (1983) currency option model.
Inputs
S = Stock price.
X = Strike price of option.
T = Time to expiration in years.
r = Risk-free rate
d = dividend yield
v = Volatility of the underlying asset price
cnd (x) = The cumulative normal distribution function
nd(x) = The standard normal density function
convertingToCCRate(r, cmp ) = Rate compounder
gImpliedVolatilityNR(string CallPutFlag, float S, float x, float T, float r, float b, float cm , float epsilon) = Implied volatility via Newton Raphson
gBlackScholesImpVolBisection(string CallPutFlag, float S, float x, float T, float r, float b, float cm ) = implied volatility via bisection
Implied Volatility: The Bisection Method
The Newton-Raphson method requires knowledge of the partial derivative of the option pricing formula with respect to volatility ( vega ) when searching for the implied volatility . For some options (exotic and American options in particular), vega is not known analytically. The bisection method is an even simpler method to estimate implied volatility when vega is unknown. The bisection method requires two initial volatility estimates (seed values):
1. A "low" estimate of the implied volatility , al, corresponding to an option value, CL
2. A "high" volatility estimate, aH, corresponding to an option value, CH
The option market price, Cm , lies between CL and cH . The bisection estimate is given as the linear interpolation between the two estimates:
v(i + 1) = v(L) + (c(m) - c(L)) * (v(H) - v(L)) / (c(H) - c(L))
Replace v(L) with v(i + 1) if c(v(i + 1)) < c(m), or else replace v(H) with v(i + 1) if c(v(i + 1)) > c(m) until |c(m) - c(v(i + 1))| <= E, at which point v(i + 1) is the implied volatility and E is the desired degree of accuracy.
Implied Volatility: Newton-Raphson Method
The Newton-Raphson method is an efficient way to find the implied volatility of an option contract. It is nothing more than a simple iteration technique for solving one-dimensional nonlinear equations (any introductory textbook in calculus will offer an intuitive explanation). The method seldom uses more than two to three iterations before it converges to the implied volatility . Let
v(i + 1) = v(i) + (c(v(i)) - c(m)) / (dc / dv (i))
until |c(m) - c(v(i + 1))| <= E at which point v(i + 1) is the implied volatility , E is the desired degree of accuracy, c(m) is the market price of the option, and dc/ dv (i) is the vega of the option evaluaated at v(i) (the sensitivity of the option value for a small change in volatility ).
Things to know
Only works on the daily timeframe and for the current source price.
You can adjust the text size to fit the screen