Find Best Performing MA For Golden CrossHello!
This script calculates the performance of any asset following a golden cross of two moving averages of any length!
The calculated moving averages are: SMA, EMA, HMA, VWMA, WMA, LSMA, and ALMA
The best performing moving average for the selected data series is listed first, followed by a descending order.
The indicator works on any timeframe, any asset, and can even be used on indicators such as RSI, %b, %k, etc.
The Moving Average Length and Source Are Customizable!
The Moving Averages Can Be Plotted on Most Data Series, Such As:
Close, Open, Low, hlc3, RSI, %B, %K, Etc.
The Script Will Recalculate for the Timeframe (1m, 5m, D, etc.)!
The (XX Candles) Indicates the Average Number of
Sessions the Shorter Ma Remains Above the Longer Ma Following an Upside Cross!
The Percentages (XX.XX%) Indicate the Average
Percentage Price Gain/Loss Following a Golden Cross,
Until the Shorter Ma Crosses Back Under the Longer Ma!
In This Example I Am Using a 63 Session Length for the
Shorter Ma for All Listed Ma Types for Closing Prices, and a 196 Candle Length for the Longer Ma!
Cerca negli script per "GOLD"

Bitcoin Golden Bottom Oscillator (MZ BTC Oscillator)This indicator uses Elliot Wave Oscillator Methodology applied on "BTC Golden Bottom with Adaptive Moving Average" and Relative Strength Index of Resulted EVO to form an Oscillator to detect trend health in Bitcoin price. Ticker is set to "INDEX : BTCUSD" on 1D timeframe.
Methodology
Oscillator uses Adaptive Moving Average with 1 year of length, Minor length of 50 and Major length of 100 to mark AMA as Golden Bottom.
Percentage Elliot Wave Oscillator is calculated between BTC price and AMA.
Relative Strength Index of EVO is calculated to detect trend strength and divergence detection.
Hull Moving Average of resulted RSI is used to smoothen the Oscillator.
Oscillator is hard coded to 'INDEX:BTCUSD' ticker on 1d so it can be used on any other chart and on any other timeframe.
Color Schemes
Bright Red background color indicates that price has left top Fib multiple ATR band and possibly go for top.
Light Red background color indicates that price has left 2nd top Fib multiple ATR band and possibly go for local top.
Lime background color indicates that price has entered lowest band indicating local bottom.
Bright Green background color indicates that price is approximately resting on Golden Bottom i.e. AMA.
Oscillator color is set to gradient for easy directional adaption.
BTC Golden Bottom with Adaptive Moving Average

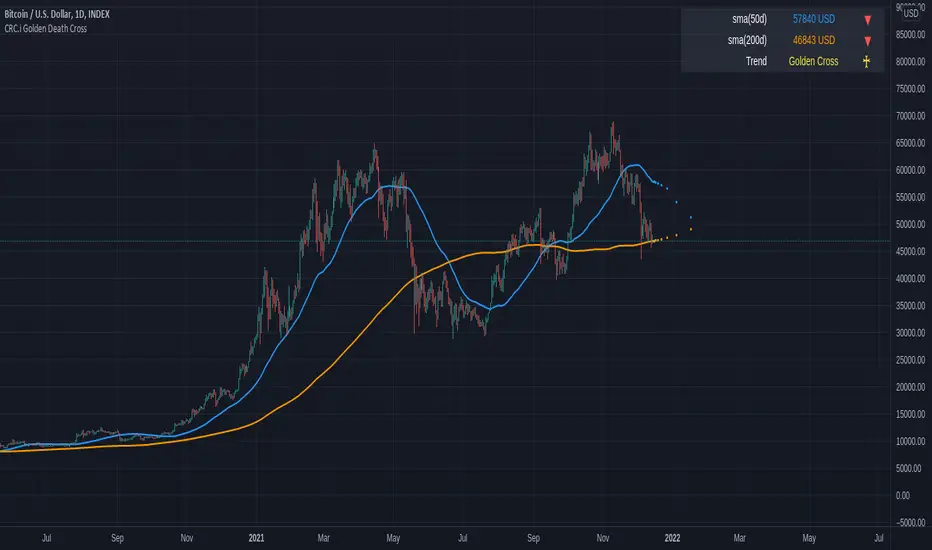
CRC.i Golden Death CrossThis is a simple reproduction of a common indicator used for analyzing the current momentum trend.
Golden Cross => 50 day simple moving average (sma) crosses over the 200 sma
Death Cross => 50 day simple moving average (sma) crosses under the 200 sma
Forecasting used in this indicator is a simple moving average, considering the price sma with length of (sma period - future bar count).
More articles at
mirror.xyz
medium.com
Divina - Support and ResistanceGiven the positive feedback received on the first Dynamic Support/Resistance script, I've decided to rewrite it on Pine Script v5 and publish it with open source code.
The main Divina area (box) is derived from change in price and volume, while the other support and resistance levels are based on the golden ratio (Divina proportione) or Fibonacci numbers.
The box will start to paint if the previous closed bar satisfy a condition and it will be never be repainted in the future. Anyway the box and the levels will be extended until a new signal is detected.
The Divina Support and Resistance will help you to find good price zones on wich the market might take trading decision. It is not a strategy by per se, it should be used with other good trading techniques.

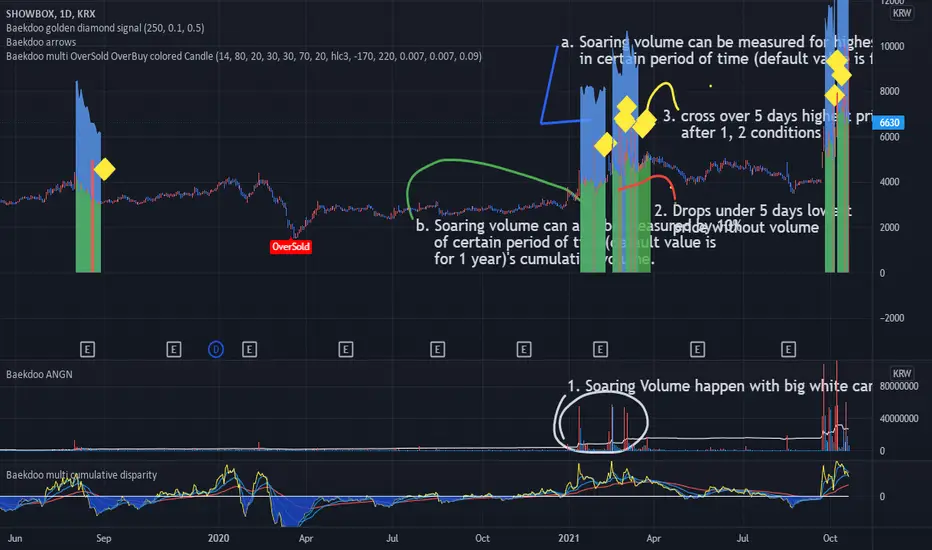
Baekdoo golden diamond signalHi forks,
I'm trader Baekdoosan who trading Equity from South Korea. This Baekdoo golden Diamond signal indicate good buying position to trade.
Here's the ideas
1. Soaring volume happen with big white candle.
a. Soaring volume can be measured for highest volume in certain period of time (default value is for 1 year). (blue area)
b. Soaring volume can also be measured by 10% of certain period of time(default value is for 1 year)'s cumulative volume . (green area) => you can adjust this ratio input. the higher value is the more likely to trail of whale
2. Drops under 5 days lowest price without volume . (red area) => I put half of average volume as default but you may can adjust it (the lower value is the more likely to soar again)
3. cross over 5 days highest price after 1, 2 conditions => Golden Diamond
underneath of this idea is, big chunk of the money comes and correction is on going but major whale's amount hold tight.
you can modify input values based on your investigation. It works well on day chart as well as minute chart. for the area with breaks plots are to checking the 1,2 conditions. so for final indicator will only be shown from this indicator but you can select plots if you think that is useful.
hope this will help your trading on equity as well as crypto. I didn't try it on futures . Best of luck all of you. Gazua~!
Baekdoo Golden Diamond signalHi forks,
I'm trader Baekdoosan who trading Equity from South Korea. This Baekdoo golden Diamond signal indicate good buying position to trade.
Here's the ideas
1. Soaring volume happen with big white candle.
a. Soaring volume can be measured for highest volume in certain period of time (default value is for 1 year). (blue area)
b. Soaring volume can also be measured by 10% of certain period of time(default value is for 1 year)'s cumulative volume. (green area) => you can adjust this ratio input. the higher value is the more likely to trail of whale
2. Drops under 5 days lowest price without volume. (red area) => I put half of average volume as default but you may can adjust it (the lower value is the more likely to soar again)
3. cross over 5 days highest price after 1, 2 conditions => Golden Diamond
underneath of this idea is, big chunk of the money comes and correction is on going but major whale's amount hold tight.
you can modify input values based on your investigation. It works well on day chart as well as minute chart. for the area with breaks plots are to checking the 1,2 conditions. so for final indicator will only be shown from this indicator but you can select plots if you think that is useful.
hope this will help your trading on equity as well as crypto. I didn't try it on futures . Best of luck all of you. Gazua~!

Auto Fib Golden Pocket Band - Autofib Moving Averageplots the fib retracement Golden pocket moving average band on two different pivots
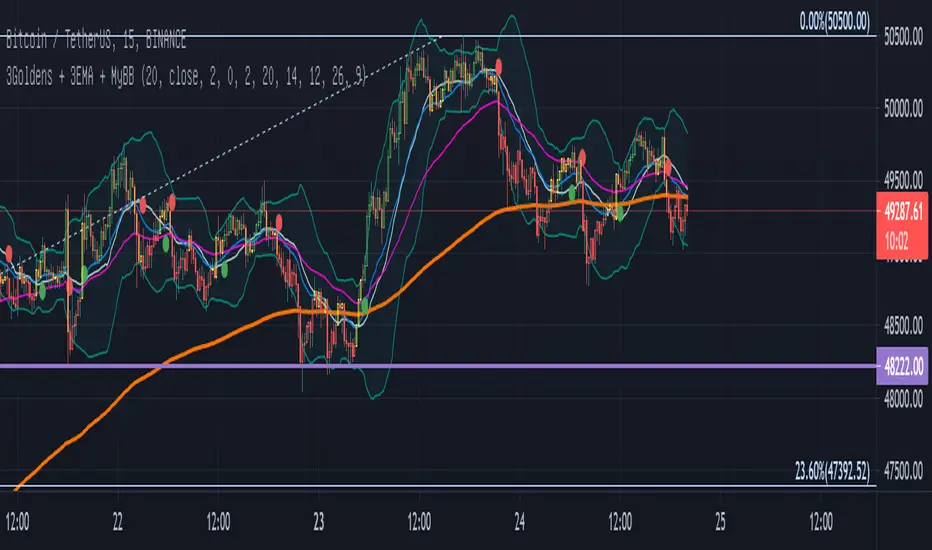
Three Golden By Moonalert =========================
English
=========================
Three Golden By Moonalert
(Green Bar) BUY = All three conditions are agree uptrend.
1 candlestick is on the middle line of Bollinger Bands
2 RSI is more than 50
3 MACD cross up Zero Line
(Red Bar) SELL = All three conditions are agree downtrend
1 candlestick is under the middle line of Bollinger Bands
2 RSI is less than 50
3 MACD cross down Zero Line
(Yello Bar) Wait and see = some candition are agree uptrend or downtrend
Basic logic is
Green = Buy
Red = Sell
Yello = wait and see
Working Good for TF Daily.
=========================
THAI
=========================
เขียว = ซื้อ ( Bollinger bands , Rsi , Macd บอกขึ้นทั้งหมด )
เเดง = ขาย ( Bollinger bands , Rsi , Macd บอกลงทั้งหมด )
เหลือง = นั่งนิ่งๆ ( Bollinger bands , Rsi , Macd บอกขั้นหรือลงบางตัว )
สามารถปรับMACD ระหว่าง
Cross Signal กับ Cross Zeroได้ เเนะนำอย่างหลัง
สามารถปรับ EMA 20 50 200 เปิดปิดได้ที่ตั้งค่า
RSI Divergency and Golden RatioHow to calculate:
Positive mismatch finds the lowest trough within the distance you choose. It then compares it to the current closing value.
If the past low is above the current closing level, it means that the bottoms of the price are descending.
The RSI level at the furthest bottom of the price is detected. And the current RSI level is detected. If the current RSI level is higher than the previous RSI level, there is a positive divergence.
When a positive divergence occurs, a green pole forms above the RSI indicator on the chart.
Negative finds the highest peak level within the distance you choose. It then compares it to the current closing value.
If the past high is below the current close, it means that the highs of the price are rising.
The RSI level at the furthest high of the price is detected. And the current RSI level is detected. If the current RSI level is lower than the previous RSI level, there is negative divergence.
When a negative divergence occurs, a red pole forms above the RSI indicator on the chart.
As can be seen in the image, the points marked with red are the regions where incompatibility occurs. At the same time, the signals that occur when the RSI cuts its own moving average and the signals that occur when the RSI cuts its own golden ratio are also very strong signals.
Waiting for your ideas and comments. I am open to criticism. We can improve.

Performante's Golden Ratio SupportsThis dataset projects the MA for BTC divided by the golden ratio (1.6) as well as the Fibonacci sequence (0, 1, 1, 2, 3, 5, 8, etc).
These numbers are intertwined with markets, and have been an effective support level for key inflection points for Bitcoin's lows.
This indicator is mainly focused on the large timeframe and is set to work best on the daily timeframe . The daily is it's primary use-case.
As the market cap of BTC continues to grow, it will become progressively more and more difficult to grow at the previous appreciation rate.
This slowing growth in the market cap is demonstrated by the Fibonacci sequence support levels that are keeping the price from total capitulation dump like previous bear markets.
As we can see, the dark green MA is a great area for potential buy opportunities, while the lime green (on the bottom) have only been touched a couple times. This is a major capitulation for BTC and the crypto market.
These zones are great opportunities for investment entries as they are relatively low compared to the historic price action.

Performante Golden Ratio MultiplierThis indicator projects the moving average for Bitcoin multiplied by the golden ratio (1.6) as well as the Fibonacci sequence (0, 1, 1, 2, 3, 5, 8, etc).
These mathematical numbers are intertwined with markets, and have been an effective resistance level for key inflection points for Bitcoin's highs.
This indicator is mainly focused on the large timeframe and is set to work best on the daily timeframe.
As the market cap of Bitcoin continues to grow, it will become progressively more and more difficult to grow at the previous appreciation rate.
This slowing growth in the market cap is demonstrated by the Fibonacci sequence resistance levels that are keeping the price from exploding like previous bull runs.
If the trend continues, we should see the price of Bitcoin become less and less volatile
This would lower the moving average resistance needed for the end of each bull run.

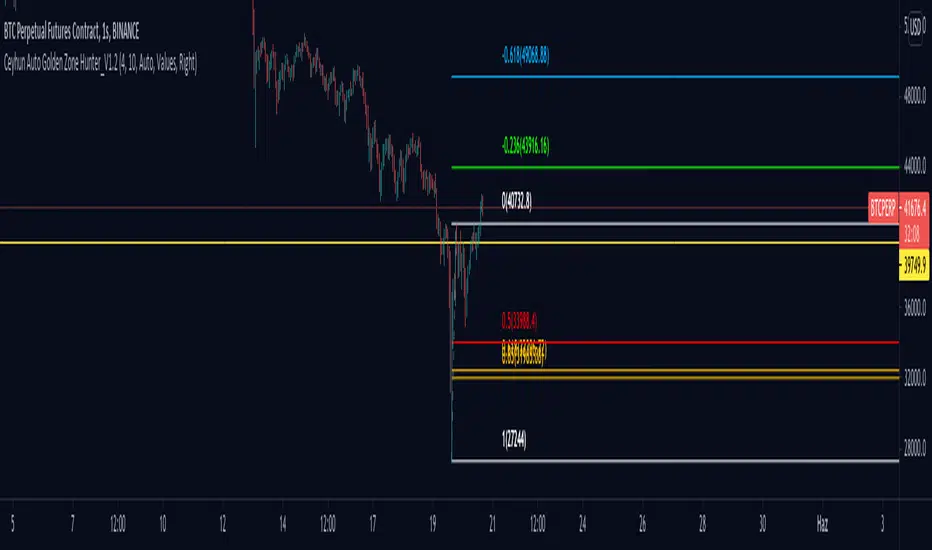
Ceyhun Auto Golden Zone Hunter_V1.2Ceyhun Auto Golden Zone Hunter_V1.2 indikatörünü içermektedir güncellemeler için takipte kalın..
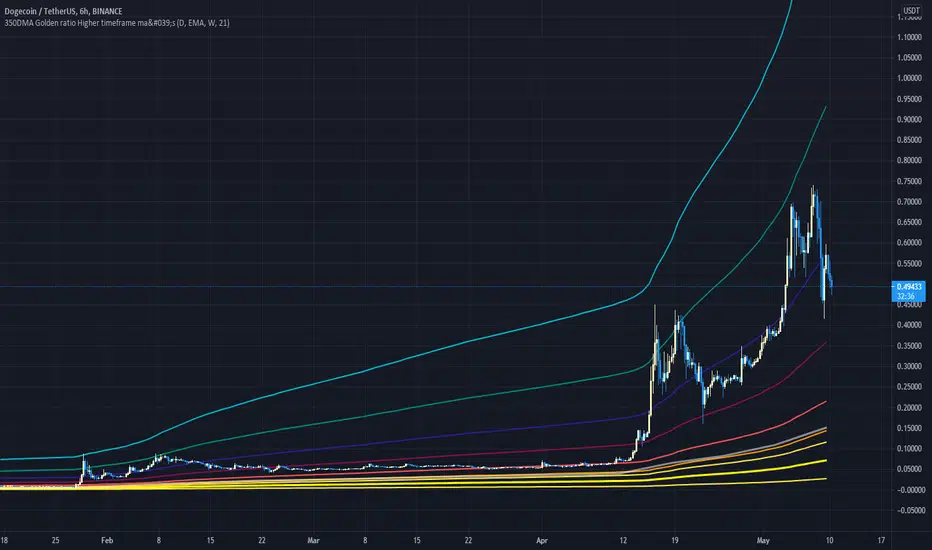
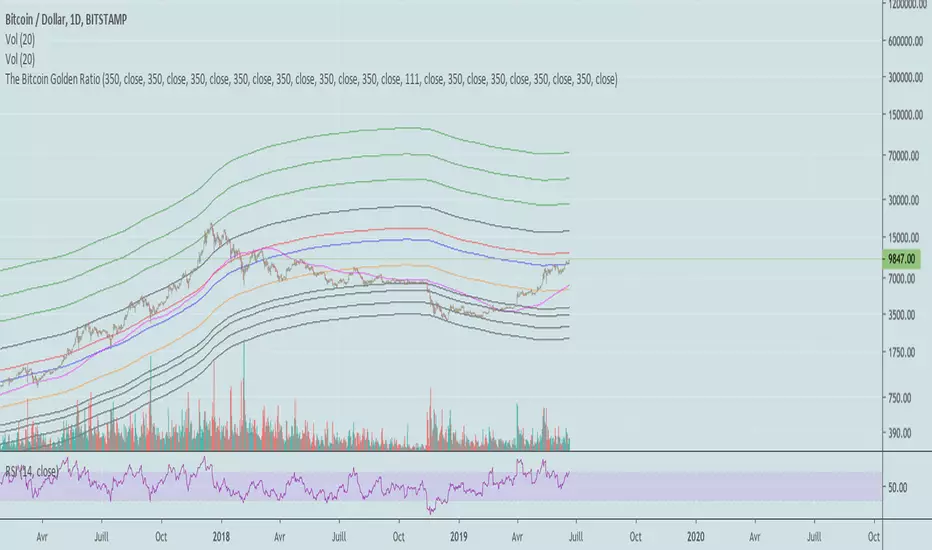
350DMA Golden ratio Higher timeframe ma'sThis Script take a 350 day moving average (bright yellow line) and multiplies it by the golden ratio 1.6... and by the Fibonacci sequence (0, 1, 2, 3, 5)
It is a great tool for finding tops and critical supports on higher timeframes.
The script also includes and higher timeframe ma (gray line) that can be set to your liking (default is 21 week).
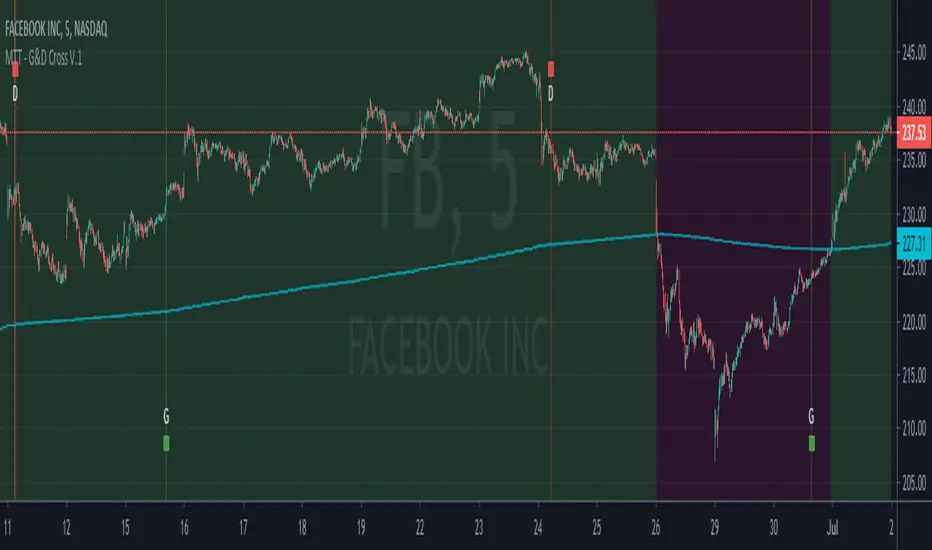
Market Trading Tools - Golden & Death Crosses + AlertsOur Golden & Death Cross indicator is another indicator we are happy to present to interested people. The indicator detects the possible trend change and it is a well known tool among traders.
To make it more convenient for your use we have labeled the golden gross with a G and there is a green vertical bar that is available on the signal. Same for the death cross we have put a D and a red vertical bar.
The indicator can be used on any financial market; crypto, stocks or forex. We do not recommend a certain time frame as each time frame usually this depends on each trader to another, but it works on every time frame, the signals will appear on any time frame used.
Once you are granted access to use it, add it from going into the scripts >> invite only scripts >> enable the indicator. Once the indicator is added to your chart you will see the indicator popping up on your chart.
We are happy to announce that our trading indicator is special and unique from different ones because it has alerts added to it and that feature isnt really available in most of the indicators around. We believe that the indicator plotting and style on chart is also easy for the eyes to catch and will probably not intersect with other indicators you might have on your chart, or at least our other indicators.
We have also enabled a function for our users to get a better view of the trend when they add the indicator to their chart. You can now view the trend background color (red&green) depending on if the price is above the EMA of your choice. you can also check whichever time interval you want that does not limit you to the time interval chosen on your chart itself.
Hope you enjoy it, Good luck and stay safe!
** If you are interested in this indicator. please use the link below to obtain access to this indicator.
The Golden PivotsThe Golden Pivots indicator is a combination of the following:
1. Central Pivot Range
2. Floor Pivots
3. Camarilla Pivots
4. Monthly, Weekly, Daily Highs and lows
5. Candlestick Setups
All the pivot calculations are based on Secret of Pivot Boss book by Frank Ochoa.
One can also view tomorrow's central pivot range by today end of the day.

LIB: Golden Ratio MultiplierIndicator Overview
The Golden Ratio Multiplier explores Bitcoin's adoption curve and market cycles to understand how price may behave on medium to long term time frames.
To do this it uses multiples of the 350 day moving average (350DMA) of Bitcoin's price to identify areas of potential resistance to price movements. Note: multiples are of the 350DMA's price values rather than its number of days.
The multiples reference the Golden Ratio (1.6) and the Fibonacci sequence (0, 1, 1, 2, 3, 5, 8, 13, 21). These are important mathematical numbers.
These specific multiplications of the 350DMA have been very effective over time at picking out intracycle highs for Bitcoin price and also the major market cycle highs.
As Bitcoin becomes adopted over time, it's market cycle highs hit decreasing Fibonacci sequence multiples of the 350DMA. This is because the explosive growth of Bitcoin on a logarithmic scale is slowing over time. As it's market cap increases it becomes more difficult for the same growth rates to continue.
If this decreasing Fibonacci sequence pattern continues to play out as it has done over the course of the past 9 years, then the next market cycle high will be when price is in the area of the 350DMA x3.
The Golden Ratio Multiplier is an effective tool because it is able to demonstrate when the market is likely overstretched within the context of Bitcoin's adoption curve growth and market cycles.


Bitcoin Golden RatioGives the top and bottom of the cryptocurrencies cycles.
When DMA111 crosses DMA350*2, the top is in.
Show accumulation phases and resistances with very precise accuracy.

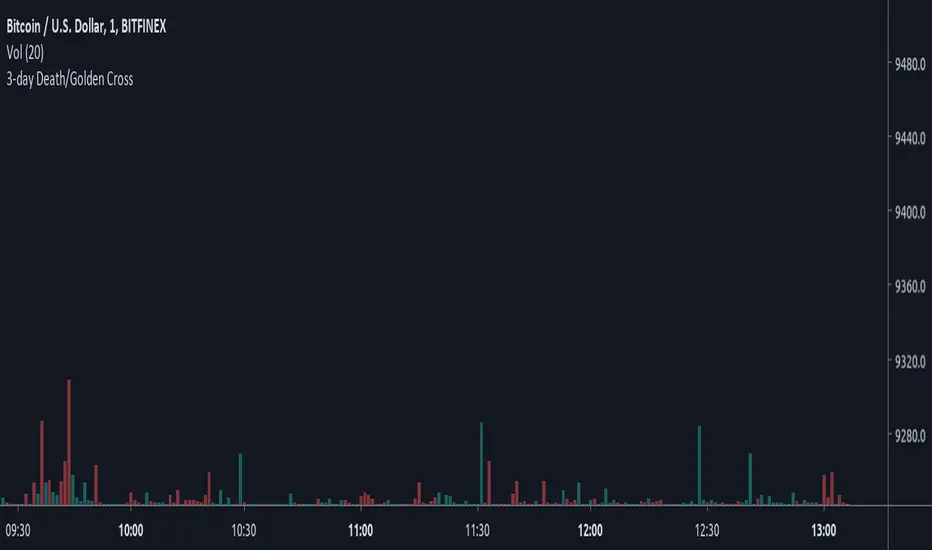
3-day Death/Golden CrossBased on Crypto Crew University youtube video, "Emergency Update: New Bitcoin GOLDEN Cross Emerges (btc crypto live news market price today 2019 ta" (19 June 2019), comparing 2015 and 2018 bull runs.
Bitcoin Golden Ratio Multiplier FibonacciA Script based on the wonderful article by Philip Swift (@PositiveCrypto) "The Golden Ratio Multiplier - Unlocking the mathematically organic nature of Bitcoin adoption"
Please read article for understanding use.
Best used on Daily

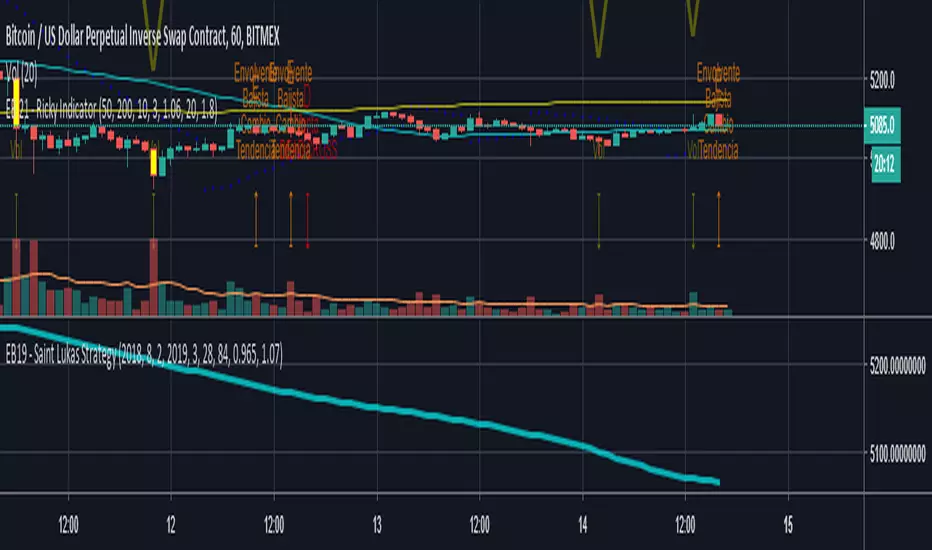
EB 21 - Ricky IndicatorIndicates multiple signals:
SAR
2 SMA
MAST Detector
Bullish Engulfing
Bear Engulfing
Gold and Dead Cross
Volume Increment