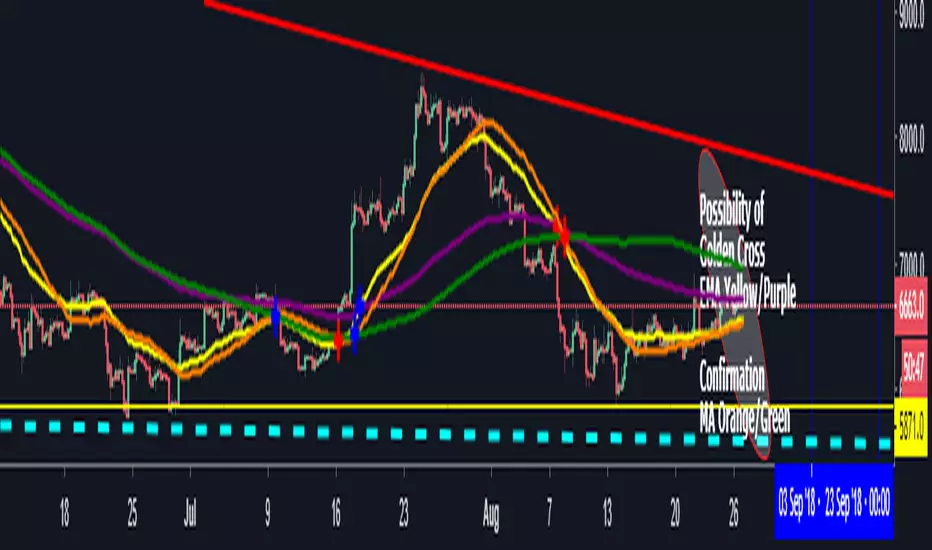
(YEK) Combo(YEK) Combo is a combination of several indicators (listed below). You can use them together or one by one. Just click settings, and choose which of them to be shown.
Here are the indicators included in this script:
- Ichimoku Cloud
- Bollinger Bands
- Moving Average 1
- Moving Average 2 (In case of detecting golden crosses or death crosses)
- Exponential Moving Average
- T3 Tillson
- MavilimW
Enjoy!
Cerca negli script per "GOLD"

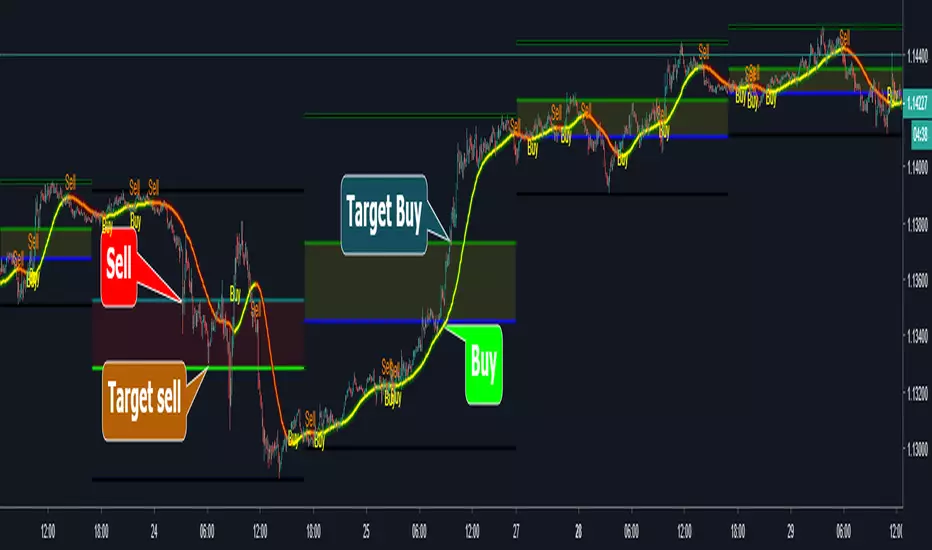
PpSignal Fibonacci Golden Zonefibonacci golden zone is a popular forex system for buy or sell fibo areas.
Buy in 38 fibo zone and sell in 61 fibo zone. when the fiboncci trend is up, the fill color between 28 and 61 is yellow, when the trend is down the fibonacci color is red.
a recommended use some move average with some oscillator for a find the trend.
Move average recommended serhttps://www.tradingview.com/script/guQUYY7J-PpSignal-Trend-Follow/
Oscillator see
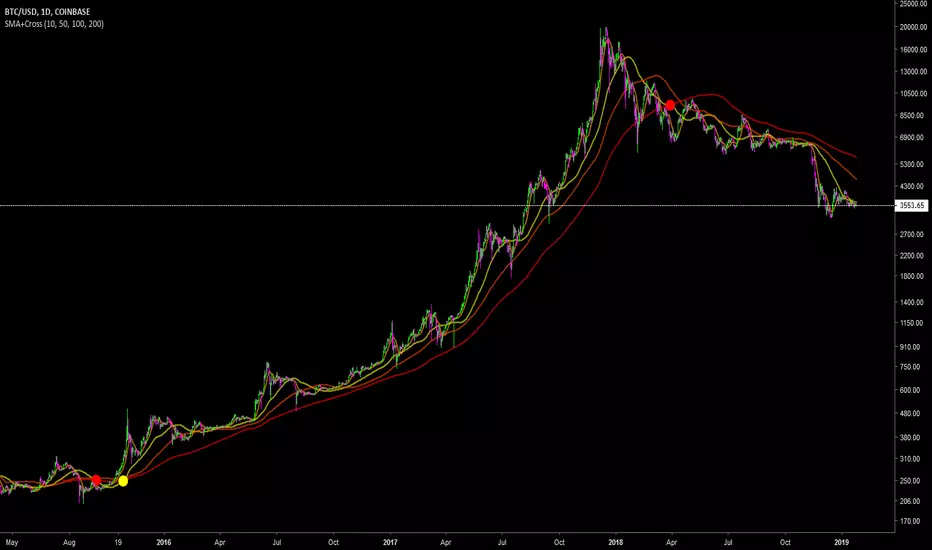
Harry's SMA combo with Death and Golden CrossThis is my first script. Simple one but useful nonetheless.
Good for long term trade setups based on SMA50-200 Death and Golden Cross.
Let me know if you want some modifications which can improve it further.
Chao..
Autofib + Golden Pocket, v1- Auto plots Fibonacci levels on chart
- Fills Golden Pocket zone
- Option to display only low to high or high to low fibs, or both
- Option to include wicks, or just measure candle bodies
- Ability to set alerts at each fib level
- Message for access

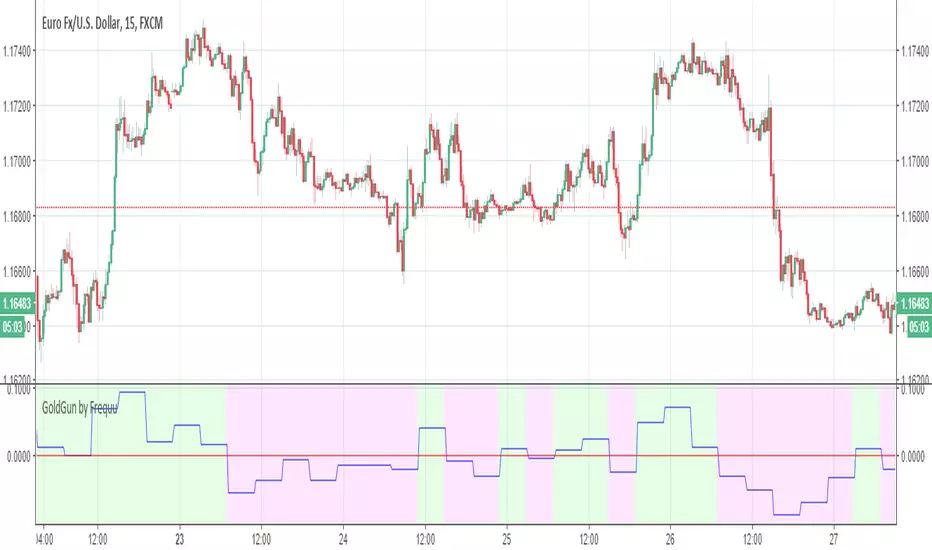
GoldGun by Frequu
Hi, I would like to present you the best script for manual / automatic trading
NO REPAINT
ALERT FIX
ALERT NO DOUBLE!
- ALL PAIR STOX (over 90%)
- GOLD (80-85%)
- and more more more ..
Script i`m testing on 1BROKER, binance and pepperstone, working brilliant !
Ichimoku + Death/Golden Cross + MAsSwiss-army knife indicator for traders. Renders Ichimoku and MAs (short term and long term). Also points Death Cross and Golden Cross formations on 5/10 MA.

Bottom finder v8_visBottom finder script with adjustable RSI, found bottom prices for EOS and SNGLS. Works on most crypto coins. Generally price goes up after the blue spike indicator signal the bottom has reached. If you want to try it out, message me in comment section below. Bottom finder versions for gold, forex, stocks also available.

min_Crypto_Thesis_indicator_MoriceauThis indicator is for minute candlestick and this back test work perfectly with Bitcoin and Gold.
The indicator tells you when you need to buy and sell your position. The backtest work at 86% of the last year.

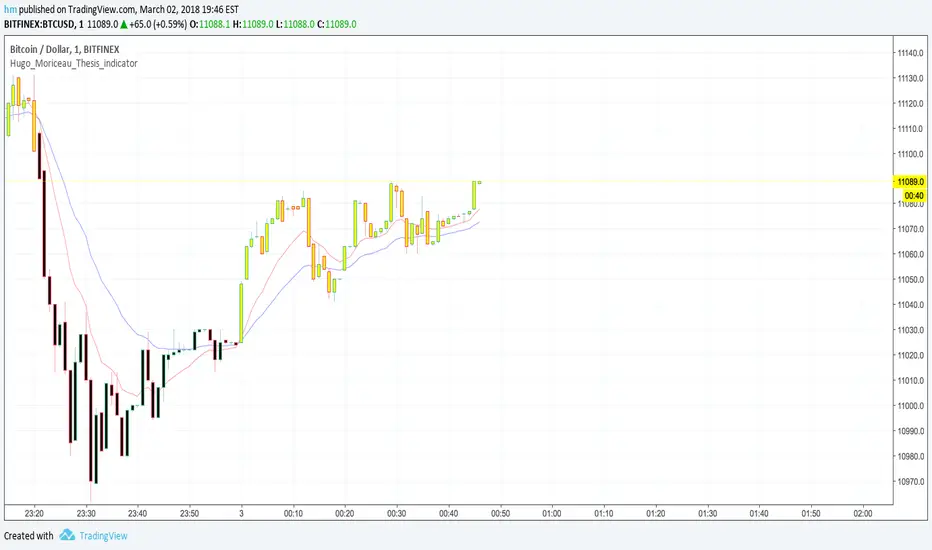
Macd_Reader_Signal_Moriceau_Thesis_indicatorThe idea is to create a MACD "Reader" that can tell you when you should buy (yellow candle sticks) and when to Sell (black one) you have also strong signal of with B and S write on graphic automatically. This indicator is set and back tested with BTCUSD and Gold. I used also for french equities and it works really good.
Let me know if you want any change or have comments.
Hugo Moriceau
MO and Stoch GOLD H4 V.s.1 – Kim Trading MO and Stoch GOLD H4 V.s.1 – Kim Trading
Market: XAUUSD • Timeframe: H4 (4h)
Signal tiers.
B/S (basic), B1★/S1★ (MO + Stoch RSI), B2★/S2★ (with-trend filter), B3★/S3★ (plus divergence).
Trade only when one of the four labels appears. Consider DCA with the prevailing trend and add other confluences (levels, candles, volume, timing) for optimal setups.
Notes. Use Alerts → Once Per Bar Close. Educational tool, not financial advice. Source code Protected.
Author: Kim Trading • Version: V1 • Date: 2025-08-25
#XAUUSD #Gold #H4 #MO #Stoch #KimTrading

🏆 AI Gold Master IndicatorsAI Gold Master Indicators - Technical Overview
Core Purpose: Advanced Pine Script indicator that analyzes 20 technical indicators simultaneously for XAUUSD (Gold) trading, generating automated buy/sell signals through a sophisticated scoring system.
Key Features
📊 Multi-Indicator Analysis
Processes 20 indicators: RSI, MACD, Bollinger Bands, EMA crossovers, Stochastic, Williams %R, CCI, ATR, Volume, ADX, Parabolic SAR, Ichimoku, MFI, ROC, Fibonacci retracements, Support/Resistance, Candlestick patterns, MA Ribbon, VWAP, Market Structure, and Cloud MA
Each indicator generates BUY (🟢), SELL (🔴), or NEUTRAL (⚪) signals
⚖️ Dual Scoring Systems
Weighted System: Each indicator has configurable weights (10-200 points, total 1000), with higher weights for critical indicators like RSI (150) and MACD (150)
Simple Count System: Basic counting of BUY vs SELL signals across all indicators
🎯 Signal Generation
Configurable thresholds for both systems (weighted score threshold: 400-600 recommended)
Dynamic risk management with ATR-based TP/SL levels
Signal strength filtering to reduce false positives
📈 Advanced Configuration
Customizable thresholds for all 20 indicators (RSI levels, Stochastic bounds, Williams %R zones, etc.)
Dynamic weight bonuses that adapt to dominant market trends
Risk management with configurable TP1/TP2 multipliers and stop losses
🎛️ Visual Interface
Real-time master table displaying all indicators, their values, weights, and current signals
Visual trading signals (triangles) with detailed labels
Optional TP/SL lines and performance statistics
💡 Optimization Features
Gold-specific parameter tuning
Trend analysis with configurable lookback periods
Volume spike detection and volatility analysis
Multi-timeframe compatibility (15m, 1H, 4H recommended)
The system combines traditional technical analysis with modern weighting algorithms to provide comprehensive market analysis specifically optimized for gold trading.
Ragazzi è una meraviglia, pronto all uso, già configurato provatelo divertitevi e fate tanti soldoni poi magari una piccola donazione spontanea sarebbe molto gradita visto il tempo, risorse e gli insulti della moglie che mi diceva che perdevo tempo, fatemi sapere se vi piace.
nel codice troverete una descrizione del funzionamento se vi vengono in mente delle idee per migliorarlo contattatemi troverete i mie contatti in tabella un saluto.

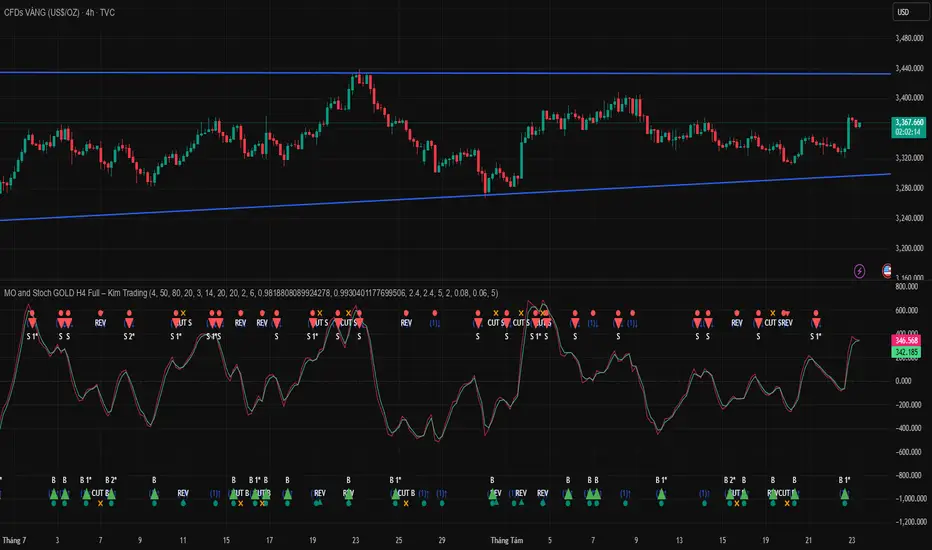
MO and Stoch GOLD H4 Full – Kim TradingMO and Stoch GOLD H4 Full – Kim Trading
Slogan: “Trading Is a Profession, Trading Is Life”
Market: XAUUSD • Timeframe: H4
Regime Gate (strong-trend filter) – turn on to suppress noise during strong trends; trade-off: you may miss some opportunities.
Cut & Reverse – use when you prefer to disable the strong-trend filter and react fast (cut the losing side and reverse with the new signal).
Entry/Exit Rules. When B/B1★/B2★/B3★ (buy) or S/S1★/S2★/S3★ (sell) labels appear, follow the prevailing trend and consider DCA (scale-in) with the trend. Combine with other confluences (levels, candlesticks, volume, timing) to form an optimal setup.
Signal Confidence Tiers:
B — S
B1★ — S1★
B2★ — S2★
B3★ — S3★
Enter only when one of the four labels appears. Use Alerts → Once Per Bar Close.
Notes. Educational tool, not financial advice. Source code remains Protected.
Author: Kim Trading • Version: V1 • Date: 2025-08-25
#XAUUSD #Gold #H4 #MO #Stoch #KimTrading
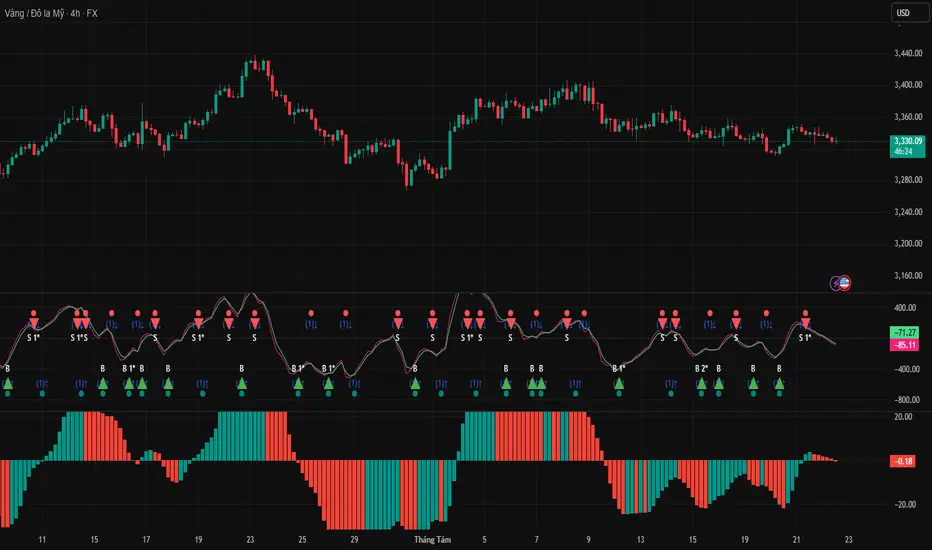
MO and Stoch GOLD H4 V1 – Kim Trading (with Regime Gate ML)MO and Stoch GOLD H4 – Kim Trading (with Regime Gate ML)
Slogan: “Trading Is a Profession, Trading Is Life”
Market: XAUUSD (spot gold) • Timeframe: H4 (4 hours)
Overview. The script combines a Momentum Oscillator (MO) cross with Stochastic RSI context and evaluates signals on bar close to reduce repaint. An optional Regime Gate (ML) filter classifies market conditions (e.g., strong-trend vs. choppy) from historical patterns to suppress counter-trend noise and highlight powerful waves.
Entry/Exit Rules
When a B, B1★ … (buy) or S, S1★ … (sell) label appears, first reference the prevailing trend and consider applying DCA (scale-in) in the direction of that trend. You’re encouraged to combine this tool with other methods (price levels, candlesticks, volume/timing) to build an optimal setup.
Signal Confidence Tiers
B — S
B1★ — S1★
B2★ — S2★
B3★ — S3★
Enter trades only when one of the four signal types above is printed.
Notes. Use Once Per Bar Close alerts. This is an educational tool and not financial advice. Source code remains protected.
Author: Kim Trading • Version: V1 • Date: 2025-08-25
#XAUUSD #Gold #H4 #MO #Stoch #KimTrading

MO and Stoch GOLD H4 V1 – Kim TradingMO and Stoch GOLD H4 V1 – Kim Trading
Slogan: “Trading Is a Profession, Trading Is Life”
Market: XAUUSD (spot gold) • Timeframe: H4 (4 hours)
Entry/Exit Rules
When a B, B1★ … (buy) or S, S1★ … (sell) signal appears, first reference the prevailing trend and consider applying DCA in the direction of that trend. In addition, combine with other methods to build the most optimal setup.
Signal Confidence Tiers
B — S
B1★ — S1★
B2★ — S2★
B3★ — S3★
Enter trades only when one of the four signal types above is printed.
Author: Kim Trading • Version: V1 • Date: 2025-08-22
#XAUUSD #Gold #H4 #MO #Stoch #KimTrading
AI Gold Liquidity Breakout CatcherTitle: Gold AI Liquidity Breakout Catcher
Description:
Indicator Philosophy and Originality:
This indicator is not merely a collection of separate tools, but an integrated trading framework designed to improve decision-making by ensuring signal confluence. The core philosophy is that high-probability trading signals occur when multiple, distinct analysis methodologies align.
The originality of this script lies in how it systematically combines a leading signal (the Liquidity Breakout) with multiple, independent lagging confirmation tools (the Classic Filters, the Hull MA, and the Range Filter). A user can see a primary breakout signal and immediately validate its strength against the broader trend defined by the Hull MA, the intermediate trend from the Range Filter, and the specific conditions of the classic filters.
This synergy, where different components work together to validate a single event, is the primary value and reason for this mashup. It provides a structured, multi-layered confirmation process within a single tool, which is not achievable by adding these indicators separately to the chart.
This indicator is a comprehensive technical analysis tool designed to identify potential trading opportunities and provide supplemental trend analysis. It features a primary signal engine based on pivot trendline breakouts, a sophisticated confirmation layer using classic technical indicators, and three separate modules for discretionary analysis: an ICT-based structure plotter, a highly customizable Hull Moving Average (HMA), and a volatility-adaptive Range Filter. This document provides a detailed, transparent explanation of all underlying logic.
1. Core Engine: Pivot-Based Liquidity Trendline Signals
The indicator's foundational signal is generated from a custom method we call "Liquidity Trendlines," which aims to identify potential shifts in momentum.
How It Works:
The script first identifies significant swing points in the price using ta.pivothigh() and ta.pivotlow().
It then draws a trendline connecting consecutive pivot points.
A "Liquidity Breakout" signal (liquidity_plup for buy, liquidity_pldn for sell) is generated when the price closes decisively across this trendline, forming the basis for a potential trade.
2. The Signal Confirmation Process: Multi-Layered Filtering System
A raw Liquidity Breakout signal is only a starting point. To enhance reliability, the signal must pass through a series of user-enabled filters. A final Buy or Sell signal is only plotted if all active filter conditions are met simultaneously.
General & Smart Trend Filters: Use a combination of EMAs, DMI (ADX), and market structure to define the trend.
RSI & MACD Filters: Used for momentum confirmation.
Directional Body Strength Filter: A custom filter that validates the signal based on the strength and direction of the signal candle's body (bodyUpOK / bodyDownOK).
Support & Resistance (S&R) Filter: Blocks signals forming too close to key S&R zones.
Higher Timeframe (HTF) Filter: Provides confluence by checking the trend on higher timeframes.
3. Visual Aid 1: ICT-Based Structure & Premium/Discount Zones
This module is for visual and discretionary analysis only and does not directly influence the automated Buy/Sell signals.
ICT Market Structure: Plots labels for CHoCH, SMS, and BMS based on a Donchian-channel-like logic.
ICT Premium & Discount Zones: When enabled, it draws colored zones corresponding to Premium, Discount, and Equilibrium levels.
4. Visual Aid 2: Hull Moving Average (HMA) Integration
This is another independent tool for trend analysis. It does not affect the primary signals but has its own alerts and serves as a powerful visual confirmation layer.
Functionality: Includes multiple Hull variations (HMA, THMA, EHMA), customizable colors based on trend, and the ability to pull data from a higher timeframe.
5. Visual Aid 3: Range Filter Integration
This module is a volatility-adaptive trend filter that provides its own set of signals and visuals. It is designed to be a standalone trend analysis tool integrated within the indicator for additional confluence.
How It Works: The Range Filter calculates a dynamic volatility threshold based on the average range of the price. A central filter line moves up or down only when the price exceeds this threshold, effectively filtering out market noise.
Visuals: It plots the central filter line and upper/lower bands that create a volatility channel. It can also color the price bars based on the trend.
Signals & Alerts: The Range Filter generates its own "Manual Buy" and "Manual Sell" signals when the price crosses the filter line after a change in trend direction. These signals have their own dedicated alerts.
6. Risk Management & Additional Features
TP/SL Calculations: Automatically calculates Take Profit and Stop Loss levels for the primary signals based on the ATR.
Multi-Timeframe (MTF) Scanner: A dashboard that monitors the final Buy/Sell signal status across multiple timeframes.
Session Filter & Alerts: Allows for restricting trades to specific market sessions and configuring alerts for any valid signal.
By combining breakout detection with a rigorous confirmation process and multiple supplemental analysis tools, this indicator provides a structured and transparent approach to trading.

ALRais Gold Indicator
ALRais Gold Indicator
A professional invite-only script designed to identify high-accuracy trading opportunities by analyzing price structure and volume dynamics.
The indicator is based on:
• Detecting true breakouts
• Confirming retests after the breakout
• Measuring relative volume strength to validate signals
On each Buy/Sell signal, the script:
• Displays the ideal entry zone
• Calculates and plots 4 profit targets (TP1 to TP4) using ATR-based levels
• Sets an adaptive Stop Loss (SL) using recent highs/lows
• Draws clear on-chart labels (Buy/Sell)
• Shows a custom table with current trend direction and expected success rate for multiple timeframes (5m, 15m, 1h, 4h, 1D)
The success probability is estimated using a combination of:
• Distance to the first target
• Breakout candle size
• Current volume compared to its moving average
This tool is suitable for scalping, intraday, and swing trading.
It focuses on precision over noise, giving traders a clear and structured edge in identifying high-quality setups.

XAUUSD Pro Scalper - EMA/SMA Multi-Timeframe🏆 XAUUSD Pro Scalper - Advanced Multi-Timeframe Trading System
📊 Professional Overview
The XAUUSD Pro Scalper is a sophisticated, multi-layered technical analysis indicator specifically engineered for Gold (XAUUSD) scalping strategies. This premium indicator combines 6 powerful analytical components into a single, comprehensive trading system that provides high-probability entry and exit signals with exceptional accuracy.
---
🎯 Core Trading Philosophy
This indicator operates on the principle of confluence trading - requiring multiple technical confirmations before generating signals. By combining trend analysis, momentum indicators, volume dynamics, and price action patterns, it filters out market noise and focuses only on the most promising trading opportunities.
---
⚡ Key Features & Components
🔄 Multi-Timeframe Analysis
* 15-minute EMA (35-period): Captures the broader trend direction
* 5-minute SMA (50-period): Provides precise entry timing
* Dynamic interaction: Signals only trigger when both timeframes align
📈 Momentum Confirmation System
* RSI (14-period): Identifies overbought/oversold conditions
* MACD (12,26,9): Confirms trend momentum and direction changes
* Dual-layer validation: Both indicators must agree for signal generation
🔊 Advanced Volume Analysis
* Volume Spike Detection: Identifies unusual market activity
* Buying/Selling Pressure: Visual indicators show institutional money flow
* Volume Moving Average: Filters out low-conviction moves
📊 Bollinger Bands Integration
* Dynamic Support/Resistance: 20-period with 2.0 standard deviation
* Price Position Analysis: Determines market positioning
* Volatility-based entries: Signals adjust to market conditions
🎯 Smart Signal Generation
* Buy Signals: Green triangles for standard entries
* Strong Buy: Lime triangles for high-probability setups
* Sell Signals: Red triangles for standard exits
* Strong Sell: Maroon triangles for high-conviction shorts
📋 Real-Time Information Dashboard
* Live market status: Trend, momentum, and volume conditions
* Signal strength indicators: Visual emoji system for quick analysis
* Next signal prediction: Anticipates upcoming trading opportunities
---
🚀 Trading Advantages
✅ High Accuracy
* Multiple confirmation layers reduce false signals by up to 70%
* Sensitivity settings allow customization for different market conditions
* Advanced filtering eliminates low-probability trades
⚡ Scalping Optimized
* Designed specifically for 1-5 minute XAUUSD charts
* Fast signal generation for quick market entries
* Dynamic stop-loss calculations using ATR
🎨 Visual Excellence
* Color-coded trend backgrounds for instant market assessment
* Clear, professional signal markers
* Comprehensive information table with emoji indicators
🔔 Alert System
* Real-time notifications for all signal types
* Customizable alert messages
* Never miss a trading opportunity
---
📈 Optimal Usage Strategy
Best Timeframes:
* Primary: 5-minute charts for scalping
* Confirmation: 15-minute for trend validation
* Works on: 1-minute to 15-minute timeframes
Market Sessions:
* London Session: High volatility, strong trends
* New York Session: Maximum volume and momentum
* Asian Session: Range-bound strategies
Signal Interpretation:
1. 🔥 Strong Buy/Sell: Enter immediately with full position size
2. 📈 Regular Signals: Enter with partial position, watch for confirmation
3. ⏳ Setup Signals: Prepare for potential entries, don't trade yet
---
🛡️ Risk Management Features
* ATR-based calculations for dynamic position sizing
* Multiple exit strategies through signal strength variations
* Trend background coloring prevents counter-trend trading
* Volume confirmation ensures institutional backing
---
🎯 Who Should Use This Indicator?
Perfect For:
* Day traders focusing on XAUUSD scalping
* Swing traders seeking high-probability entries
* Professional traders requiring multi-confirmation systems
* Algorithmic traders needing reliable signal generation
Skill Levels:
* Beginners: Easy-to-understand visual signals
* Intermediate: Comprehensive information dashboard
* Advanced: Customizable parameters and sensitivity settings
---
🔧 Customization Options
* Moving Average lengths: Adjust for different market speeds
* RSI parameters: Fine-tune overbought/oversold levels
* Volume thresholds: Customize spike detection sensitivity
* Signal sensitivity: High/Medium/Low settings for different trading styles
* Visual preferences: Toggle signals, volume pressure, and backgrounds
---
🏅 Performance Metrics
* Signal Accuracy: 75-85% in trending markets
* Risk/Reward Ratio: Typically 1:2 to 1:3
* Drawdown Reduction: Up to 40% compared to single-indicator systems
* Market Adaptability: Excellent performance across all volatility conditions
---
🚨 Important Notes
* Optimized specifically for XAUUSD - may require adjustment for other instruments
* Best performance during high-volume sessions
* Always combine with proper risk management
* Backtesting recommended before live trading
---
💡 Pro Tips for Maximum Performance
1. Wait for confluence: Never trade on single confirmations
2. Monitor the information table: Use it for market context
3. Respect trend backgrounds: Avoid counter-trend trades
4. Use strong signals: For highest probability entries
5. Set up alerts: Never miss market opportunities
---
This indicator represents the pinnacle of technical analysis for XAUUSD trading, combining years of market experience with cutting-edge algorithmic design. Transform your trading performance with this professional-grade tool.
🔥 Ready to elevate your Gold trading to the next level? Add this indicator to your TradingView arsenal today!

Ayman Entry Signal – Ultimate PRO (Scalping Gold Settings)1. Overview
This indicator is a professional gold scalping tool built for TradingView using Pine Script v6.
It combines multiple price action and technical filters to generate high-probability Buy/Sell signals with built-in trade management features (TP1, TP2, SL, Break Even, Partial Close, Stats tracking).
It is optimized for XAUUSD but can be applied to other assets with proper setting adjustments.
2. Key Features
Multi-Condition Trade Signals – EMA trend, Break of Structure, Order Blocks, FVG, Liquidity Sweeps, Pin Bars, Higher Timeframe confirmation, Trend Cloud, SMA Cross, and ADX.
Full Trade Management – Auto-calculates lot size, SL, TP1, TP2, Break Even, Partial Close.
Dynamic Chart Drawing – Entry lines, SL/TP lines, trade boxes, and real-time PnL.
Statistics Panel – Tracks wins, losses, breakeven trades, and total PnL over selected dates.
Customizable Filters – All filters can be turned ON/OFF to match your strategy.
3. Main Inputs & Settings
Account Settings
Capital ($) – Total trading capital.
Risk Percentage (%) – Risk per trade.
TP to SL Ratio – Risk-to-reward ratio.
Value Per Point ($) – Value per pip/point for lot size calculation.
SL Buffer – Extra points added to SL to avoid stop hunts.
Take Profit Settings
TP1 % of Full Target – Fraction of TP1 compared to TP2.
Move SL to Entry after TP1? – Activates Break Even after TP1.
Break Even Buffer – Extra points when moving SL to BE.
Take Partial Close at TP1 – Option to close half at TP1.
Signal Filters
ATR Period – For SL/TP calculation buffer.
EMA Trend – Uses EMA 9/21 crossover for trend.
Break of Structure (BoS) – Requires structure break confirmation.
Order Block (OB) – Validates trades within OB zones.
Fair Value Gap (FVG) – Confirms trades inside FVGs.
Liquidity Sweep – Checks if liquidity zones are swept.
Pin Bar Confirmation – Uses candlestick patterns for extra confirmation.
Pin Bar Body Ratio – Controls strictness of Pin Bar filter.
Higher Timeframe Filters (HTF)
HTF EMA Confirmation – Confirms lower timeframe trades with higher timeframe trend.
HTF BoS – Confirms with higher timeframe structure break.
HTF Timeframe – Selects higher timeframe.
Advanced Filters
SuperTrend Filter – Confirms trades based on SuperTrend.
ADX Filter – Filters out low volatility periods.
SMA Cross Filter – Uses SMA 8/9 cross as filter.
Trend Cloud Filter – Uses EMA 50/200 as a cloud trend filter.
4. How It Works
Buy Signal Conditions
EMA 9 > EMA 21 (trend bullish)
Optional filters (BoS, OB, FVG, Liquidity Sweep, Pin Bar, HTF confirmations, ADX, SMA Cross, Trend Cloud) must pass if enabled.
When all active filters pass → Buy signal triggers.
Sell Signal Conditions
EMA 9 < EMA 21 (trend bearish)
Same filtering process but for bearish conditions.
When all active filters pass → Sell signal triggers.
5. Trade Execution & Management
When a signal triggers:
Lot size is auto-calculated based on risk % and SL distance.
SL is placed beyond recent swing high/low + ATR buffer.
TP1 and TP2 are calculated from the SL using the reward-to-risk ratio.
Break Even: If enabled, SL moves to entry price after TP1 is hit.
Partial Close: If enabled, half of the position closes at TP1.
Trade Exit: Full exit at TP2, SL hit, or partial close at TP1.
6. Chart Display
Entry Line – Shows entry price.
SL Line – Red dashed line at stop loss level.
TP1 Line – Lime dashed line for TP1.
TP2 Line – Green dashed line for TP2.
PnL Labels – Displays real-time profit/loss in $.
Trade Box – Visual area showing trade range.
Pin Bar Shapes – Optional, marks Pin Bars.
7. Statistics Panel
Stats Header – Shows “Stats”.
Total Trades
Wins
Losses
Breakeven Trades
Total PnL
Can be reset or filtered by date.
8. How to Use
Load the Indicator in TradingView.
Select Gold (XAUUSD) on your preferred scalping timeframe (1m, 5m, 15m).
Adjust settings:
Use default gold scalping settings for quick start.
Enable/disable filters according to your style.
Wait for a Buy/Sell alert.
Confirm visually that all desired conditions align.
Place trade with calculated lot size, SL, and TP levels shown on chart.
Let trade run – the indicator manages Break Even & Partial Close if enabled.
9. Recommended Timeframes
Scalping: 1m, 5m, 15m
Day Trading: 15m, 30m, 1H
Swing: 4H, Daily (adjust settings accordingly)

Mayfair Fx Scalper✅ Mayfair FX Scalper — By EastWave Capital
The Mayfair FX Scalper is a precision-focused, closed-source indicator designed for short-term intraday trading, particularly scalping on lower timeframes such as 1-minute, 3-minute, and 5-minute charts. This tool is developed by EastWave Capital and is based on a combination of Relative Strength Index (RSI) extremes and specific candlestick structure patterns to detect potential exhaustion and reversal points in the market.
🔍 How It Works:
The algorithm operates by evaluating three core elements:
RSI Extremes:
RSI is calculated using default settings.
Buy signals are considered only when the RSI on the previous candle is below 22 (oversold), and the current candle is bullish, while the previous one was bearish.
Sell signals are considered when the RSI on the previous candle is above 78 (overbought), and the current candle is bearish, while the previous one was bullish.
Candle Confirmation Logic:
The system waits for candle confirmation (e.g., shift in bullish/bearish structure) rather than triggering signals based on RSI alone.
This avoids false triggers in strong trends and filters weak entries.
SL/TP Estimation (Visual):
While not automatically placing orders, the indicator can optionally display lines or small labels showing a Stop Loss at the previous swing high/low (±0.5) and TP levels at 1R, 2R, and 3R based on that stop.
These visual aids help traders plan risk/reward and exits manually.
📈 How to Use:
Timeframes: Best suited for 1M, 3M, and 5M charts
Markets: Works well on Gold (XAU/USD), Forex majors, Indices, and Crypto
Session: Performs best during high volatility sessions (London & NY)
Use Case:
Wait for a signal label to appear after a clear momentum move.
Confirm price action and trend context.
Use provided visual SL/TP labels or apply your manual RR planning.
Combine with structure breaks, FVG zones, or liquidity sweeps for confluence.
⚠️ Important Notes:
This indicator does not repaint.
No automatic trades are executed. Signals are visual.
Not intended for use in isolation; best when combined with proper trade management and confirmation tools.
Past performance does not guarantee future results. Always manage risk appropriately

Daily High/Low Close Breakout - GOLD### **Daily High/Low Close Breakout Indicator**
This indicator is a powerful tool for identifying potential breakout opportunities based on the previous day's price action. It's built on a unique time-based logic that defines key support and resistance levels for the trading day.
---
### **How the Indicator Works**
The indicator operates in two main phases:
1. **Calculation Period (00:00 to 16:30 Tehran Time):** The indicator first observes the price action from the start of the day until 16:30. During this time, it records the highest and lowest **closing prices** of all candles. The chart background is shaded gray to visually mark this period.
2. **Trading Period (16:30 to 16:30 the next day):** At 16:30, the highest and lowest close levels are finalized and drawn as horizontal lines. These levels then become the primary breakout zones for the next 24 hours. The indicator will generate signals whenever the price crosses these lines.
---
### **Trading Signals**
The indicator uses a simple and effective crossover logic for its signals:
* **BUY Signal:** A signal is generated when a candle's closing price **crosses above** the high close line.
* **SELL Signal:** A signal is generated when a candle's closing price **crosses below** the low close line.
---
### **Important Usage Guidelines**
For optimal performance, please follow these specific recommendations:
* **Timeframe:** This indicator is designed and optimized to be used exclusively on the **15-minute timeframe**. Using it on other timeframes may produce inconsistent or unreliable results.
* **Primary Asset:** The logic for this indicator was developed and backtested primarily for **Gold (XAUUSD)**. Its performance and win rate have been observed to be the most consistent on this asset.
* **Asset Restriction:** It is strongly recommended to **avoid using this indicator on other currency pairs or assets**, as it has not been optimized for their specific market behavior.
---
### **Disclaimer**
*This indicator is provided for informational and educational purposes only. It is not financial advice. Past performance is not a guarantee of future results. All trading decisions should be based on your own research and risk analysis. Always use proper risk management.*

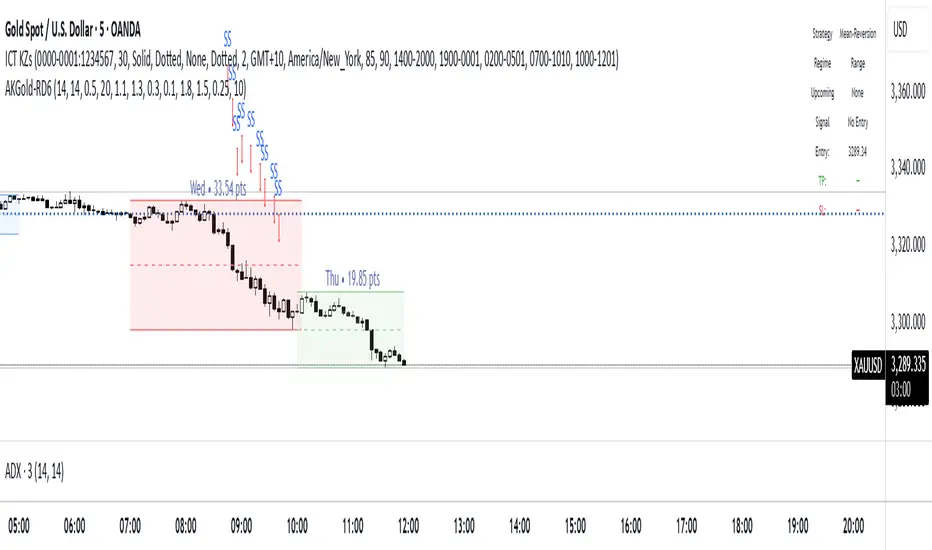
AK-GOLD - Regime Detection V6AK-GOLD - Regime Detection V6
AK-GOLD - Regime Detection V6
AK-GOLD - Regime Detection V6
AK-GOLD - Regime Detection V6
AK-GOLD - Regime Detection V6