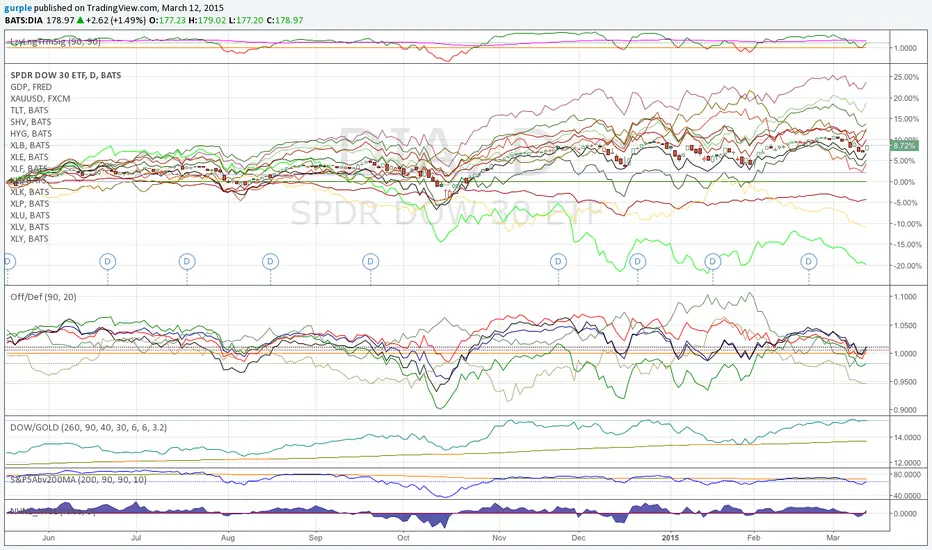
Correlation of chart symbol to different Index-ETF-currencyScript plots correlation of chart symbol to a variety of indexes, symbols, equities. ** Original idea was to find Bitcoin correlation, which I did not. Built in correlations are: Nikie, DAX, SPY, AAPL, US Dollar, Gold, EURUSD, USDCNY, EEM, QQQ, XLK, XLF, USDJPY, EURGBP
Cerca negli script per "GOLD"

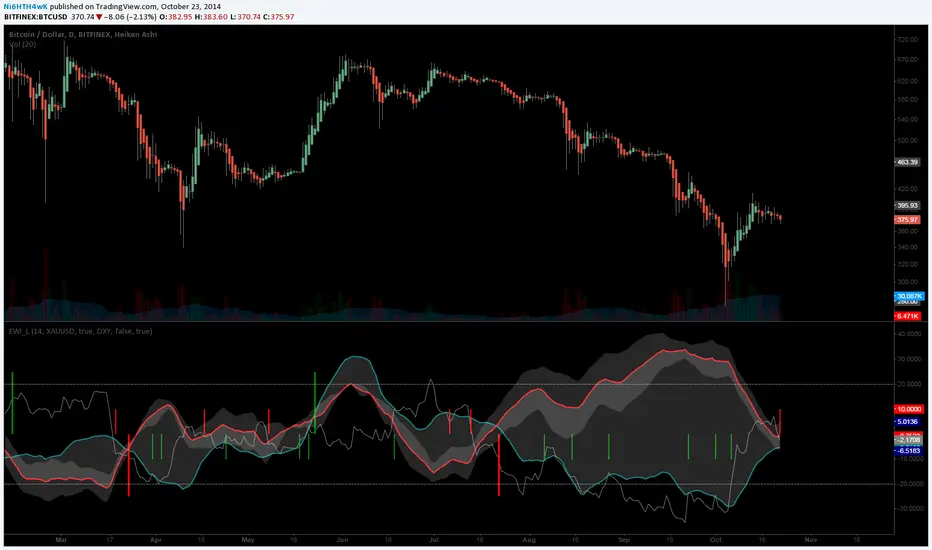
[LAVA] Early Warning IndicatorCombined the RSI inverse of gold to USD with the Dollar index (or whatever stock symbol that may be inverted/complementary) with another asset/currency, like bitcoin, you can basically be well informed when a potential move is on the horizon. Settings allow for inverse settings and de-combining the two pairs as well as a nice cloud look if all the lines get annoying.
BoaBias 3RSI(Custom) + Stats3RSI(Custom) + Stats
3RSI(Custom) + Stats is an advanced multi-RSI indicator for professional and active traders. It visualizes overbought/oversold conditions using three independently configured, smoothed RSI lines (defaults: 24, 14, 9), and provides unique statistics on how long your chosen asset stays in these extreme zones.
Key Features
Triple RSI Display: Simultaneously plots three customizable RSI lines, each with its own period and smoothing.
Dynamic Overbought/Oversold Highlights: Background color highlights only when any RSI is above the overbought level or below the oversold level—no clutter, just the key moments.
In-Panel Statistics Table: See current RSI values, and average streak length in overbought and oversold zones for each RSI, calculated over your chosen historical window (default: 360 bars). Table font size can be adjusted in settings for maximum readability.
Configurable Levels: Set your preferred levels for overbought/oversold zones, as well as additional mid-levels for more nuanced analysis.
Alerts: Instantly set up alerts for when any (or each) RSI enters an extreme zone. Never miss a key reversal setup.
How to Use
Use the indicator to objectively spot exhaustion and reversal points on any timeframe and asset.
The average streak statistics help you judge whether the market is behaving “normally” or if an extreme condition is being sustained.
Table with live RSI and stats makes your decision process faster and more data-driven.
Alerts allow you to stay informed even when you’re not watching the chart.
Settings
RSI Periods & Smoothing: Adjust all three lines independently to suit your strategy.
Overbought/Oversold Levels: Customize thresholds to fit your asset or timeframe.
Statistical Window: Define how many bars to use for calculating streak averages.
Font Size: Make the stats table readable on any screen size with adjustable font.
Summary
All-in-one solution for tracking momentum exhaustion with real statistical support.
Visual clarity: only shows what matters, when it matters.
Fully compatible with TradingView alerts for ultimate automation and risk management.
Questions or suggestions? Leave feedback in the comments!

Williams FractalsBoaBias Fractals High & Lows is an indicator based on Bill Williams' fractals that helps identify key support and resistance levels on the chart. It displays horizontal lines at fractal highs (red) and lows (green), which extend to the current bar. Lines automatically disappear if the price breaks through them, leaving only the relevant levels. Additionally, the indicator shows the price values of active fractals on the price scale for convenient monitoring.
Key Features:
Customizable Fractals: Choose between 3-bar or 5-bar fractals (default: 3-bar).
Period: Adjust the number of periods for calculation
Visualization: Red lines for highs (resistance), green for lows (support). Lines are fixed on the chart and persist during scrolling or scaling changes.
Alert System: Notifications for the formation of a new fractal high/low and for level breaks (Fractal High Formed, Fractal Low Formed, Fractal High Broken, Fractal Low Broken).
How to Use:
Add the indicator to the chart.
Configure parameters: select the fractal type (3 or 5 bars) and period.
Set up alerts in TradingView to receive notifications about new fractals or breaks.
Use the lines as levels for entry/exit positions, stop-losses, or take-profits in fractal-based strategies.
Troubleshooting: If Levels Are Not Fixed on the Chart
If the levels (fractal lines) do not stay fixed on the chart and fail to move with it during scrolling or scaling (e.g., they remain stationary while the chart shifts), this is typically due to the indicator's scale settings in TradingView. The indicator may be set to "No scale," causing the lines to desynchronize from the chart's price scale.
What to Do:
Locate the Indicator Label: On the chart, find the indicator label in the top-left corner of the pane (or where "BoaBias Fractals High & Lows" is displayed).
Right-Click the Label: Click the right mouse button on this label.
Adjust the Scale:
In the context menu, look for the "Scale" or "Pin to scale" option.
If it shows "Pin to scale (now no scale)" or similar, select "Pin to right scale" (or "Pin to left scale," depending on your chart's main price scale—usually the right).
Refresh the Chart: After changing the setting, refresh the chart (press F5 or reload the page), or toggle the indicator off and on again to apply the changes.
After this, the lines should move and scale with the chart during scrolling (horizontal or vertical) or zooming. If the issue persists, check:
TradingView Limits: The indicator may draw too many lines (maximum ~500 per script). If there are many historical fractals, older lines might not display.
Chart Settings: Ensure the chart is not in logarithmic scale (if applicable) or that auto-scaling is enabled.
Indicator Version: Verify you are using the latest script version (Pine Script v6) and check for errors in the TradingView console.
This indicator is ideal for traders working with Bill Williams' chaos theory or those seeking dynamic support/resistance levels. It is based on standard fractals but with enhancements for convenience: automatic removal of broken levels and integration with the price scale.
Note: The indicator does not provide trading signals on its own — use it in combination with other tools. Test on historical data before real trading.
Code written in Pine Script v6. Original template: Mit Nayi.

FVG Zones (Remove Filled) + AlertA powerful TradingView indicator that automatically identifies Fair Value Gap (FVG) zones, removes them once price “fills” the gap, and sends you crystal-clear alerts specifying Bull or Bear zones—so you never miss a market imbalance.
🔍 Key Features
Automatic FVG Detection
Spots three-candle imbalance patterns (low > high for Bull, high < low for Bear) and draws colored boxes on your chart.
Auto-Remove Filled Zones
Once price enters a gap, the corresponding box is deleted—keeping your chart clutter-free.
Dedicated Alerts
Two separate alert conditions with constant messages:
“Price filled Bull FVG zone”
“Price filled Bear FVG zone”
On-Chart Labels
Enable debugging to display Bull FVG or Bear FVG tags above the triggering candle.
Performance-Tuned
Supports up to 500 active zones without slowing down your chart.
⚙️ Inputs & Customization
Show Alert Labels (Boolean) – Toggle on-chart text labels.
Max Boxes Count (Integer) – Control the maximum number of zones displayed.

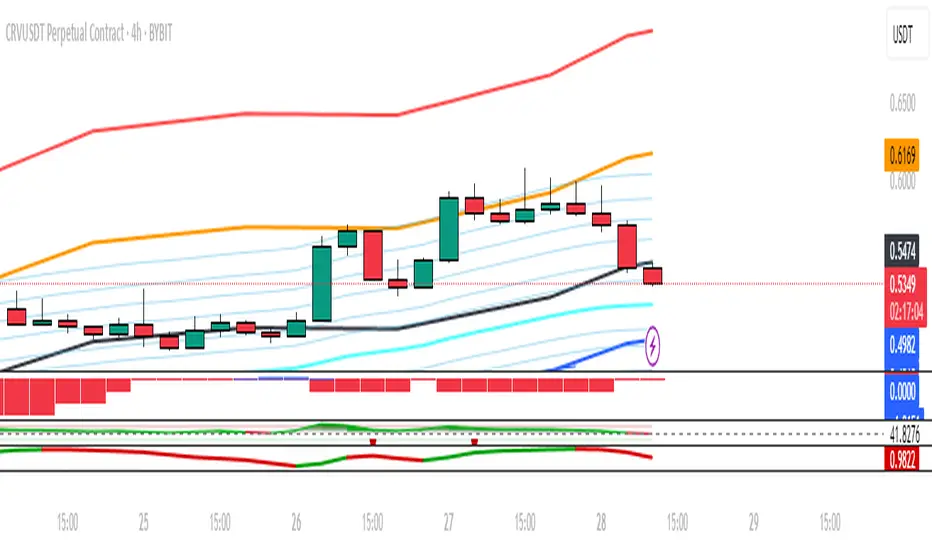
SMA Channel AlertsThe "SMA Channel with Alerts" indicator is designed to help traders visualize dynamic support and resistance zones based on a simple moving average (SMA). It computes the SMA on a user-specified timeframe and then applies user-configurable percentage deviations to generate a price channel. The channel consists of five lines:
Central SMA: The primary moving average (default is 12-period on a daily timeframe).
Upper Lines: Two lines plotted above the SMA, representing small and large positive percentage offsets.
Lower Lines: Two lines plotted below the SMA, representing small and large negative percentage offsets.
Key Features:
Customizable SMA:
Choose the SMA length.
Select the timeframe for the SMA calculation.
Specify the data source (default is closing price).
Adjustable Percentage Offsets:
Configure the upward offsets (small and large) as percentages.
Configure the downward offsets (small and large) as percentages.
Versatile Alert System:
Set alerts for price crossing any channel line upward or downward.
Receive individual alerts for each line when crossed in either direction.
A consolidated alert option for any crossing across all channel lines.
How to Use the Indicator:
Configuration:
Adjust the SMA settings (length, timeframe, source) to match your trading strategy.
Set your desired percentage deviations for the channel lines.
Alert Setup:
Open TradingView's alert creation window.
Choose the specific alert condition from the indicator (e.g., “Any Cross Upper Large (+)” or “Any Cross ANY Line”).
Configure your alert preferences (notification type, sound, etc.).
Trading Application:
Use the channel lines to gauge potential support and resistance levels.
Monitor the alerts for timely notifications when the price breaks through these key levels, signaling possible trend shifts or breakout opportunities.
This indicator is ideal for traders looking for a visual method to monitor price action relative to a moving average-based channel and to automate alert notifications for better trade timing.
Highly Optimized (Aroon, DMI, RWI)It is a highly optimized script for H4, D1. Backtests from (2016 - 2019, depending on the currency pair). Optimization still
going on.
Following alerts can be activated:
-
Buy-Signal (Baseline-Cross)!
Sell-Signal (Baseline-Cross)!
Buy Signal (Aroon)!
Sell Signal (Aroon)!
Buy Signal (DMI)!
Sell Signal (DMI)!
Buy Signal (RWI)!
Sell Signal (RWI)!
Can be used by the following pairs:
AUDCAD
AUDCHF
AUDJPY
AUDNZD
AUDSGD
AUDUSD
CADCHF
CADJPY
CHFJPY
CHFSGD
EURAUD
EURCAD
EURCHF
EURGBP
EURJPY
EURNZD
EURSGD
EURTRY
EURUSD
GBPAUD
GBPCAD
GBPCHF
GBPJPY
GBPNZD
GBPSGD
GBPUSD
NZDCAD
NZDCHF
NZDJPY
NZDUSD
SEKJPY
SGDJPY
USDCAD
USDCHF
USDCNH
USDJPY
USDSGD
USDTRY
XRPUSD
Price is 5€ per Month or 75€ lifetime. One week free for testing.

PriceLevels GBGoldbach Price Levels – Identify Algorithmic Key Zones
This open-source indicator is designed to help traders identify potential algorithmic key zones by highlighting price levels ending with specific numbers such as 03, 11, 29, 35, 65, and 71. These levels may act as inflection points or hesitation areas based on observed behavioral patterns in price movement.
What It Does:
📌 Scans and plots horizontal price levels where the price ends with one of the selected number combinations
🎯 Toggle on/off visibility for each number ending
🎨 Customize color and thickness for each level
🏷️ Shows price labels at the end of each line
🌗 Label styles (color/transparency) are adjustable for both dark and light chart themes
🧠 Why Use It:
This tool is ideal for discretionary traders who study market structure through static price anchors. It provides a visual reference for recurring numerical levels that may be used in algorithmic trading models or serve as psychological price zones.
⚠️ Disclaimer:
This script is open-source and intended for educational and analytical purposes only. No trading signals or performance guarantees are provided. Please use your own judgment when applying this tool in a trading context.

Daily Weekly Monthly Highs & Lows EVRTY CHARTGOLDEN LEVAL BY TRADER IMMU Daily Weekly Monthly Highs & Lows EVRTY CHART

GOLDEN SCALP DEXDescription:
This tool is designed for traders who want to capture momentum shifts that occur within larger timeframe structures. The strategy identifies unique breakout opportunities inside the HTF cycle and provides precise entry and exit signals without cluttering the chart.
The system focuses on:
Pinpointing immediate momentum breakouts
Clean chart visualization with intuitive buy/sell markers
Full backtesting capability through TradingView’s Strategy Tester
Customizable position sizing for futures, forex, and crypto traders
It is especially useful for traders who prefer fast, rule-based signals during high-impact intraday moves.
⚠️ Disclaimer: This is a trading tool, not financial advice. Results may vary depending on market conditions, and proper risk management is essential.

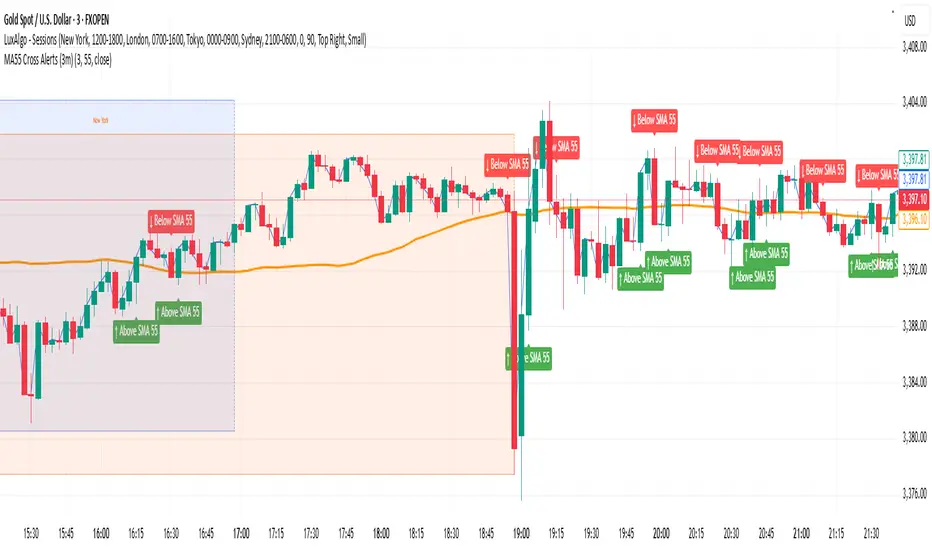
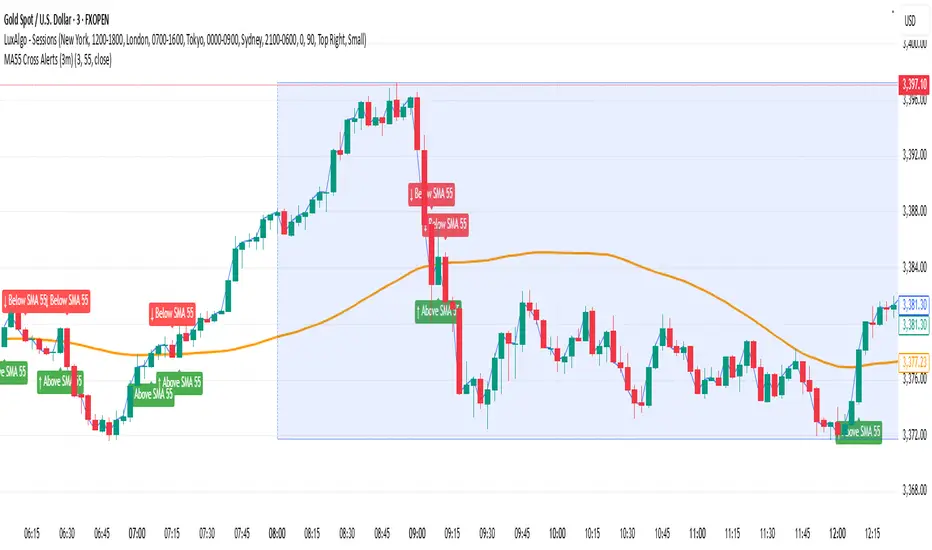
Gold MA55 Cross Alerts (3m) NavThis helps to find the best setup under the London and New York sessions.

Golden Lines[MedAlgo]## Overview
This custom TradingView indicator applies Fibonacci retracement and extension levels to logarithmic price scales, providing more accurate analysis for assets that exhibit exponential growth patterns. By utilizing logarithmic axes instead of linear ones, the indicator offers more relevant support and resistance zones for volatile assets like cryptocurrencies, high-growth stocks, and commodities that frequently move in percentage-based increments rather than absolute price movements.
## Key Features
- **Logarithmic Fibonacci Placement**: Automatically calculates Fibonacci levels based on logarithmic price distribution rather than linear values
- **Dynamic Level Adjustment**: Adjusts Fibonacci levels in real-time as prices move through logarithmic space
- **Custom Ratio Support**: Includes both traditional Fibonacci ratios (0.236, 0.382, 0.5, 0.618, 0.786, 1.0, 1.618, 2.618) and extended logarithmic-optimized ratios
- **Multi-timeframe Analysis**: Works across all timeframes while maintaining logarithmic consistency
- **Visual Alerts**: Color-coded zones show strength of price reactions at critical Fibonacci boundaries
- **Historical Backtesting**: Highlights how previous price action respected logarithmic Fibonacci levels
## How to Use
1. **IMPORTANT**: Ensure logarithmic scale is activated on your chart by clicking the "Log" button (marked as "L") in the bottom right corner of your chart
2. Add the indicator to your chart from the indicator menu
3. After adding the indicator, you'll be prompted to select:
- A high point (click on a significant peak)
- A low point (click on a significant trough)
4. The indicator will automatically draw all Fibonacci levels based on these two points
5. Lines will be drawn automatically on the chart, calculating the proper logarithmic Fibonacci ratios
6. No additional configuration is needed - the indicator automatically adapts to the logarithmic scaling
## Technical Explanation
The indicator transforms price data using natural logarithms before applying Fibonacci calculations. This approach acknowledges that percentage-based price movements appear as equal distances on logarithmic charts, making Fibonacci levels more relevant for identifying psychological and technical barriers in markets that move exponentially.
Unlike standard Fibonacci tools, this indicator:
1. Converts price to logarithmic values
2. Calculates Fibonacci sequences in log space
3. Maps these levels back to price chart display
4. Tracks reaction strength at each level
## Usage Guide
1. Select high and low points for your Fibonacci analysis
2. The indicator automatically draws the levels on logarithmic scale
3. Monitor price action as it approaches key logarithmic Fibonacci levels
4. Use color intensity to gauge the historical significance of each level
5. Set alerts for when price approaches logarithmic Fibonacci zones
## Interpretation
- **Strong Bounces**: When price strongly reacts at a logarithmic Fibonacci level, it often indicates a significant psychological barrier in percentage terms
- **Minimal Reaction**: Levels that show little price reaction may indicate logarithmic zones with less market interest
- **Confluence Areas**: Where multiple logarithmic Fibonacci levels converge from different timeframes, expect stronger support/resistance
- **Breakout Confirmation**: Price decisively moving through a significant logarithmic Fibonacci level often signals a strong trend continuation
## Best Applications
This indicator is particularly effective for:
- Cryptocurrency analysis
- High-growth technology stocks
- Commodities during trending markets
- Any asset that historically moves in percentage terms rather than absolute price
## Troubleshooting
- If Fibonacci levels appear distorted, verify that logarithmic scale is activated (check for highlighted "L" button)
- For best results, select major swing highs and lows that represent significant market turning points
- The indicator may need recalibration during extreme volatility events
Disclaimer
This indicator is provided for informational purposes only and should not be considered financial advice. Past performance is not indicative of future results. The signals generated are based on historical patterns and technical analysis, which may not always predict future market movements accurately. Trading involves substantial risk of loss. Always use proper risk management and consider using this indicator as part of a comprehensive trading strategy rather than as a standalone system. Test thoroughly before using with real capital.

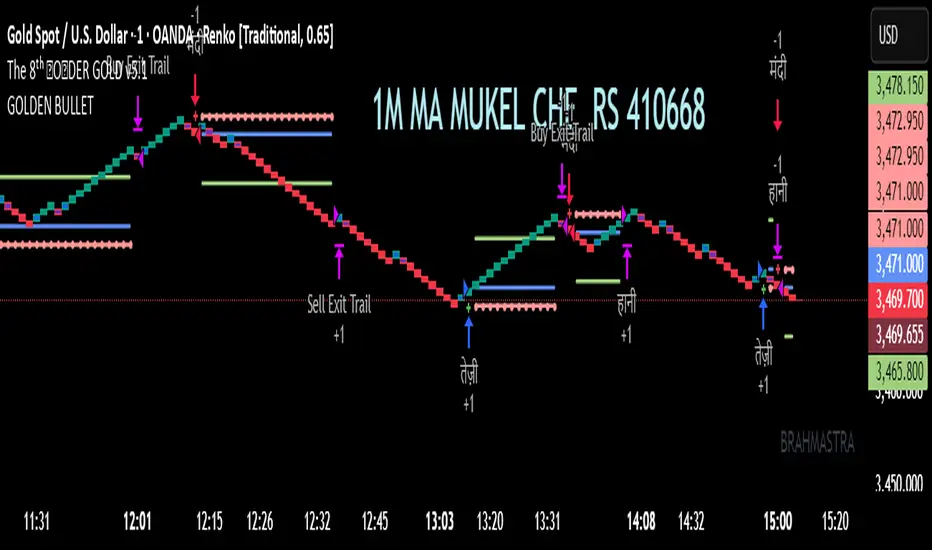
GOLDEN BULLETCandlestick Pattern Finder
Bullish Hammer
Bearish Hammer
Bullish Engulfing
Bearish Engulfing
Bullish Harami
Bearish Harami
Gold Option Signals with EMA and RSIIndicators:
Exponential Moving Averages (EMAs): Faster to respond to recent price changes compared to simple moving averages.
RSI: Measures the magnitude of recent price changes to evaluate overbought or oversold conditions.
Signal Generation:
Buy Call Signal: Generated when the short EMA crosses above the long EMA and the RSI is not overbought (below 70).
Buy Put Signal: Generated when the short EMA crosses below the long EMA and the RSI is not oversold (above 30).
Plotting:
EMAs: Plotted on the chart to visualize trend directions.
Signals: Plotted as shapes on the chart where conditions are met.
RSI Background Color: Changes to red for overbought and green for oversold conditions.
Steps to Use:
Add the Script to TradingView:
Open TradingView, go to the Pine Script editor, paste the script, save it, and add it to your chart.
Interpret the Signals:
Buy Call Signal: Look for green labels below the price bars.
Buy Put Signal: Look for red labels above the price bars.
Customize Parameters:
Adjust the input parameters (e.g., lengths of EMAs, RSI levels) to better fit your trading strategy and market conditions.
Testing and Validation
To ensure that the script works as expected, you can test it on historical data and validate the signals against known price movements. Adjust the parameters if necessary to improve the accuracy of the signals.

Golden Point IndicatorThe Spring Strategy, a well-regarded technique, is employed by skilled traders to detect potential shifts in market trends. This methodology is particularly effective in identifying instances where prices appear to breach critical support or resistance levels, only to dramatically rebound in the opposite direction, creating what is known as a "spring" pattern or a false breakout. This distinctive pattern serves as a harbinger of diminishing trend momentum and an imminent reversal in market direction.
In a bearish market context, the Spring Strategy materializes when an asset's price plunges below a vital support level. This prompts a wave of selling activity as traders react, leading to a further decline in price. However, this selling pressure eventually subsides, and the price experiences a sharp recovery, springing back above the support level. This resurgence presents a compelling opportunity for traders to enter the market at a more favorable price point.
Conversely, during bullish market conditions, the Spring Strategy is observed when an asset's price surges beyond a significant resistance level. This stimulates widespread buying interest among traders, propelling the price even higher. Nevertheless, this buying fervor abates, and the price retraces, springing back below the resistance level. This dip creates an advantageous selling opportunity, enabling traders to short the market with a potentially favorable risk-reward profile.
How to use or benefit from script:
For Long position :
Add script to chart for any time frame. script will calculate and look for any candle with fake break out. When detected it will wait until detecting a new candle closing higher than the high of fake break out candle. a buy alert is sent and shown. So traders can go long and specify risk / reward target.
For short position :
Add script to chart for any time frame. script will calculate and look for any candle with fake break out. When detected it will wait until detecting a new candle closing lower than the low of fake break out candle. a sell alert is sent and shown. So traders can go short and specify risk / reward target.
Advantages of Embracing the Spring Strategy
The Spring Strategy bestows traders with the advantage of identifying potential buying and selling scenarios while mitigating associated risks. By strategically awaiting the "spring back" to the initial breakout level, traders can avoid premature market entry and thereby reduce the likelihood of incurring losses.
Application and Implementation
Traders adeptly harness the Spring Strategy to decipher impending reversals. Should this pattern manifest following an uptrend, traders may opt to exit their long positions or initiate short positions, anticipating a transition towards a downtrend. Conversely, if the Spring Strategy unfolds post a downtrend, traders might liquidate their short positions or embark on long positions, foretelling an eventual shift to an uptrend.
Deconstructing the Consolidation Strategy
To begin, traders should pinpoint a period marked by price consolidation or a trading range. Within this phase, prices oscillate within a confined range over an extended duration. At the core of the Spring Strategy lies an abrupt, decisive movement—either above or below the confines of the trading range. This movement is often accompanied by heightened trading volume.
However, rather than perpetuating the momentum in the same direction, prices promptly recoil and re-enter the trading range. This swift and resolute recovery signifies the "spring" phase of the pattern, signifying market rejection of the transient price movement and the amplification of buying or selling pressure.
Traders may use the Spring Strategy as a cue to enter buy or sell positions, indicative of robust demand or supply for the asset near the upper or lower price threshold. It's imperative, however, to complement this strategy with supplementary indicators and manage risk judiciously to curtail potential losses.
Disclaimer
The content within my Scripts, Indicators, Ideas, Algorithms, and Systems is not intended as financial advice or an invitation to trade or invest in any securities. I disclaim liability for any losses or damages, including loss of profit, arising directly or indirectly from reliance on the information provided.
All investments entail risks, and past performance of securities, industries, sectors, markets, financial products, trading strategies, backtests, or individual trading does not guarantee future outcomes or returns. Traders bear full responsibility for their investment choices, predicated on their financial circumstances, objectives, risk tolerance, and liquidity requirements.
My Scripts, Indicators, Ideas, Algorithms, and Systems are purely for educational purposes!

Golden Swing StrategyBuying Conditions
RSI should be 50 or above
Stochastic %K should be above %D
Day Low Should be below SuperTrend
SuperTrend should remain green before & EOD
SuperTrend should be below Mid Bollinger
Buy next day at open or within 0.5xATR(previous day) of SuperTrend with 1.1ATR SL & 2.2 ATR target
Selling Conditions
RSI should be 50 or below.
Stochastic %K should be below %D
Day high Should be above SuperTrend
SuperTrend should remain Red before & EOD
SuperTrend should be above Mid Bollinger
Sell next day at open or within 0.5xATR (previous day) of SuperTrend with 1.1xATR SL & 2.2x ATR target

Golden Mile indicatorThis indicator is based on several different collectively calculated indicators which are already used by many traders.
These include:
RSI
MFI
WaveTrend
Stochastics, and a few more bits i've thrown in.
This indicator can be used on any time frame, and is highly effective at helping decide whether the pressure lies in Buys or Sells.
free access..
Enjoy! :)

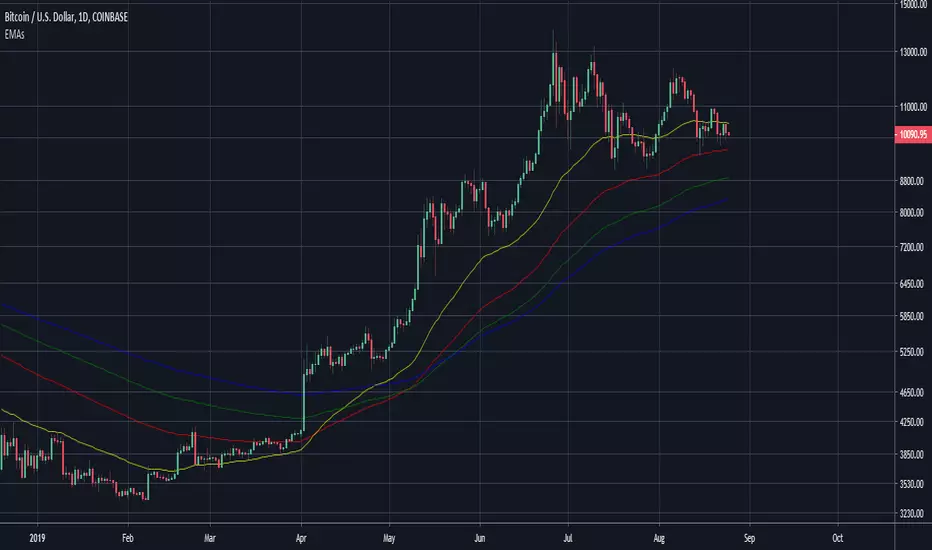
Golden Ratio MultiplierThe moving averages 350 and 111 by themselves do a great job of identifying market tops/bottoms. The fraction 350/111 is very close to Pi as well (3.15) so that's is suspicious in its own right.
Nonetheless, fibonacci retracements/multiplies of the 350 SMA does a remarkable job of finding reversal points. I commented out a couple of multiplies for simplicity's sake (the lines became rather crowded). However, the script is open source so you all can copy it into Pine Editor and delete the "//" and add it back to the script.
Cheers.

Golden Ratio Fibs - SimpleThere are a lot of these on the market, but I simplified the lines to the one that matter, fixed the colours and added two types of sell signal.
