ASX300 Golden Cross stock alerts (A2M-ANZ)Golden Cross happens when the SMA50 crossover the SMA200, which usually signals profitable bullish trend and good buy entry. For example, for Aurelia Metals the Golden Cross buy signal had 250% buy and hold profit in about a year.
This indicator hunts for the Golden Cross of the first 20 stocks in the ASX300 (A2M to ANZ), once it it happens the indicator plots the name of the stock that had Golden cross which could be use as entry for that stock. As you can see various stocks were plotted in the chart, those had crossedover at the time of plotting.
Due to TradingView Pinescript limitations, only 20 stocks can be watched in one indicator. Therefore 15 Golden Cross indicators are required to watch the entire ASX300.
This can also be applied to crypto coins with some adjustments in the script, so you can be alerted of the Golden Cross in crypto coins and buy bullish coins.
Cerca negli script per "GOLD"

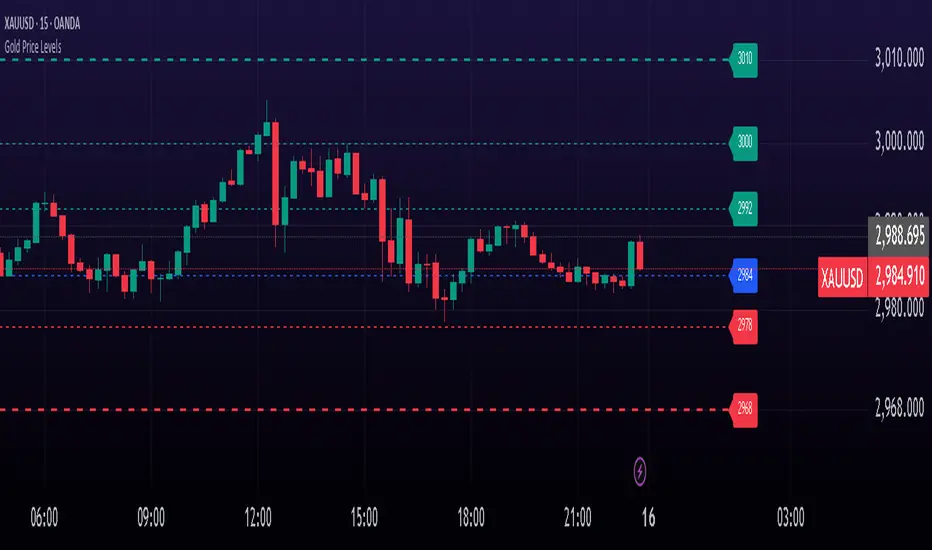
Gold Price LevelsThis indicator identifies and displays key price levels for gold trading. It highlights important psychological and technical price points that often act as support and resistance levels.
Features
Automatically identifies and displays key price levels ending in 92, 84, 78, 55, 42, 27, and 00
Special emphasis on critical levels ending in 68, 32, and 10 with increased line width
Color-coded visualization: green for levels above current price, red for levels below
Customizable line style, width, and label visibility
Automatically adjusts to different price ranges (works with any gold price)
How to Use
This indicator helps gold traders identify potential support and resistance zones. Watch for price reactions at these levels for potential trade entries, exits, or stop placement. The thicker lines (68, 32, 10) often represent more significant price levels where stronger reactions may occur.
Perfect for both day traders and swing traders looking to optimize their gold trading strategy with key price levels.
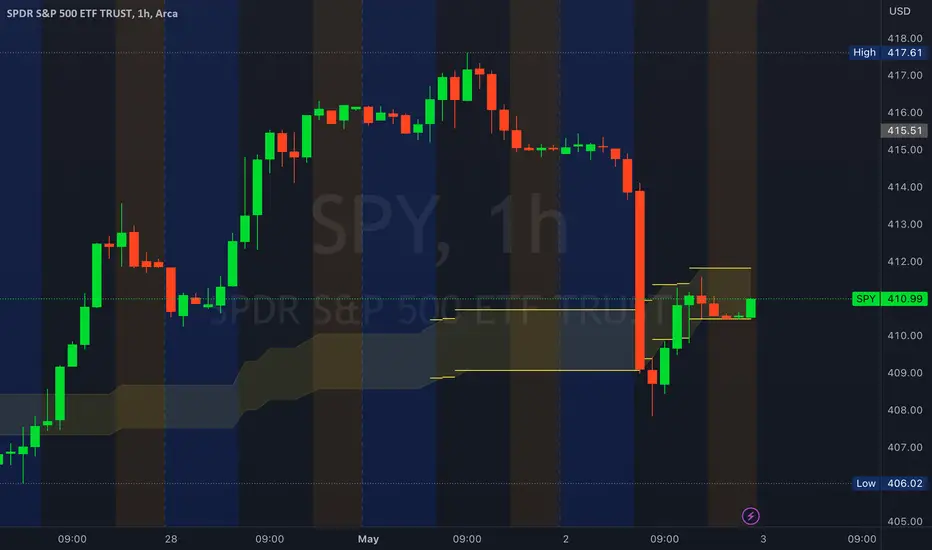
Golden ZoneIntroducing the "Golden Zone" indicator, a powerful tool that simplifies the Fibonacci indicator by creating a clear Golden Zone to identify potential future price movements. The Golden Zone is a supply or demand zone that corresponds to the 61.8% and 50% Fibonacci retracement levels. These levels are important because they often mark zones where the price reacts, making it an essential area for traders to watch.
The script plots the Fibonacci levels in the background, enabling traders to identify potential support and resistance levels quickly. The Golden Zone is highlighted with a yellow filled area, making it easy to spot on the chart. Traders use this zone to identify areas where the stock price may react, either bouncing off the support level or encountering resistance at the resistance level.
For example, if a stock price is moving up and reaches the Golden Zone, a trader may look for signs of resistance and consider selling the stock if the price begins to move back down. Conversely, if a stock price is moving down and reaches the Golden Zone, a trader may look for signs of support and consider buying the stock if the price begins to move back up.
The "Golden Zone" indicator is highly versatile and can be used in all markets, whether you are a swing trader or a day trader. It can be combined with other strategies, such as an EMA crossover strategy or price action, or as an area of confluence.
In summary, the "Golden Zone" indicator is a must-have tool for traders looking to identify potential price movements and locate key support and resistance levels. Its user-friendly inputs and clear display make it a valuable addition to any trading arsenal.
So, the "Golden Zone" indicator is like a magic tool that helps people who trade in the stock market find valuable things to buy or sell. And with its ability to identify key support and resistance levels, it can help traders make better-informed decisions when buying or selling stocks.
I hope you like it!
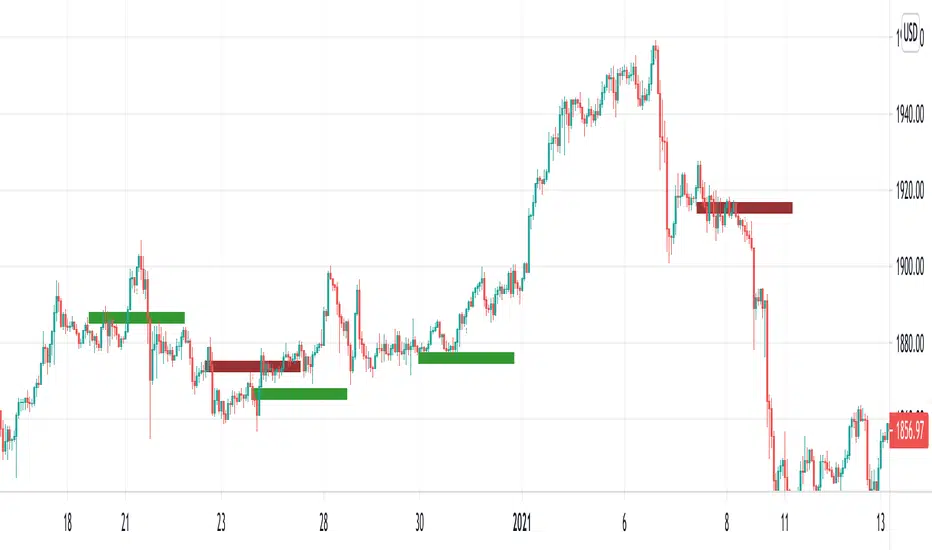
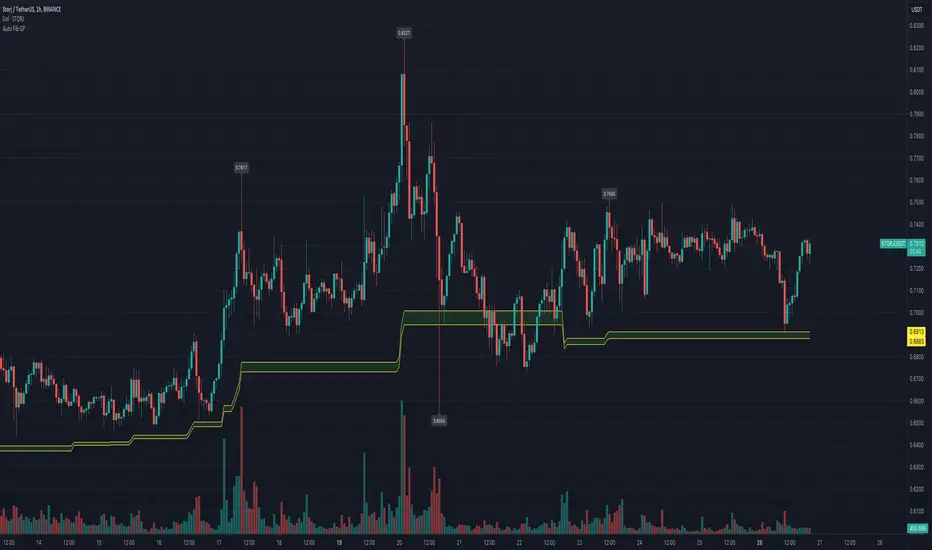
Golden PocketGolden Pocket
This marks up the fibonacci retracement levels of 0.65 and 0.618 by default, these levels are often referred to as the golden pocket.
They are known by this because when price has an impulse either to the up or downside, price will end up retracing at some point. This Golden pocket often lines up with other means of confluence where it's considered a good entry price from the retrace.
Unlike standard fib retracement indicators, these boxes will extend with current price until they are hit. As well as this, there is a moving average filter which you can set to higher timeframes meaning that you can choose to only look for golden pockets which are following the higher time frame trend. You can easily monitor all of your settings by setting up just 1 alert.
Settings
You have the option to enable/disable the line which marks out the pivot points the fib is being calculated from, you can also change the colour and style of the line.
Below this you have the option to choose what colour the fib boxes are and what colour they change to once price hits it. If you want them to disappear change the colours opacity to 0%.
If you want to change the golden pocket levels you can do that by changing the 0.618 or 0.65 levels in the settings.
The pivot distance controls what part defines a pivot high or low, it must be the highest/lowest to the left/right of the pivot candle count.
MA filter will only accept golden pockets which are trending with the Moving average.
You can change all the settings of the Moving average which acts as a filter including which timeframe it is calculated on.
Alerts
Simply toggle this on int the settings and then click on the 3 dots next to the indicators name, 'add alert', leave the top boxes as they are, you can name the alert anything you like but once you confirm this, it will monitor all golden pockets on the particular asset and timeframe you are looking at. The alerts are set up to trigger as soon as price touches one of the boxes.
Use Cases
We like setting are moving average up on the daily timeframe and using the Moving average filter so we know we are only trading with the higher timeframe trend. From there we can set up alerts on any lower timeframe.
Feel free to use any part of this script in your own code, please just give us a mention so we can check out your contributions to the community as well!
Happy to take in any suggestions or ways of improving

T3 Gold Sniper [RickAtw]Gold Sniper based on support and resistance looks for a sniper entry for trades. Used together with EMA
Key signal
Buy ------> Green Line
Sell ------> Red Line
Functional
The system was made for gold and everything is tuned for it.
I am a professional investor and I test each system for how long. If the system makes an income, it gets to my page. Use it for gold, cryptocurrencies and pairs AUD/USD GBP/USD
Golden Cross by -Westy-Quick Guide
- Yellow cross and green MA on top = Potential uptrend
- Yellow cross and red MA on top = Potential downtrend
A simple golden cross indicator of the green 50 and red 200 SMA with a yellow cross for ease of visibility and backtesting.
Generally, longer time frames more powerful signals but are less frequent. I typically use it on the 4 hour, daily and weekly.

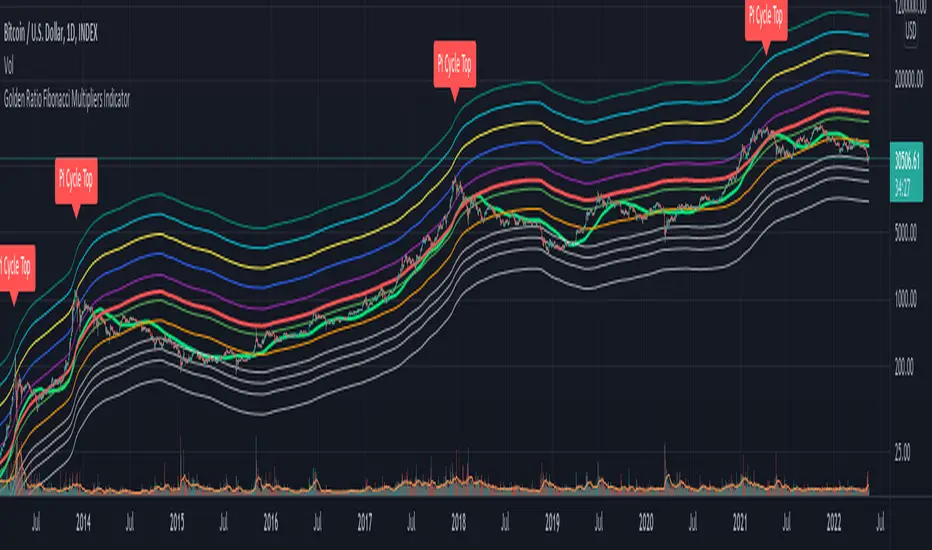
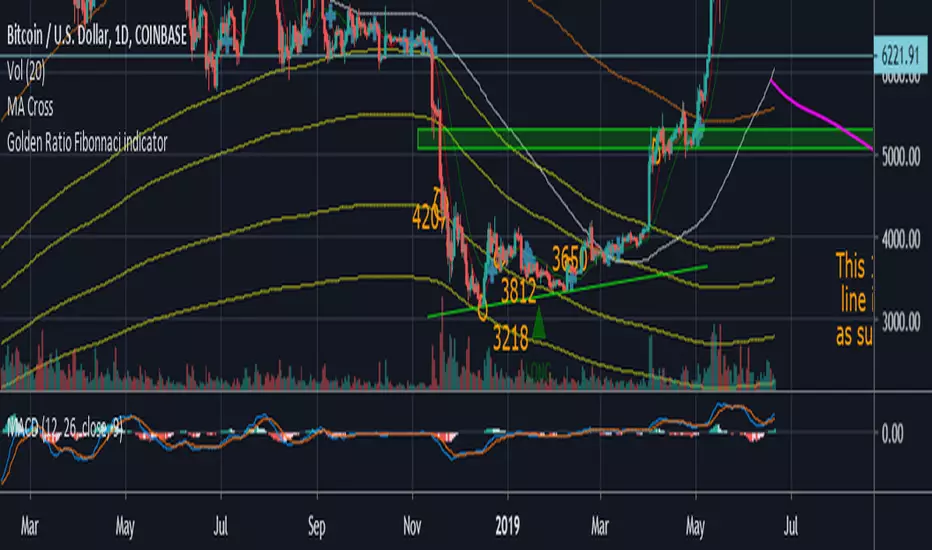
Golden Ratio Fibonacci Multipliers IndicatorBased on "The Golden Ratio Multiplier" article by Philip Swift (@PositiveCrypto) on Medium.
Golden Ratio Fibinnaci IndicatorI didn't see this one already it isn't my original idea either. I pulled the formula's from an article on medium, I also added few bear market bottom fib indicators.
Credit to the article I pulled the formula from.
The Golden Ratio Multiplier
Unlocking the mathematically organic nature of Bitcoin adoption
Go to the profile of Philip Swift (@PositiveCrypto)
Philip Swift (@PositiveCrypto)
Jun 17, 2019
By Philip Swift
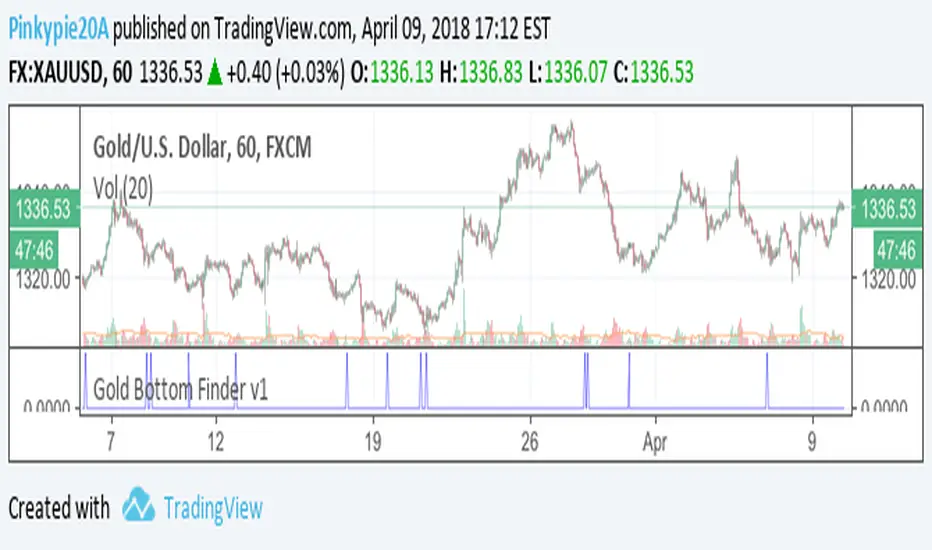
Gold Bottom Finder v1For the gold bugs, Bottom Finder Gold edition v1 script. If you would like to try it out, please post your access requests below.
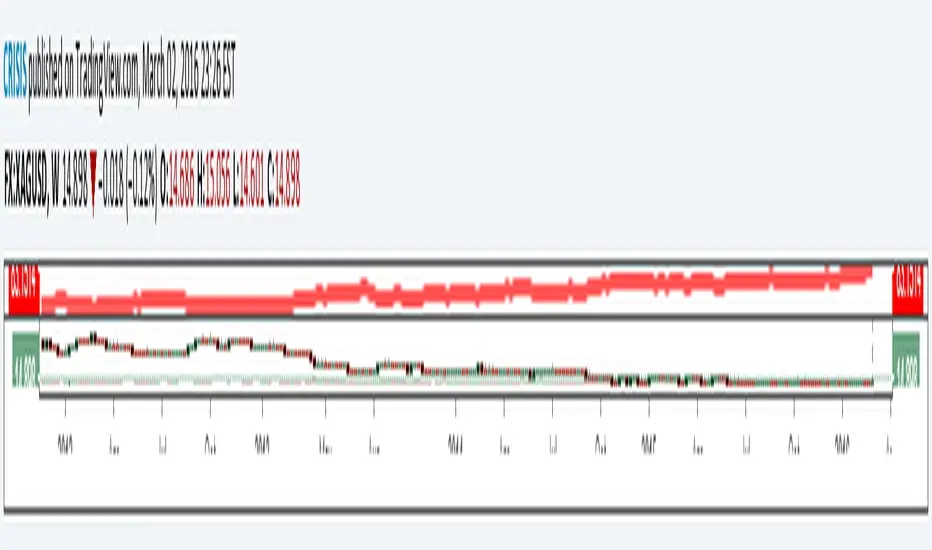
Gold/Silver RatioOverview
This indicator displays the Gold/Silver Ratio by dividing the price of gold (XAUUSD) by the price of silver (XAGUSD) on the same timeframe. It is a widely used tool in macroeconomic and precious metals analysis, helping traders and investors evaluate the relative value of gold compared to silver.
📈 What it does
Plots the ratio between gold and silver prices as a line on the chart.
Displays two key horizontal levels:
Overbought level at 90 (dashed red line).
Oversold level at 70 (dashed green line).
Highlights the chart background to show extreme conditions:
Red shading when the ratio exceeds 90 (gold is likely overvalued relative to silver).
Green shading when the ratio drops below 70 (silver is likely overvalued relative to gold).
🧠 How to Use
When the ratio exceeds 90, it suggests that gold may be overbought or silver may be undervalued. Historically, these have been good times to consider shifting exposure from gold to silver.
When the ratio falls below 70, it may indicate silver is overbought or gold is undervalued.
This tool is best used in conjunction with technical analysis, macroeconomic trends, or RSI/Bollinger Bands applied to the ratio.
⚙️ Inputs
This version of the script uses OANDA's XAUUSD and XAGUSD pairs for spot gold and silver prices. You may edit the request.security() calls to change data sources (e.g., FXCM, FOREXCOM, or CFD tickers from your broker).
✅ Best For:
Macro traders
Commodity investors
Ratio and spread traders
Long-term portfolio reallocators

GOLD MonitorI'm using this platform from sometime and I carry out trading on Gold, using a kind of scalping strategy.
Scalping is not an easy task to do. Personally I found a lot of problems while detecting the trend direction.
So I decided to develop an indicator that is capable, in a discrete way, to give an instant-view on the market that is interesting.
This indicator can summarize in a small table all interesting figures related to gold scalping trading and is useful while joined with technical and fundamental analysis.
In this way it is possible to easy take under control all important aspects related to gold trading that I summarize here and you can find inside the table:
1) Gold / USD current direction
2) USD dollar strength (instant DXY) indicator take under consideration the DXY value every each tick and measures the increase or decrease in percentage. If there is a decrease the indicator displays a red low arrow, if there is an increase the indicator displays a green high arrow
also Gold friends are important so it is possible to find also:
3) NZDUSD (that is a Gold friend) variation percentage. If there is a decrease the indicator displays a red low arrow, if there is an increase the indicator displays a green high arrow
4) AUDUSD (that is a Gold friend) variation percentage. If there is a decrease the indicator displays a red low arrow, if there is an increase the indicator displays a green high arrow
then it is possible to find DXY USD dollar strength calculated between previous period (e.g. in timeframe M5 last 5 minutes) and current period (current 5 minutes). This indication is represented by an high arrow if there has been an increase, or by an low arrow if there has been a decrease.
Last but not least the information about the Gold trend itself with the possible forecast for the current period. This information must be carefully interpreted together with other instruments for technical analysis like Fibonacci lines.

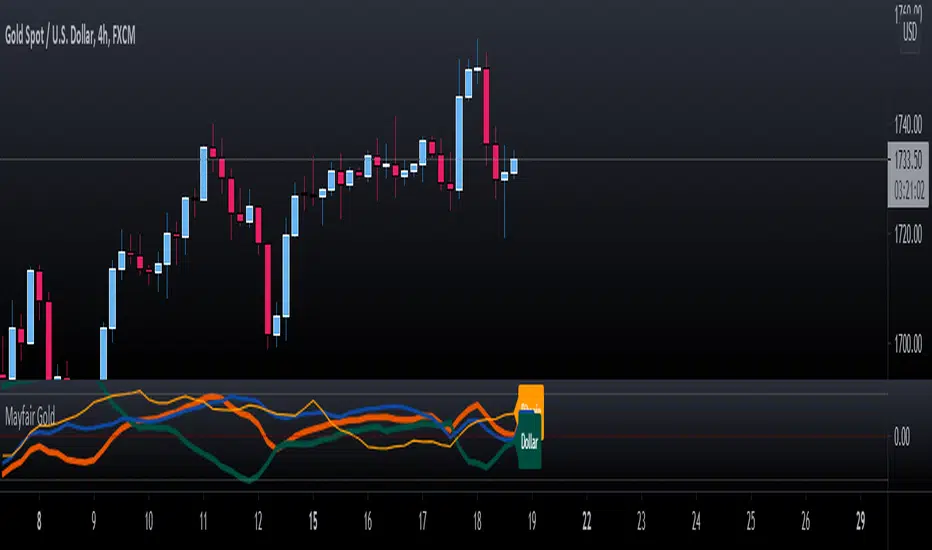
Mayfair GoldGold Oscillator using SPX & DXY to measure the moving average cross of the 3.
Gold in Orange
DXY in Green
SPX in Blue
To use this indicator, you need to see the strength (Orange above the 50%) line, use your own configurations and settings for the two MA's as a cross.
The idea is not to enter trades but to know when either SPX or/and DXY is getting stronger or weaker to help with profit-taking of gold positions.
As per any Oscillator - look for patterns, cross-overs and momentum shifts. (Treat like a MACD, RSI or Stochastic).
gold price levels denominated in usd/gramsPlots the gold price (USD) for the quantities (grams) identified as support or resistance in the indicator settings. Default values are:
75 gold grams
300 gold grams
500 gold grams
1000 gold grams
5000 gold grams
More context: The purchasing power of Bitcoin

Gold-Stocks RatioA historic risk-off flag.
When the Gold-Stocks Ratio is above the 200 week moving average, investors may fair better holding gold and avoiding equities, as was the case for the last 20 years.

[RS]Gold to Custom Currency V0Request for: sankar2389
Gold conversion from dollar to INR and to grams.
MATA GOLD RATIOMata Gold Instrument: User Guide
The Instrument to Gold Oscillator is a technical analysis tool that normalizes the ratio of an instrument's price (e.g., BTC/USD) to the price of gold (XAU/USD) into a 0-100 scale. This provides a clear and intuitive way to evaluate the relative performance of an instrument compared to gold over a specified period.
---
How It Works
1. Calculation of the Ratio:
The ratio is calculated as:
\text{Ratio} = \frac{\text{Instrument Price}}{\text{Gold Price}}
2. Normalization:
The ratio is normalized using the highest and lowest values over a user-defined period (length), typically 14 periods:
\text{Normalized Ratio} = \frac{\text{Ratio} - \text{Min(Ratio)}}{\text{Max(Ratio)} - \text{Min(Ratio)}} \times 100
3. Overbought/Oversold Levels:
Above 80: The instrument is relatively expensive compared to gold (overbought).
Below 20: The instrument is relatively cheap compared to gold (oversold).
---
How to Use the Oscillator
1. Identify Overbought and Oversold Levels:
If the oscillator rises above 80, the instrument may be overvalued relative to gold. This could signal a potential reversal or correction.
If the oscillator falls below 20, the instrument may be undervalued relative to gold. This could signal a buying opportunity.
2. Track Trends:
Rising oscillator values indicate the instrument is gaining value relative to gold.
Falling oscillator values indicate the instrument is losing value relative to gold.
3. Crossing the Midline (50):
When the oscillator crosses above 50, the instrument's value is gaining strength relative to gold.
When it crosses below 50, the instrument is weakening relative to gold.
4. Combine with Other Indicators:
Use this oscillator alongside other technical indicators (e.g., RSI, MACD, STOCH) for more robust decision-making.
Confirm signals from the oscillator with price action or volume analysis.
---
Example Scenarios
1. Trading Cryptocurrencies Against Gold:
If BTC/USD's oscillator value is above 80, Bitcoin may be overvalued relative to gold. Consider reducing exposure or looking for short opportunities.
If BTC/USD's oscillator value is below 20, Bitcoin may be undervalued relative to gold. This could be a good time to accumulate.
2. Commodities vs. Gold:
Analyze the relative strength of commodities (e.g., oil, silver) against gold using the oscillator to identify periods of overperformance or underperformance.
---
Advantages of the Oscillator
Relative Performance Insight: Tracks the performance of an instrument relative to gold, providing a macro perspective.
Clear Visual Representation: The 0-100 scale makes it easy to identify overbought/oversold conditions and trend shifts.
Customizable Periods: The user-defined length allows flexibility in analyzing short- or long-term trends.
---
Limitations
Dependence on Gold: As the oscillator is based on gold prices, any external shocks to gold (e.g., geopolitical events) can influence its signals.
No Absolute Buy/Sell Signals: The oscillator should not be used in isolation but as part of a broader analysis strategy.
---
By using the Instrument to Gold Oscillator effectively, traders and investors can gain valuable insights into the relative valuation and performance of assets compared to gold, enabling more informed trading and investment decisions.

Automatic Fibonacci Retracement Golden Pocket (GP)Main info
This script automatically draws you the Fibonacci retracement level called golden pocket from the latest detected pivot point to the actual price. This level is very popular among traders because the price tends to reverse on this level pretty often. You should use this on higher timeframes 15m+.
It is good to keep in mind that this level alone is not enough, you should still have another level there to enter the trade, for example golden pocket in combination with a demand zone is pretty solid. :)
Settings
The length for pivot point calculation is available in the script settings.
You can enable inverted golden pocket (for shorts)
You can hide/show the pivot point labels
If you want any updates, just feel free to write me :)
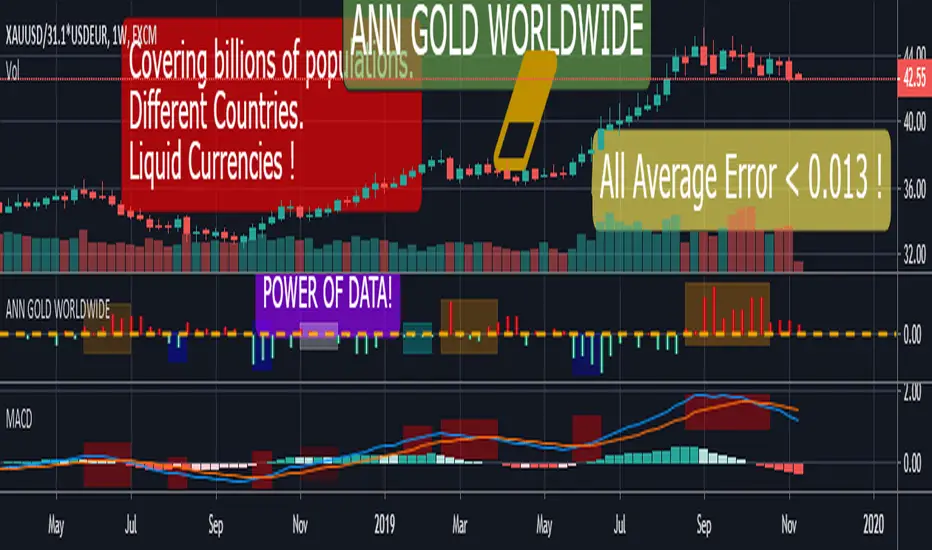
ANN GOLD WORLDWIDE This script consists of converting the value of 1 gram and / or 1 ounce of gold according to the national currencies into a system with artificial neural networks.
Why did I feel such a need?
Even though the printed products in the market are digitally circulated, only precious metals are available in full or near full.
Silver is difficult to carry because you have to buy too much because the unit price is low.
Platinum is very difficult to find and used in industry.
Gold is both practical and has less volatile movements, even more balanced than dollars, to preserve the value of money.
Uncertainty and tensions benefit gold.
Obviously this is my own opinion and is not worth the investment advice:
If there is to be an economic crisis, it is obvious that the dollar will rise against the emerging currencies, but I expect a crisis where gold and the dollar will rise together.
The world has been on a mercantilist line more than ever!
Spot gold can be bought from goldsmiths and banks.
I think this command will benefit people everywhere but in economies that are subject to developing currencies.
Now we can look at the details:
All you have to do is load the appropriate chart and select it from the menu.
Thus, the system will adjust itself to that instrument.
MENU and Tickers :
"GOLD" : XAUUSD or GC1! or GOLD (Average error = 0.0128)
"GOLDSILVER" : XAUXAG or GOLDSILVER (Gold Silver Ratio ) ( Average error : 0.01 )
"GOLD CZK " : XAUUSD/USDCZK ( 1 Ounce Gold Czech Koruna) ( Average error = 0.010879 )
"GOLD NZD " : XAUUSD/USDNZD ( 1 Ounce Gold New Zealand Dollar ) (Average error = 0.010736 )
"GOLD EURO" : XAUUSD/USDEUR ( 1 Ounce Gold Euro) ( Average error = 0.010000 )
"GOLD HUF " : XAUUSD/USDHUF ( 1 Ounce Gold Hungarian Forint ) ( Average error = 0.010000 )
"GOLD INR " : XAUUSD/USDINR (1 Ounce Gold Indian Rupee ) (Average error = 0.010458 )
"GOLD DKK" : XAUUSD/USDDKK (1 Ounce Gold Danish Krone) (Average error = 0.010671 )
"GOLD CHF" : XAUUSD/USDCHF (1 Ounce Gold Swiss Franc ) (Average error = 0.010967 )
"GOLD CNH" : XAUUSD/USDCNH(1 Ounce Gold Offshore RMB) (Average error = 0.012017 )
"GOLD MXN" : XAUUSD/USDMXN(1 Ounce Gold Mexican Peso) (Average error = 0.010000 )
"GOLD PLN" : XAUUSD/USDPLN (1 Ounce Gold Polish Zloty ) (Average error = 0.010173 )
"GOLD ZAR" : XAUUSD/USDZAR (1 Ounce Gold South African Rand (Average error = 0.010484 )
"GOLD NOK" : XAUUSD/USDNOK (1 Ounce Gold Norwegian Krone ) (Average error = 0.010842 )
"GOLD TRY" : XAUUSD/USDTRY (1 Ounce Gold Turkish Lira ) (Average error = 0.010000 )
"GOLD THB" : XAUUSD/USDTHB (1 Ounce Gold Thai Baht ) (Average error = 0.011747 )
Important note : XAUUSD/USDCUR = 1 Ounce Gold , XAUUSD/31.1*USDCUR = 1 gram Gold (CUR = Currency )
If you want to physically hold it, look gram value, because as far as I know, all goldsmiths and jewelleries in the world are selling gram gold.
I think that this command is the most useful and the concrete one that I have ever written.
I end my sentences with this anonymous proverb :
"Even if gold falls into the mud, it's still gold ! "
Fibonacci Retracement (S)-GoldThe Automatic Fib Retracement-Gold script indicates the 38.2%, 50%, 61.8% and 65% pullback regions.
The lines of the upper and lower pivots , the support and resistance areas are also highlighted as well as the Golden Pocket.
Customisable Fib Length - Time period over which max and min pivots are chosen.
Offsetfib - Automatically offsets the pivots and sell zone as your entry position
will be some time after the upper and lower pivots are set.
Works well when used in combination with an oscillator which highlights Divergence.
A strategy based off buying the 50-618 with a defined stop loss the other side of the 65 can easily be formulated. This tool will automatically plot those points but a defined Risk Management strategy will always be needed.
The 382 region can also be plotted, allowing for lesser retracements coinciding with wave 4 pullbacks (Elliott Wave Traders).
Works best in Bearish trends but will work on all timeframes ( Bearish correction in an uptrend also possible).
Previous pivots shown but be careful to identify which of the several pivots you are using.
Start at a larger timeframe and move down. (Entries consistent on several timeframes are golden)
Pivots and retracements are dynamic. Be sure to note your entry and targets.

Hopiplaka Goldbach System with SignalsAn advanced mathematical trading system that combines Goldbach Conjecture prime number theory with PO3 (Power of 3) range analysis and Tesla Vortex algorithms. This indicator identifies high-probability price levels and generates trading signals based on mathematical harmony and multi-factor confluence analysis.
Key Features
🔢 Goldbach Mathematical Levels
Generates price levels using Goldbach prime number partitions
Classifies levels as Premium, Standard, or Discount based on prime quality
Enforces precise 6% spacing between levels for harmonic structure
Tesla Vortex alignment detection for enhanced reliability
📊 PO3 Range System
Dynamic range calculation using Powers of 3 (3, 9, 27, 81, 243, 729, 2187)
Auto-expansion capability when price approaches boundaries
Liquidity zone visualization around key levels
📈 Multi-Factor Trading Signals
Buy/Sell signals based on 6 confluence factors:
Tesla Vortex phase alignment
ICT AMD cycle position
Goldbach time analysis
Volume profile weighting
Level quality assessment
Price momentum confirmation
Signal cooldown system to prevent overtrading
Adjustable confluence requirements (1-6 factors)
🎯 Advanced Analysis Integration
Tesla Vortex Algorithm: MMxM detection and trend phase analysis
ICT Concepts: AMD cycles (Accumulation, Manipulation, Distribution)
Time Analysis: Goldbach-aligned temporal patterns
Volume Profiling: Dynamic level weighting based on volume
Liquidity Detection: Sweep probability and pool identification
Visual Components
Color-coded Goldbach levels (Premium/Standard/Discount)
Order Block and Liquidity Void zones
Buy/Sell signal arrows with confidence display
Goldbach hit markers when price touches levels
Comprehensive information panel showing system status
PO3 range boundaries with expansion indicators
Input Parameters
Core Settings
PO3 Range Size: Select base range (3 to 2187)
Goldbach Precision: Number of partitions to calculate (20-200)
Confluence Required: Minimum factors for signal generation (1-6)
Signal Cooldown: Bars between signals (5-50)
Signal Filters
Min Distance to Level: Proximity required for signals (0.1-2.0%)
Minimum Reliability Score: Quality threshold for levels (0.5-2.0)
Signal Sensitivity: Aggressiveness of signal generation (0.5-3.0)
Analysis Toggles
Enable/Disable Tesla Vortex, ICT AMD, Time Analysis
Volume weighting and liquidity detection options
Historical and future projection controls
How It Works
Level Generation: The system calculates Goldbach prime partitions within the current PO3 range, creating mathematically significant price levels
Confluence Analysis: Multiple analytical frameworks assess market conditions at each level
Signal Generation: When price approaches a Goldbach level with sufficient confluence factors aligned, the system generates a trading signal
Risk Management: Built-in cooldown periods and distance requirements prevent excessive signals and overtrading
Best Practices
For Cleaner Signals
Set Confluence Required to 4-5
Increase Signal Cooldown to 15-20 bars
Reduce Min Distance to 0.3% for precision entries
Increase Minimum Reliability to 1.2-1.5
Timeframe Recommendations
Scalping: 1-5 minute charts with tight distance settings
Day Trading: 15-60 minute charts with standard settings
Swing Trading: 4H-Daily charts with relaxed cooldown periods
Alert Conditions
Buy/Sell signal generation with confluence count
Goldbach level hit detection
PO3 range breakouts and expansions
Tesla Vortex phase transitions
Liquidity sweep warnings
Time confluence alignments
Mathematical Foundation
The Goldbach Conjecture states that every even number greater than 2 can be expressed as the sum of two primes. This indicator leverages this mathematical principle to identify price levels where natural market harmony occurs, enhanced by Tesla's 3-6-9 vortex mathematics and ICT's market structure concepts.
Disclaimer
This indicator is for educational and analytical purposes. Past performance does not guarantee future results. Always use proper risk management and combine with other analysis methods for trading decisions.
Version Notes
Advanced signal filtering to prevent noise
Multi-timeframe time analysis capability
Enhanced Tesla Vortex integration
Volume-weighted level reliability scoring
Comprehensive confluence system for high-probability setups
Tags: #goldbach #mathematics #po3 #tesla #vortex #ict #amd #signals #primes #harmonics #levels

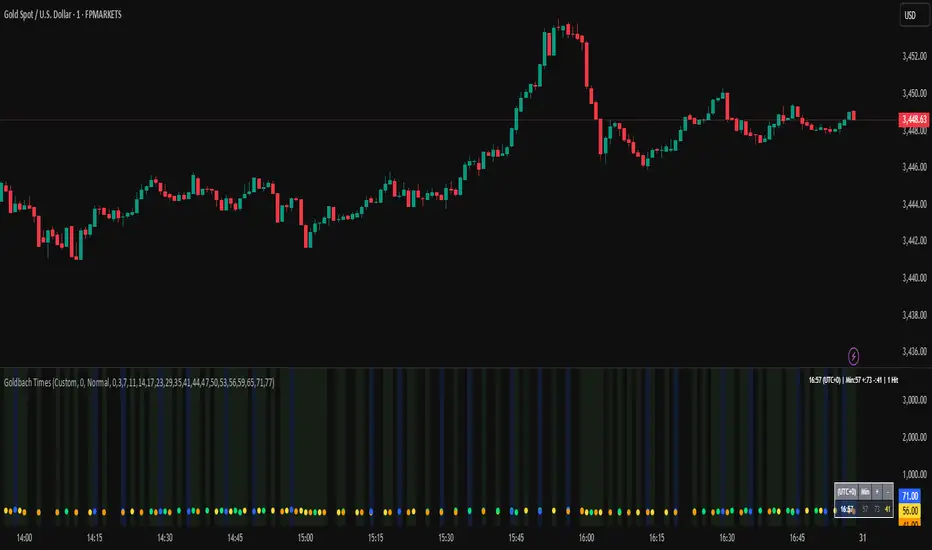
Goldbach Time IndicatorGoldbach Time Indicator (Minute Algebra + Core Levels)
A time-based discovery tool that maps minute arithmetic to a curated set of “Goldbach levels” (0–77) and highlights core reliable levels (29, 35, 71, 77) on any symbol/timeframe. It’s designed for session timing, event clustering, and pattern research—not price prediction.
What it shows
Three per-bar minute transforms:
Min = current minute (00–59)
Min+Hr = minute + hour (mapped, 60 → 00; valid up to 77)
Min−Hr = |minute − hour| (auto-chooses positive variant; 60 → 00)
Hit detection: marks a bar if any transform lands on an allowed Goldbach level.
Core emphasis: special tint/labels for 29, 35, 71, 77.
Optional background highlight (green for hits, blue tint when a core level is present).
Large corner readouts (optional): current Min / Min+Hr / Min−Hr with ✓ or ⭐ for core.
Detailed table: current time (your chosen timezone) + the three values and their status.
Histogram (optional): total hits and core hits under the chart.
Hover tooltips: per-bar time + which transforms hit (and whether they’re core).
Inputs & controls
Timezone Preset: UTC, New York, Tokyo, London, Sydney, or Custom UTC Offset.
Display toggles: Large number panels, Detailed table, Histogram, Horizontal reference lines.
Levels:
Standard set: 0,3,7,11,14,17,23,29,35,41,44,47,50,53,56,59,65,71,77
Core Only: show just 29, 35, 71, 77
Custom: paste your own comma-separated list (0–77)
Test Mode: assists with visual verification (e.g., consistent tooltips across all bars).
Core highlighting: stronger visual emphasis when a core level is hit.
How it helps
Session research: check if your strategy events cluster around certain minute signatures.
Timing filters: avoid entries during “no-hit” windows or focus on core hits.
Backtest guidance: the histogram and info panels make it easy to log/compare timing regimes.
Multi-market: independent of price scale—works for FX, indices, crypto, metals, single stocks.
Reading the visuals
Dots:
Yellow = Min, Lime = Min+Hr, Orange = Min−Hr, Blue = Core
Background:
Green = at least one hit, Blue tint = core level present
Tables/Panels: show current time (with timezone), raw values, and ✓/⭐ status.
Quick start
Choose your Timezone Preset (or set Custom UTC offset).
Start with Standard Levels; enable Core highlighting.
Turn on Detailed Table to confirm values match your venue/session.
(Optional) Show Histogram to see hit density; add Horizontal Lines for fixed references.
If needed, switch to Core Only or define Custom Levels to fit your hypothesis.
Notes & disclaimers
This is a time analytics overlay, not a buy/sell signal engine.
“Goldbach levels” here are a research framework (minute algebra 0–77) used for market-timing studies.
Always forward-test any timing rules with your strategy and risk plan.
Tags: timing, minute math, session research, clustering, core levels, UTC offset, macro timing, exploration
Goldbach + Circuit Breakers (Enhanced Grid)Goldbach + Circuit Breakers (Enhanced Grid)
Purpose
A precision ladder that combines Hopi/Hopiplaka’s PO3 fractional grid with CME-style Circuit Breakers and a daily anchor (0.5 midpoint). It lets you study fixed, session-boxed levels (Hopi style) or flip to a dynamic, real-time recalculating grid—without changing any of your existing logic.
What it plots
Major Circuit Breakers (e.g., 3%, 5%) above/below the session anchor.
PO3 fractional ladder (full Hopi sequence 0.03 → 2.97%) for fine structure.
Daily Anchor (0.5) line with right-edge labels.
Goldbach time hits (optional dots + info table).
Cast Forward: yesterday’s anchor & levels projected into today only (when enabled).
Session dividers (optional TradingView “Session breaks” recommended for full-height verticals).
Core Modes
Calculation Mode (🎯 Anchor)
Standard PO3 – behaves like classic version (locks from session start).
CME Anchored 0.5 – anchor/lock to the CME fix (uses your Fix Time Window; defaults to 3:00 PM CT). Manual override available.
CB Mode (⚡ Circuit Breakers)
Simple – major CBs only.
Full Grid – major CBs + full PO3 ladder.
PO3 Only – fractional ladder alone.
Behavior (⚙️ Recompute)
Fixed to Session Anchor – compute once from the day’s locked anchor and freeze for that session (Hopi style).
Recalculate Every Bar – recompute from live price each bar (experimental).
Checkboxes let you apply the chosen behavior independently to PO3 and/or Major CBs.
Daily Boxing & Cast-Forward
Restrict Lines To Day: ON = every day’s levels are boxed to its own session (no bleed). OFF = levels can extend across sessions (classic grid).
Day View (CB/PO3):
Current Only – today’s grid.
Previous Only – yesterday’s levels inside today only.
Both – show both sets together inside today.
Cast Forward Previous Day: projects the prior session’s locked levels into today’s box with its own style (width, dash, transparency, colors, labels).
Goldbach (optional)
Quick visual dots at allowed minute/HH:MM conditions with a compact info table (time, fix, mode, counts).
Alerts
Goldbach hit alert.
Circuit Breaker touch alerts for Major CBs and PO3 grid (upper/lower).
Quick Start
Symbol & Timeframe: Use your futures symbol (e.g., CME: NQ1!) on any intraday TF (Hopi examples often use 5m).
Hopi look:
Calculation Mode = CME Anchored 0.5
Grid Recompute Mode = Fixed to Session Anchor (Affects PO3 + Major CBs = ON)
Restrict Lines To Day = ON
Cast Forward = ON, Day View = Both
In Chart Settings → Appearance: turn on Session breaks for full-height daily verticals.
If your exchange settles at a different time, set Fix Time Window accordingly (defaults to 1500–1500 CT).
Styling & Performance
Independent style controls for current vs previous day (line type, width, colors, transparency).
Right-edge label placement to avoid mid-chart clutter.
Respectful of TradingView limits (max lines/labels); a cleanup routine trims older visuals.
Notes
In CME Anchored mode, the script bootstraps with live close until the fix arrives, then locks and refreshes once for the day.
If you don’t see boxed behavior, ensure Restrict Lines To Day is ON.
For full-height vertical session lines, enable the platform’s Session breaks (the indicator’s own dividers are subtle, price-bounded markers).
Educational use only. Not financial advice. Always test on replay/sim before applying to live markets.
