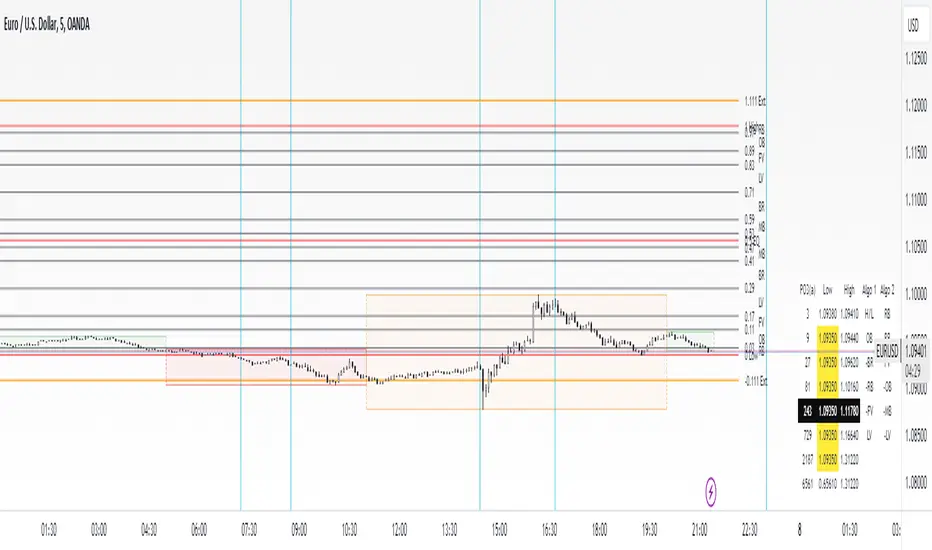
dmn's ICT AMD-Goldbach█ OVERVIEW
This script is built on ICT time & price theory and the theory of algorithmic market maker models, and visualizes the intraday divided using powers of three into accumulation, manipulation and distribution cycles.
It also includes an automatically calculated and plotted Goldbach level (a.k.a. IPDA level or Huddleston level) overlay, to help visualize where in the current market maker profile price is in relation to the AMD cycles, and where it might trade to.
█ CONCEPTS
Accumulation, Manipulation, Distribution Cycles
A 24 hour day, with the default set to start at 20:00 CET (the start of the Forex CLS Settlement operational timeline) is split in three parts - 9, 6 and 9 hours for the three cycles (roughly corresponding with Asia, London Open and New York + London Close sessions).
Since charts are fractals, there's also intra-cycle time fibs available in the script, to highlight the smaller fractal equivalents in each cycle.
These cycles are used to visualize the three phases (AMD) for easier identification of the current daily profile by analyzing during what cycle highs and lows of the day are made.
An example of a bullish day could be price rallying before making a low during the accumulation cycle, being manipulated higher and retracing to form an optimal trade entry during the manipulation cycle, expanding and creating the high of the day before selling off during the distribution cycle, with a potential reversal before it ends.
Goldbach levels
The Goldbach levels are based on the size of a price range (or price swing, if you will) expressed as a factor of power of three (3^n).
To decide what number to tell the script to use for the calculation, we look at what 3^n number best fits an average swing on the preferred timeframe we're trading.
For example; PO3 27 (3^3)might be fit for scalping, while PO3 243 (3^5) may correspond to the daily or weekly range, depending on the asset.
The script then calculates a range high and a range low using a power of three formula based on the current price and divides it into levels using Goldbach numbers.
At these levels one might expect to see price form various "blocks" as defined in concept by Michael J. Huddleston.
The blocks that correspond to the Goldbach levels are labeled with abbreviations as follows:
Ext = External range
Low = Range low
High = Range high
FVG = Fair value gap
RB = Rejection block
OB = Order block
LV = Liquidity void
BR = Breaker
MB = Mitigation block
Using these levels and said blocks we identify where in the current running market maker profile price is offered, and trade the preferred timeframe in line with the AMD cycles accordingly.
█ FEATURES
Custom AMD time cycles session times.
Custom time fib for fractal cycles.
Color and style customization.
Show only current or also historical cycles.
Equilibrium mode for Goldbach levels (show only high/low and midpoint)
Autodetection of asset type, with manual override.
█ NOTE
The default timings for the AMD cycles are set up for Forex pairs. For other asset types, such as indices, other timings are nessecary for optimal results.
Goldbach levels requires the correct symbol type setting for the calculation to work properly. Disable the script's autodetection and enable/disable the Forex option according to the type of chart if it fails.
Cerca negli script per "GOLD"
Marcel's Dynamic Profit / Loss Calculator for GoldOverview
This Dynamic Risk / Reward Tool for Gold is designed to help traders efficiently plan and manage their trades in the volatile gold market. This script provides a clear visualisation of trade levels (Entry, Stop Loss, Take Profit) while dynamically calculating potential profit and loss. It ensures gold traders can assess their positions with precision, saving time and improving risk management.
Key Features
1. Trade Level Visualisation:
Plots Entry (Blue), Stop Loss (Red), and Take Profit (Green) lines directly on the chart.
Helps you visualise and confirm trade setups quickly which is good for scalping and day trades.
2. Dynamic Risk and Reward Calculations:
Calculates potential profit and loss in real time based on user-defined inputs such as position size, leverage, and account equity.
Displays a summary panel showing risk/reward metrics directly on the chart.
3. Customisable Settings:
Allows you to adjust key parameters like account equity, position size, leverage, and specific price levels for Entry, Stop Loss, and Take Profit.
Defaults are dynamically generated for convenience but remain fully adjustable for flexibility.
How It Works
The script uses gold-specific conventions (e.g., 1 lot = 100 ounces, 1 pip = 0.01 price change) to calculate accurate risk and reward metrics.
It dynamically positions Stop Loss and Take Profit levels relative to the entry price, based on user-defined or default offsets.
A real-time summary panel is displayed in the bottom-right corner of the chart, showing:
Potential Profit: The monetary value if the Take Profit is hit.
Potential Lo
ss: The monetary value if the Stop Loss is hit.
How to Use It
1. Add the script to your chart on a gold trading pair (e.g., XAUUSD).
2. Input your:
Account equity.
Leverage.
Position size (in lots).
Desired En
try Price (default: current close price).
3. Adjust the Stop Loss and Take Profit levels to your strategy, or let the script use default offsets of:
500 pips below the Entry for Stop Loss.
1000 pips above the Entry for Take Profit.
4. Review the plotted levels and the summary panel to confirm your trade aligns with your risk/reward goals.
Why Use This Tool?
Clarity and Precision:
Provides clear trade visuals and financial metrics for confident decision-making.
Time-Saving:
Automates the calculations needed to evaluate trade risk and reward.
Improved Risk Management:
Ensures you never trade without knowing your exact potential loss and gain.
This script is particularly useful for both novice and experienced traders looking to enhance their risk management and trading discipline in the Gold market. Enjoy clearer trades at speed.

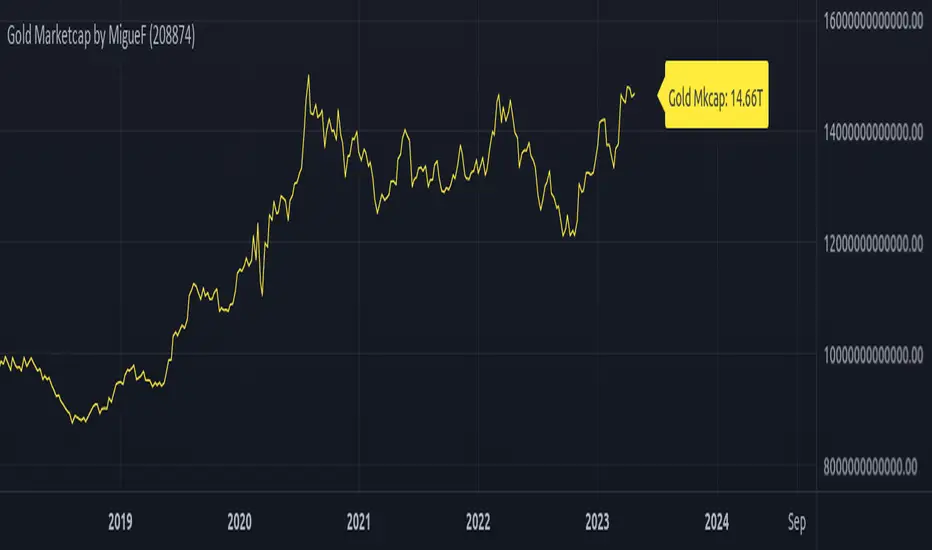
Total Gold Market Capitalization by MigueFinanceThis is the Current Market Capitalization and Historical Chart of Gold
There might be discrepancies in the future in the current market cap of gold due to the number of gold ever mined which is always increasing, so as to update it when necessary, you can go and check the site: "https://www.gold.org/goldhub/data/how-much-gold" and edit the amount of tonnes on the settings of this indicator
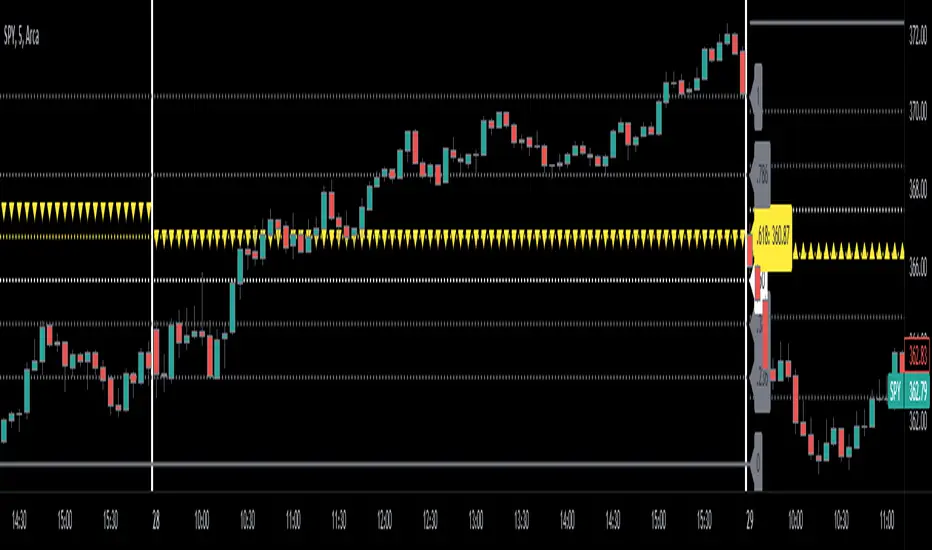
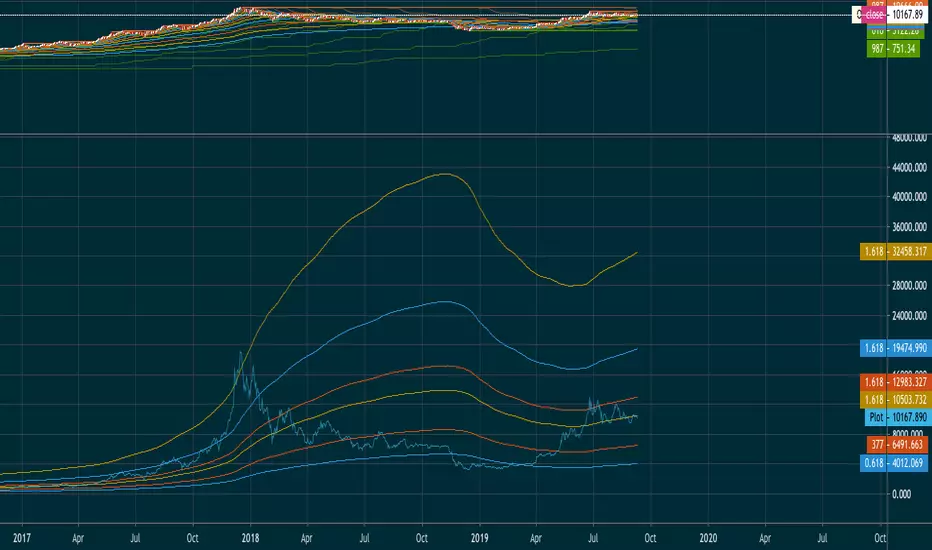
Automatic Fibonacci Retracement + Golden Ratio | by Octopu$👑 Automatic Fibonacci Retracement on Specific Timeframes + Golden Ratio | by Octopu$
Fibonacci Retracement is a method of technical analysis for determining support and resistance levels.
It is named after the famous Fibonacci sequence of numbers: 23.6%, 38.2%, 61.8%, and 78.6%
These ratios provide price levels to which markets tend to retrace a portion of a move.
Also used as a potential spot before a trend continues (or reverses) original direction.
While not officially a Fibonacci ratio, 50% is also used.
Fibonacci Levels can be drawn between any two significant price points or time frames.
(Such as a High and a Low or also on Daily and Weekly charts)
The indicator will then Automatically create the levels between those selected points.
Golden ratio, also known as the divine proportion, in mathematics, is the irrational number:
(1 + Square root of√5)/2, often denoted by the Greek letter ϕ or τ
Which is approximately equal to 1.618.
(Two quantities are in the golden ratio if their ratio is the same as the ratio of their sum to the larger of the two quantities.)
That's The Magic of the Fibonaccis, as well the Golden Ratio itself.
And this is exactly where this Indicator by Octopu$ kicks in:
This indicator Automatically sets all the Fibonacci Levels within the Retracement selected.
On top of that, it Highlights the Golden Ratio for the Fibonacci Levels drawn.
Additionally, it sets the Golden Ratio as possible Support or Resistance level,
Doing so by having visual identification to the Up or Down side.
This changes the game! Along with Price Action, Trend Direction, Chart Analysis and other Indicators as well.
(The combination relies on your own knowledge about Confluence Factors along with your Due Diligence)
www.tradingview.com
SPY
ANY Ticker. ANY Timeframe.
(SPY 5m as an example only)
Features:
• Multiple Timeframes
• Automatic Lines
• Fibonacci Setup
• Golden Ratio
• S/R Highlight
Options:
• Timeframe Selection
• Fibonacci Rates
• Line Customization
• Color Pickers
• Toggle On/Off
Notes:
v1.0
Indicator release.
Changes and updates can come in the future for additional functionalities or per requests. Follow and Stay Tuned!
Did you like it? Please Support and Shoot me a message! I'd appreciate if you dropped by to say thanks! Thank you.
- Octopu$
🐙
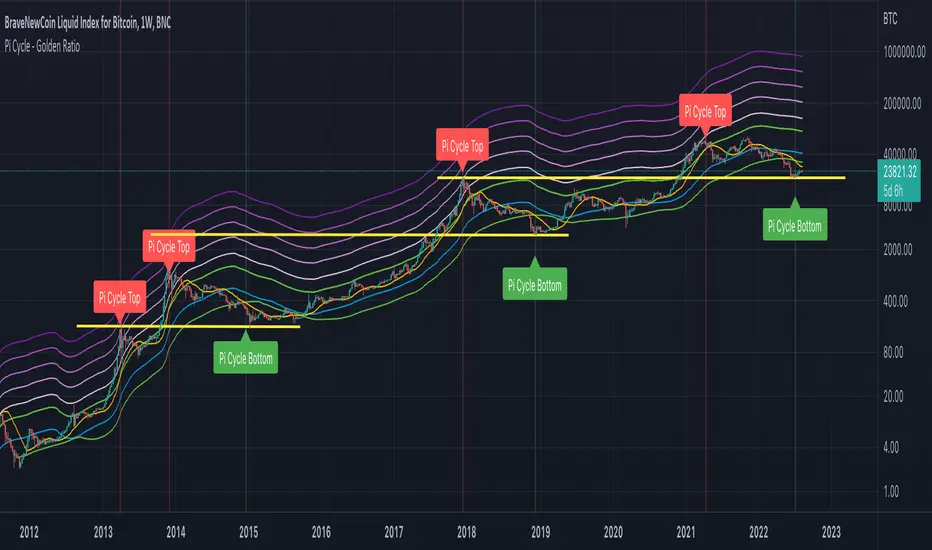
Bitcoin Golden Pi CyclesTops are signaled by the fast top MA crossing above the slow top MA, and bottoms are signaled by the slow bottom MA crossing above the fast bottom MA. Alerts can be set on top and bottom prints. Does not repaint.
Similar to the work of Philip Swift regarding the Bitcoin Pi Cycle Top, I’ve recently come across a similar mathematically curious ratio that corresponds to Bitcoin cycle bottoms. This ratio was extracted from skirmantas’ Bitcoin Super Cycle indicator . Cycle bottoms are signaled when the 700D SMA crosses above the 137D SMA (because this indicator is closed source, these moving averages were reverse-engineered). Such crossings have historically coincided with the January 2015 and December 2018 bottoms. Also, although yet to be confirmed as a bottom, a cross occurred June 19, 2022 (two days prior to this article)
The original pi cycle uses the doubled 350D SMA and the 111D SMA . As pointed out this gives the original pi cycle top ratio:
350/111 = 3.1532 ≈ π
Also, as noted by Swift, 111 is the best integer for dividing 350 to approximate π. What is mathematically interesting about skirmanta’s ratio?
700/138 = 5.1095
After playing around with this for a while I realized that 5.11 is very close to the product of the two most numerologically significant geometrical constants, π and the golden ratio, ϕ:
πϕ = 5.0832
However, 138 turns out to be the best integer denominator to approximate πϕ:
700/138 = 5.0725 ≈ πϕ
This is what I’ve dubbed the Bitcoin Golden Pi Bottom Ratio.
In the spirit of numerology I must mention that 137 does have some things going for it: it’s a prime number and is very famously almost exactly the reciprocal of the fine structure constant (α is within 0.03% of 1/137).
Now why 350 and 700 and not say 360 and 720? After all, 360 is obviously much more numerologically significant than 350, which is proven by the fact that 360 has its own wikipedia page, and 350 does not! Using 360/115 and 720/142, which are also approximations of π and πϕ respectively, this also calls cycle tops and bottoms.
There are infinitely many such ratios that could work to approximate π and πϕ (although there are a finite number whose daily moving averages are defined). Further analysis is needed to find the range(s) of numerators (the numerator determines the denominator when maintaining the ratio) that correctly produce bottom and top signals.

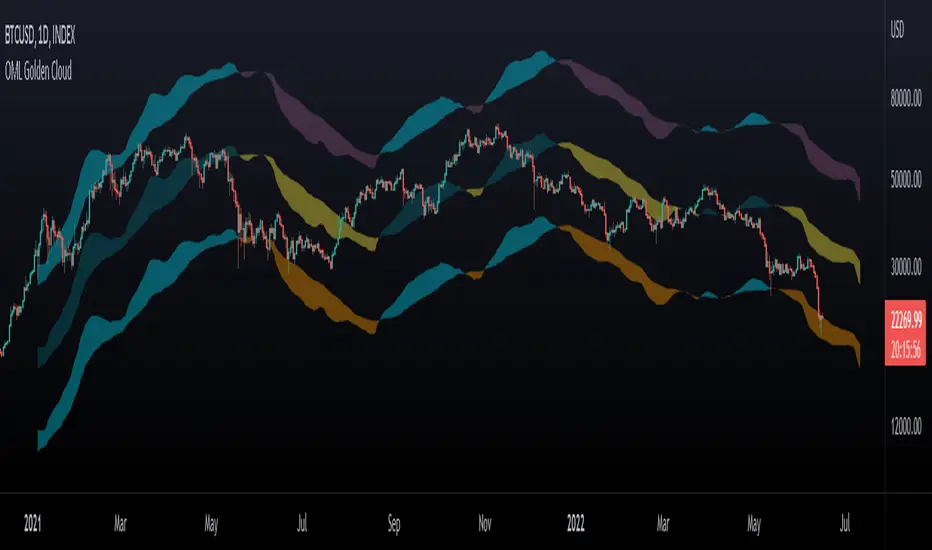
OhManLan Golden CloudThis indicator is a modification of the popular Ichimoku indicator, build high/low channels using the Golden Ratio, Volume-weighted average price allows smoother components.
high/low channels moves based on Fibo Levels (Golden Ratio: 1.618).
- Settings -
The indicator can be adjusted to your needs.
- How to use -
OhManLan Golden can be used a Support/Resistance , Stop loss, Trailing stop and Price target.
Volume-weighted average price allows smoother components.
Can be used with other indicators such as Moving Average Convergence Divergence (MACD).
KayipAdisyon - ATH / ATL - EMA - Golden / Death Cross - RSI50-167-200 EMA , ATH/ATL information widget, Golden & Death Cross lines and RSI bands...

CryptoSignalScanner - Pi Cycle - Golden Ratio MultiplierDESCRIPTION:
All credits are going to Philip Swift who has written an article on Medium about the PI Cycle Top and The Golden Ratio Multiplier .
Based on the article this indicator has been created to display and indicate the Bitcoin PI Cycle Top which has historically been effective in picking out the market cycle highs within 3 days. It also displays the Golden Ratio Multiplier which explores Bitcoin's adoption curve and market cycles.
• The PI Cycle Top is based on the 350DMA (Daily Moving Average) multiplied by 2 and the 111DMA (Daily Moving Average)
• The Golden Ratio Multiplier is based on the 350DMA (Daily Moving Average) the The Golden Ratio which is defines as 350DMA * 1.61803398875 and the Fibonacci Sequence which is defined as 350DMA * 2, 350DMA * 3, 350DMA * 5, 350DMA * 8, 350DMA * 13 and 350DMA * 21
HOW TO USE:
• The PI Cycle Top is picking the market cycle tops within 3 days.
When the 350DMA x2 crosses below the 111DMA Bitcoin price peaks in its market cycle. This indicates that the market is overbought and it is time to take profit.
• The Golden Ratio Multiplier pics the top on every market cycle in Bitcoin’s history and forecasts when Bitcoin will top in the coming market cycle.
In 2011 the top was at 350DMA * 21
In 2013 the top was at 350DMA * 13
In 2014 the top was at 350DMA * 8
In 2018 the top was at 350DMA * 5
If we look at the results above the forecast for next top should be at 350DMA * 3
FEATURES:
• You can change the Long Moving Average which is by default 350
• You can change the Short Moving Average which is by default 111
• You can show/hide the Pi Cycle Top labels
• You can show/hide the Pi Cycle Bottom labels
• You can show/hide the Pi Cycle Moving Averages
• You can show/hide the Golden Ratio
• You can show/hide the Fibonacci Sequence
• You can set an alert when the Pi Cycle Top is reached
REMARKS:
• This advice is NOT financial advice.
• We do not provide personal investment advice and we are not a qualified licensed investment advisor.
• All information found here, including any ideas, opinions, views, predictions, forecasts, commentaries, suggestions, or stock picks, expressed or implied herein, are for informational, entertainment or educational purposes only and should not be construed as personal investment advice.
• We will not and cannot be held liable for any actions you take as a result of anything you read here.
• We only provide this information to help you make a better decision.
• While the information provided is believed to be accurate, it may include errors or inaccuracies.
HOW TO GET ACCESS TO THE SCRIPT:
• Access to this script is free of charge
• You can drop me a message to get access to the script
Good Luck,
SEOCO
Easy Loot Golden CrossGolden/Death Cross Moving Average Indicator
30, 100 & 200 period Simple Moving Average (SMA).
30 = Yellow
100 = Green
200 = Black
Black crosses mark the 'golden crosses' as well as the 'death crosses'. These black crosses appear when the 30 crosses the 100 & when the 100 crosses the 200. These black crosses don't tell you when to buy/sell, but simply indicate interest in the market.
This code is open-source so feel free to add this indicator to your chart and play around with the different moving average timeframes & color schemes.
Golden Cross
The golden cross occurs when a short-term moving average crosses over a major long-term moving average to the upside and is interpreted by analysts and traders as signaling a definitive upward turn in a market. Basically, the short-term average trends up faster than the long-term average, until they cross.
There are three stages to a golden cross:
A downtrend that eventually ends as selling is depleted
A second stage where the shorter moving average crosses up through the longer moving average
Finally, the continuing uptrend, hopefully leading to higher prices
Death Cross
Conversely, a similar downside moving average crossover constitutes the death cross and is understood to signal a decisive downturn in a market. The death cross occurs when the short term average trends down and crosses the long-term average, basically going in the opposite direction of the golden cross.
The death cross preceded the economic downturns in 1929, 1938, 1974, and 2008.

MACD/EMA Golden CrossThis is a slight modification to the MACD indicator. The golden cross indicator makes use of EMA 7 and EMA 21 as well as MACD together, in which it will turn the MACD line yellow & fill the MACD with a yellow background when MACD is above the signal line and EMA7 is above EMA21. This is best suited for swing trading on a daily timeframe.

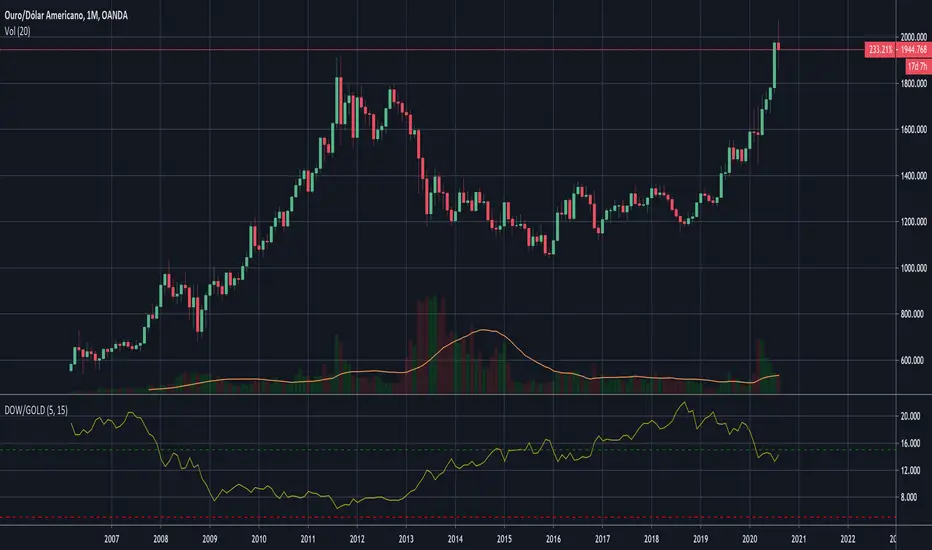
Dow to Gold RatioDisplays as an indicator the Dow to Gold Ratio.
Rules of this long-term trade:
The Dow-to-Gold ratio is guide for when to get in and out of stocks. When the ratio goes below 5, we buy equal shares in the Dow Jones Industrial Average index (the Dow). When the ratio goes above 15, we sell the Dow and buy gold.
In other words, when the entire Dow can be bought for five ounces of gold, we buy stocks. When it takes 15 ounces or more to buy the Dow, we sell stocks and buy gold.
Over the past 100 years, you would have made a total of six trades based on this strategy.
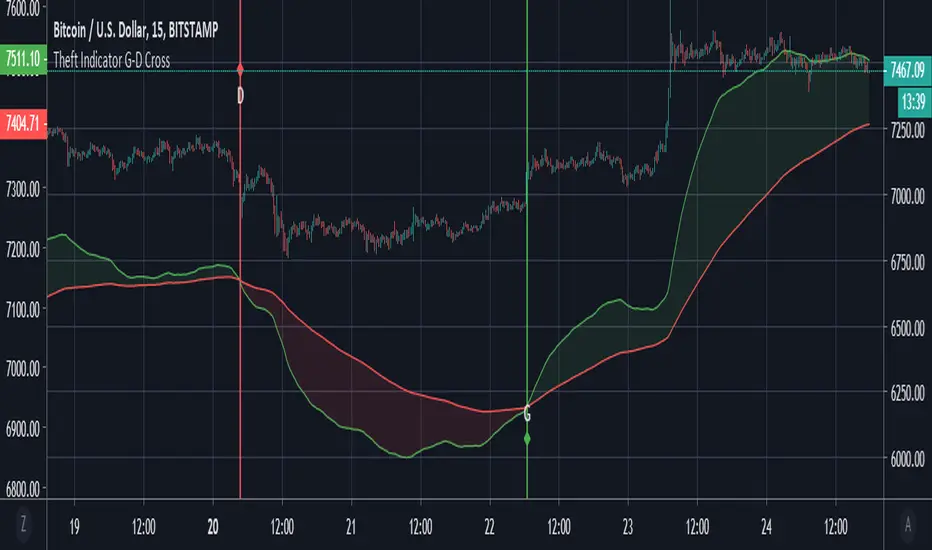
Theft Indicator - Golden/Death CrossThe golden cross and death cross used here is favorable for low time frames. We believe it is a good scalping option to use it. It works well with forex, stocks and crypto.
How is it used? - Just apply it to the chart, and take trades on the labels signaled. G = Golden cross || D = Death Cross.
The indicator is open for public use, but the source code is protected.
Enjoy it.
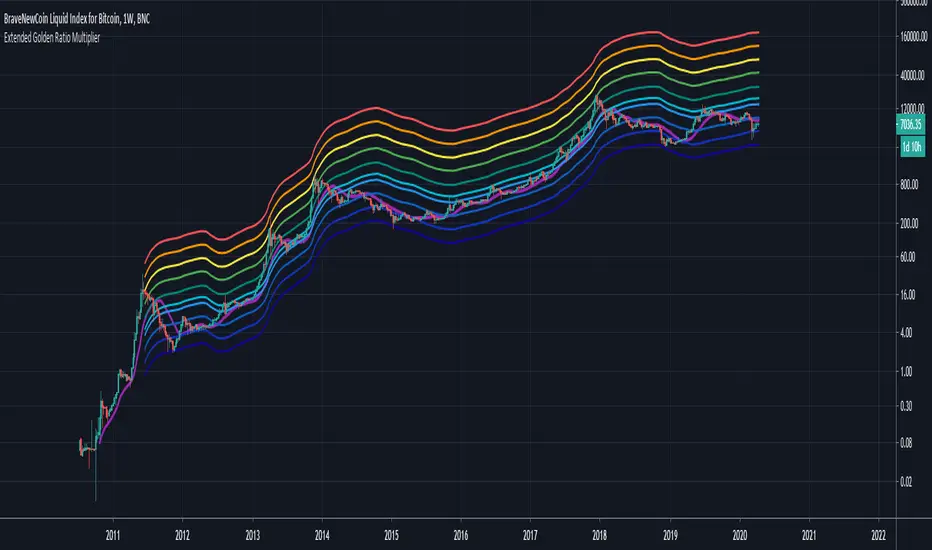
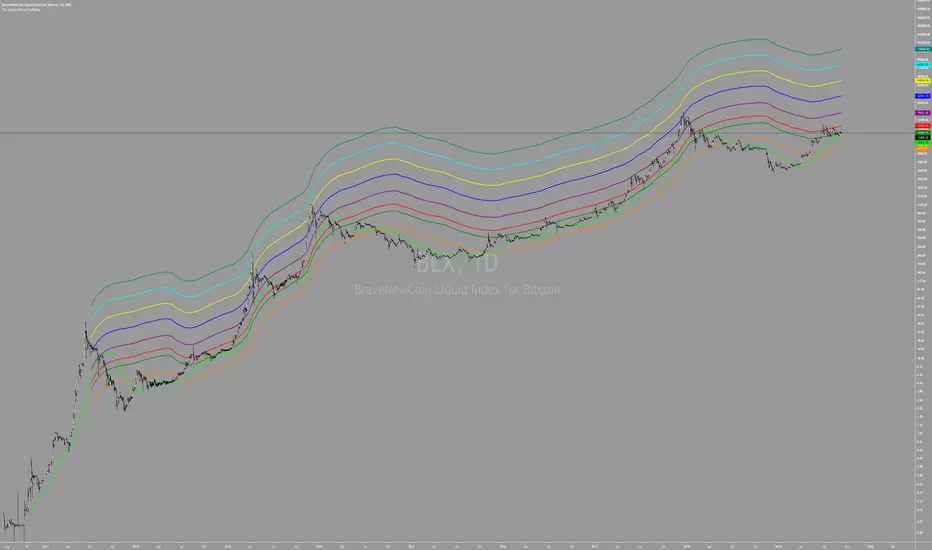
Extended Golden Ratio Fibonacci Multiplier + Pi Cycle TopHere I present the Golden Ratio Multiplier and Pi Cycle Top Indicator originally conceptualized by Philip Swift, and extend it. Due to popular demand for a nicer looking color scheme and added MAs & functionalities, I decided to publish this indicator, of course with free access for everyone as the discovery is attributed to Philip. The indicator works best for BLX (BraveNewCoin Liquid Index for Bitcoin) on daily (D) or weekly (W) timeframe. Other timeframes are not supported (and also generally not needed as this is a rather high timeframe indicator).
Added functionality:
- Additional Fibonacci MAs for Bottom: 0.618*MA(50W) and 0.382*MA(50W), which seem to be distinct high timeframe support MAs
- Pi Cycle Top and all Fibonacci MAs can be plotted or hidden individually
- Correct MA values for daily (D) and weekly (W) timeframes are automatically assigned, so you do not need to change anything when you switch between those timeframes.
It is generally said that Bitcoin's peaks always only reach a lower yearly Fibonacci MA. The next one to eye would be the 3*MA(50W) = 3*MA(350D) here plotted in dark green. Historically when the MA(16W) = MA(111D) (here plotted in magenta) line crossed the 2*MA(50W) = 2*(350D) line (plotted in cyan) from below a cycle peak is reached. This indicator might therefore be a good high timeframe indicator for Bitcoin trading. Of course this is no financial advice.
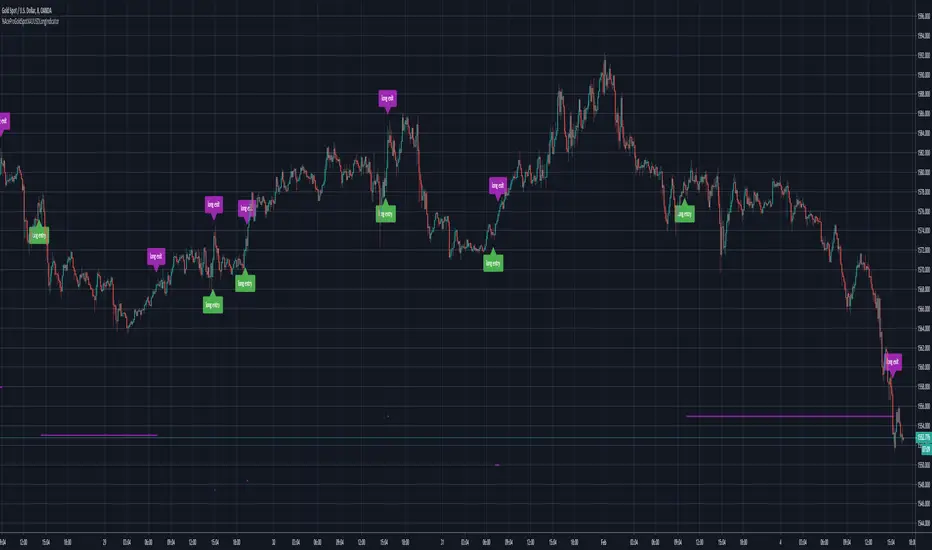
Ace Pro Gold Spot XAUUSD 8Min Long IndicatorThe Ace Pro Gold Spot XAUUSD 8 Minute Long Indicator calculates overbought and oversold conditions.
It focuses on momentum to identify whether the market is overbought or oversold.
If it detects that the market is oversold, it gives an alert of “long entry”
If it detects that the market is overbought, it gives an alert of “long exit”
Users are also able to set notifications on Tradingview with this version of the indicator.
To set an alert, after adding the indicator, at the top left of the chart where the indicator is listed, click on the "more" option (three dots), and then select "Add alert."
Please note the following:
This indicator is designed only for use on the 8 minute XAUUSD OANDA Gold Spot / U.S. Dollar chart
It is only to be used for opening and closing long positions.
It is not recommended for use with short positions.
It is not recommended for use with time frames other than the 8 minute.
In a sideways market, or during a violent move, it is likely to produce false signals.
Traders must use confluence from their technical analysis to enter trades.
Traders must use confluence from their technical analysis to enter trades.
ANN BTC MTF Golden Cross Period MACDHi, this is the MACD version of the ANN BTC Multi Timeframe Script.
The MACD Periods were approximated to the Golden Cross values.
MACD Lengths :
Signal Length = 25
Fast Length = 50
Slow Length = 200
Regards.

Blockchain Fundamentals - Golden Ratio Multiplier GRMBlockchain Fundamentals - Golden Ratio Multiplier GRM
Intro
This strategy was put forth by Phillip Swift (a.k.a PositiveCrypto) as guidelines for bitcoins market cycles.
Description
The new insight comes when we multiply the 350 day moving average (which we will refer to as the 350DMA) by specific numbers. Those mathematically important numbers are:
-The Golden Ratio = 1.61803398875
-Fibonacci Sequence = 1, 1, 2, 3, 5, 8, 13, 21…
Using those three moving average lines (350DMA x 1.6, x2, x3) has allowed us to pick out almost every single intra-cycle price high in Bitcoin’s history.
The next numbers in the Fibonacci sequence are 5, 8, 13, and 21.
Remarkably, when we use these multiples of the 350 day moving average, they pick out each of Bitcoin’s market cycle tops going all the way back to the first price bubble in 2011.
Additions
I added the ability to select from a few types of moving averages and to change the base MA length. This will allow you to experiment and find your own potential correlations.
I also added the bottom most (yellow) line you can see which is the base MA minus the 0.618. This has been a great market bottom level for calling capitulation.
I also added in the ability to plot additional fibonacci and gann numbers.
I Also added some trade state logic when to long/short though its not perfect by any means but a work in progress.
👍 We hope you enjoyed this indicator and find it useful! We post free crypto analysis, strategies and indicators regularly. This is our 75th script on Tradingview!

Juicy Golden/Death CrossThis script shows you if we are in a downtrend or uptrend using the golden/deathcross strategy. It is fully costumizable and we have been able to code in cosum alerts. This indicator should not be used to buy or sell, but determin scalps or swingtrades in the direction it is going.

SOLARIZED GOLDEN RATIO MULTIPLIERImplementation of The Golden Ratio Multiplier described in this Medium Article.
medium.com
The Golden Ratio MultiplierBy Philip Swift
As Bitcoin continues to progress on its adoption journey, we learn more about its growth trajectory.
Rather than Bitcoin price action behaving like a traditional stock market share price, we see it act more like a technology being adopted at an exponential rate.
This is because Bitcoin is a network being adopted by society, and because it is decentralised money with limited supply, its price is a direct representation of that adoption process.
There are a number of regression analysis tools and stock to flow ratio studies that are helping us to understand the direction of Bitcoin’s adoption curve.
The new tool outlined in this paper brings an alternative degree of precision to understanding Bitcoin’s price action over time. It will demonstrate that Bitcoin’s adoption is not only following a broad growth curve but appears to be following established mathematical structures.
In doing so, it also:
Accurately and consistently highlights intracycle highs and lows for Bitcoin’s price.
Picks out every market cycle top in Bitcoin’s history.
Forecasts when Bitcoin will top out in the coming market cycle.
To begin, we will use the 350 day moving average of Bitcoin’s price. It has historically been an important moving average because once price moves above it, a new bull run begins.
more ...
medium.com
All rights reserved to Philip Swift (@PositiveCrypto)

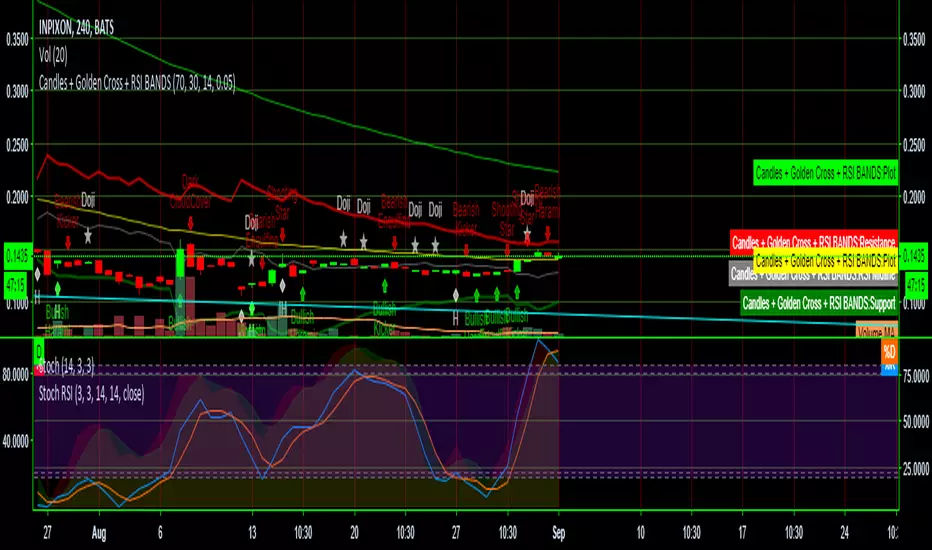
Candles + Golden Cross + RSI BANDSThis script combines three scripts for ease of use
RSI Bands LazyBear
Golden Cross MichMexTrading
Candlestick patterns identified repo32
I combined them because they work exceptionally well together in identifying reversals and other potential changes
Multicross - golden/death cross indicator with inside barThis script utilizes five exponential moving averages, golden/death cross flags and inside bars. The EMAs are: 8,13,21,55 and 100. The cross flags appear when: 1st fastest crosses the 2nd fastest, 2nd fastest crosses the 3rd fastest and so on and so forth. Inside The script originated after I watched the youtube video with Philakone talking about swing trades. I started the the four EMAs he used and then decided to add the 100 to add a little more weight to the projected movements. I've noticed sometimes when inside bars and a golden crosses happen simultaneously the movements are more explosive.

Moving Average 50/200 Golden Cross or Dead CrossA strategy is to apply two moving averages to a chart, one longer and one shorter. When the shorter MA 50 day scrosses above the longer term MA 200 days it's a buy signal as it indicates the trend is shifting up.This is known as a "golden cross."
When the shorter MA crosses below the longer term MA it's a sell signal as it indicates the trend is shifting down. This is known as a "dead/death cross"
For cryptocurrencies use 4 hour charts.
