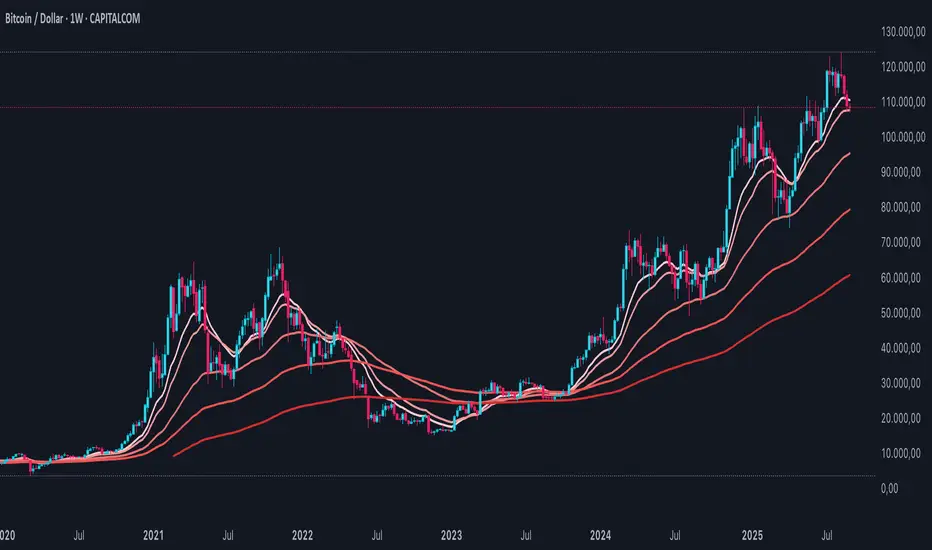
SynergySynergy
This indicator was developed for use in an investigation/tutorial using Pine Script to analyse Gold and US Dollar Index correlation.
The first indicator shall measure the percentage change between the open and close of each bar and compare it to the same percentage change of an alternative asset. Additionally, we shall color the background when the two assets move in the same direction. This should allow us to more easily see when the two assets move together and spot trends in their moment.
The yellow bars show use the percentage change in the price of gold. The blue bars show the percentage change in the price of the US Dollar index. If the bar is above zero, it means that the asset closed up. Conversely, if it is below zero, it means the asset closed down. Finally, the grey bars show bars in which the two assets closed in the same direction.
It can be used in conjunction with a second indicator (to be published soon) that provides statistics generated from this indicator.
The full free post can be found here: backtest-rookies.com
Cerca negli script per "GOLD"

BO Willians EMA'sBo Williams is a North America/Brazilian trader. He created a trading software called PHI CUBE.
This ema ratios are very used in Brazil. They a based in the Golden Number PHI.
"There is a special ratio that can be used to describe the proportions of everything from nature's smallest building blocks, such as atoms, to the most advanced patterns in the universe, such as unimaginably large celestial bodies. Nature relies on this innate proportion to maintain balance, but the financial markets also seem to conform to this "golden ratio." Here, we take a look at some technical analysis tools that have been developed to take advantage of it.
The Mathematics
Mathematicians, scientists and naturalists have known this ratio for centuries. It's derived from something known as the Fibonacci sequence, named after its Italian founder, Leonardo Fibonacci (whose birth is assumed to be around 1175 A.D. and death around 1250 A.D.). Each term in this sequence is simply the sum of the two preceding terms (1, 1, 2, 3, 5, 8, 13, etc.).
But this sequence is not all that important; rather, it is the quotient of the adjacent terms that possesses an amazing proportion, roughly 1.618, or its inverse 0.618. This proportion is known by many names: the golden ratio, the golden mean, PHI and the divine proportion, among others. So, why is this number so important? Well, almost everything has dimensional properties that adhere to the ratio of 1.618, so it seems to have a fundamental function for the building blocks of nature. "
More here www.goldennumber.net

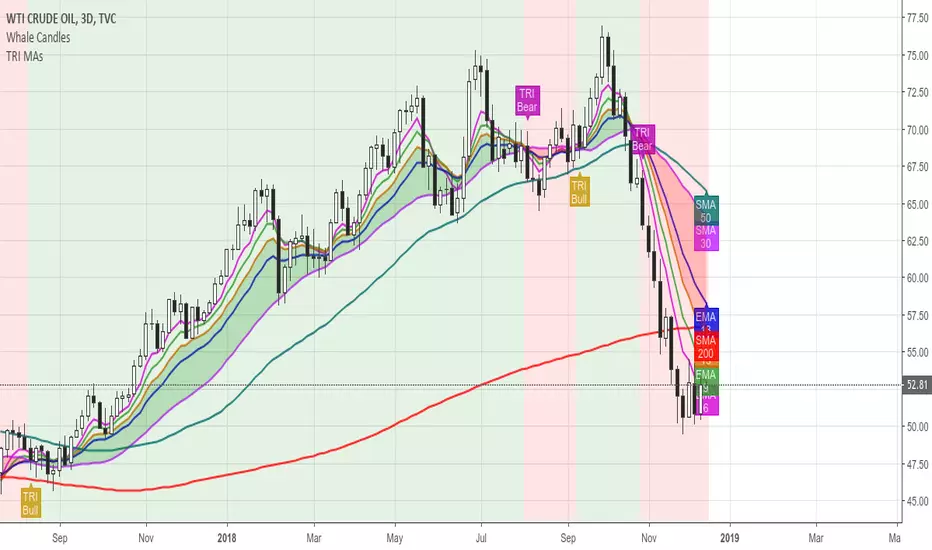
Ultimate TRI MAsThis is a helper tool to get deeper into TRI's Moving Average Studies.
The indicator allows for:
Show/Hide all MAs
Show/Hide each one of the MAs
Label the MAs for quicker identification
Select Bias Mode: Institutional or Brian's
Draw a Cloud based on Bias Mode
Highlight Crosses based on Bias Mode
Color the Background based on Bias Mode
Show/Hide the Cloud, the Crosses and the Background
Hope you find it useful!
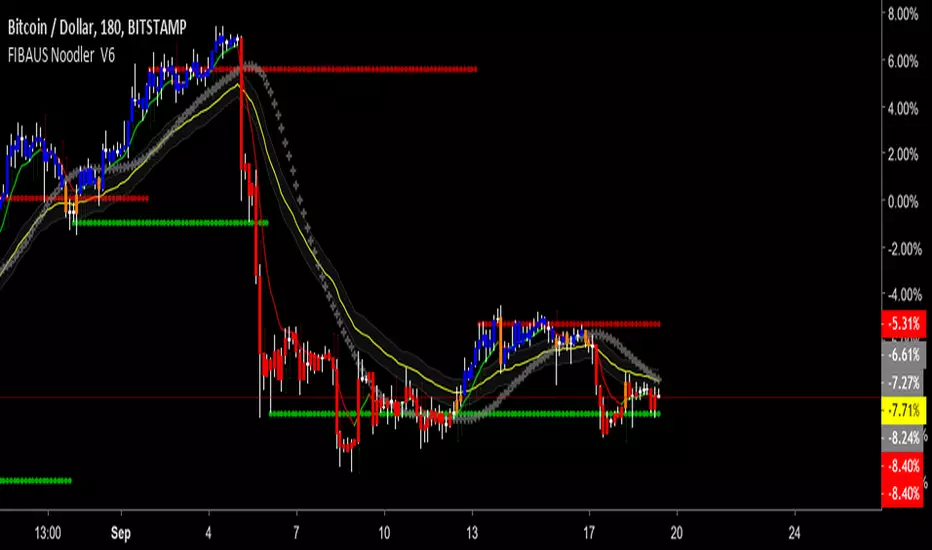
FIBAUS Noodler V6Named by my daughter, because of its early look like a bowl of noodles,the noodle analysis does a Harmonic and Fibonacci Analysis on price as it moves through time.
FEATURES
1.RESISTANCE AND SUPPORT - Finds Hidden and Fibonacci based R&S Levels, to assist with buying and selling targets.
2.SENTIMENT INDICATOR-A measure of human confidence and fear as it relates to price.
3.BANKERS GOLDEN NOODLE - A very specific institutional (banks, investment firms etc) calculation.
4.COLORED BARS - To show uptrend, uncertainty and downtrend.
Blue - Up-Trend/Breakout -(BUY/LONG)
Orange - Potential Trend reversal
Red - Downtrend (SELL/SHORT)
5.ALL markets anytime timeframe-(stocks, crypto, forex, futures ) application
FOR TRIAL ACCESS - 1. Follow me, 2. Like the script 3. Message me the words “I WANT IN NOW”.
BUY SIGNALS - 1.When Rapid Price Direction line crosses up the Sentiment Indicator
2.When Rapid Price Direction line crosses up the Bankers Golden Noodle
3. Candles Turn From Orange to Blue
SELL SIGNALS - 1.When Rapid Price Direction line crosses down the Sentiment Indicator
2.When Rapid Price Direction line crosses down the Bankers Golden
Noodle.
3. Candles Turn From Orange to RED
PRO Tips: 1. Remove candle borders for better visual of colored candles.
2. Make the Sentiment Line Transparent for less color on the chart
(Step 1:Double click on the script after applied to chart)
(Step 2:Click Inputs at the top of the menu and check the Color box)
3. Two more PRO BUY and SELL Techniques for free private chat members only.
FOR TRIAL ACCESS - 1. Follow me, 2. Like the script 3. Message me the words “I WANT IN NOW”
Happy Trading,
FIBAUS
EMA 50, 100 and 200Draw a set of 3 EMA: 50, 100 and 200. It highlight with a circle the crossing of EMA(50) with other EMAs

SKN Momentum Indicator V3A simple adjustment to assist in squeeze and momentum measure.
A few calculation adjustments were also made.
The mid line is now color coded red/gold to show squeeze during oscillation. Red/Yellow Dots (Squeeze is on) and White Dots means No squeeze
While golden dots show strong trend in the direction of current oscillation.
Happy Trading
FIBAUS

IV/HV ratio 1.0 [dime]This script compares the implied volatility to the historic volatility as a ratio.
The plot indicates how high the current implied volatility for the next 30 days is relative to the actual volatility realized over the set period. This is most useful for options traders as it may show when the premiums paid on options are over valued relative to the historic risk.
The default is set to one year (252 bars) however any number of bars can be set for the lookback period for HV.
The default is set to VIX for the IV on SPX or SPY but other CBOE implied volatility indexes may be used. For /CL you have OVX/HV and for /GC you have GVX/HV.
Note that the CBOE data for these indexes may be delayed and updated EOD
and may not be suitable for intraday information. (Future versions of this script may be developed to provide a realtime intraday study. )
There is a list of many volatility indexes from CBOE listed at:
www.cboe.com
(Some may not yet be available on Tradingview)
RVX Russell 2000
VXN NASDAQ
VXO S&P 100
VXD DJIA
GVX Gold
OVX OIL
VIX3M 3-Month
VIX6M S&P 500 6-Month
VIX1Y 1-Year
VXEFA Cboe EFA ETF
VXEEM Cboe Emerging Markets ETF
VXFXI Cboe China ETF
VXEWZ Cboe Brazil ETF
VXSLV Cboe Silver ETF
VXGDX Cboe Gold Miners ETF
VXXLE Cboe Energy Sector ETF
EUVIX FX Euro
JYVIX FX Yen
BPVIX FX British Pound
EVZ Cboe EuroCurrency ETF Volatility Index
Amazon VXAZN
Apple VXAPL
Goldman Sachs VXGS
Google VXGOG
IBM VXIBM

Price Action Channel ( PAC ) - Restoration by YardleyRosetteOriginal script PACMASTER by JustUncleL.
I (YardleyRosette) have republished this indicator with the fixed and optimal settings nearest to MetaTrader4 Traders Dynamic Index ("SYNERGY") Price Action Channel.
Therefore I feel I have to accredit myself for selecting the optimal settings as best intended by CompassFX .
Basic Rules:
Solid filled Heikin Ashi above (golden) yellow PAC indicates strong upmove, trend trade ( Buy ). Solid filled Heikin Ashi under (golden) yellow PAC indicates strong downmove, trend trade ( Sell ).
Weak Heikin Ashi bars signal weakness as if of ranging/consolidating market conditions, especially when price is within PAC . This is an alert zone in which not to trade or to close trade for possible reversed direction.
2nd Channel made for assistance due to the unfixable precision settings when compared to MetaTrader4's Price Action Channel. MT4 displaces PAC in a certain manner TradingView has no script for programming.
FIBAUS MI V2A simple adjustment to assist in squeeze and momentum measure. The mid line is now color coded red and gold -0.22% to show momentum during oscillation. Red dots mean low momentum which explains why some breakouts are weak. While golden dots show strong upward movement. Its all visual.

5x EMA RSI Candles, Price action candles
Hi all
Build in functions:
1. Price candle recognition;
a) Dark shadow cover,
b) Piercing line,
c) Doji, bearish and bullish
d) Bullish and bearish engulfing
e) Inside and outside bars
f) Up Reject Green Pin & Down Reject Red Pin Bar
g) Hammer & Inverted Hammer
2, RSI overbought and oversold candles
a.) Red = Overbought
b.) Geen = Oversold
3. EMA Background change:
a) Light green is Ema 21 greater than EMA 55 and above EMA 200 (In up trend)
b) Dark green is EMA 21 greater than EMA 55 and below EMA 200 (Start of up trend)
c) Light red is EMA 21 less than EMA 55 and above EMA 200 (Start of Down trend)
d) Dark red is EMA 21 less than EMA 55 and below EMA 200 (In Down trend)
4. Alerts:
a.) RSI Overbought
b.) RSI Oversold
c.) EMA Buy = Light green
d.) EMA Sell = Light red
e.) Price candle alerts
I would recommend to use
RSI - CM_Ultimate RSI MTF
MACD CM_MacD_Ult_MTF
For confirmation of trades.
Please take note this is invite only via BTC donation, keep the donation in mind when asking for access.
Thanks

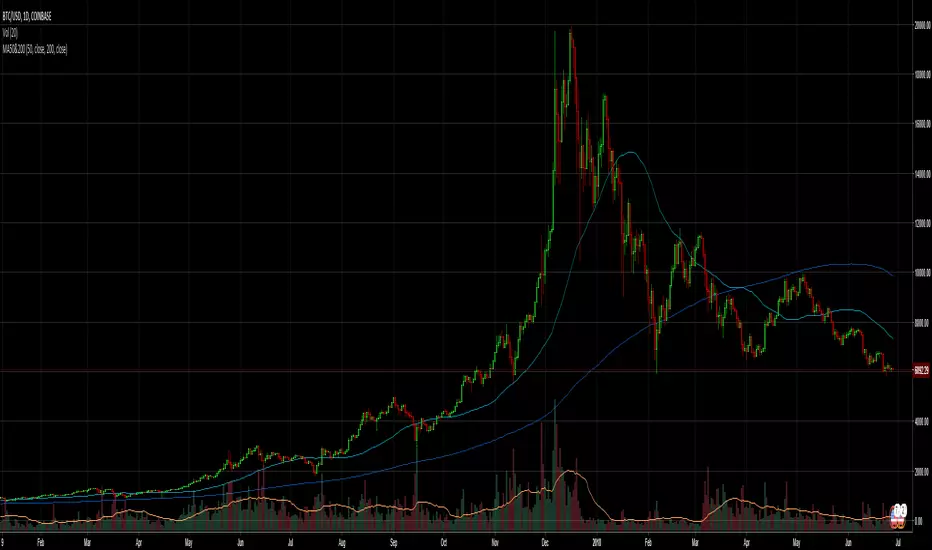
Moving Averages 50 & 200Moving Average Indicator for trading 50MA and 200MA crossovers (golden cross and death cross).
A golden cross is considered a bullish sign; it occurs when the 50-day moving average rises above 200-day moving average. A death cross is considered a bearish sign; it occurs when the 50-day moving average drops below 200-day moving average.
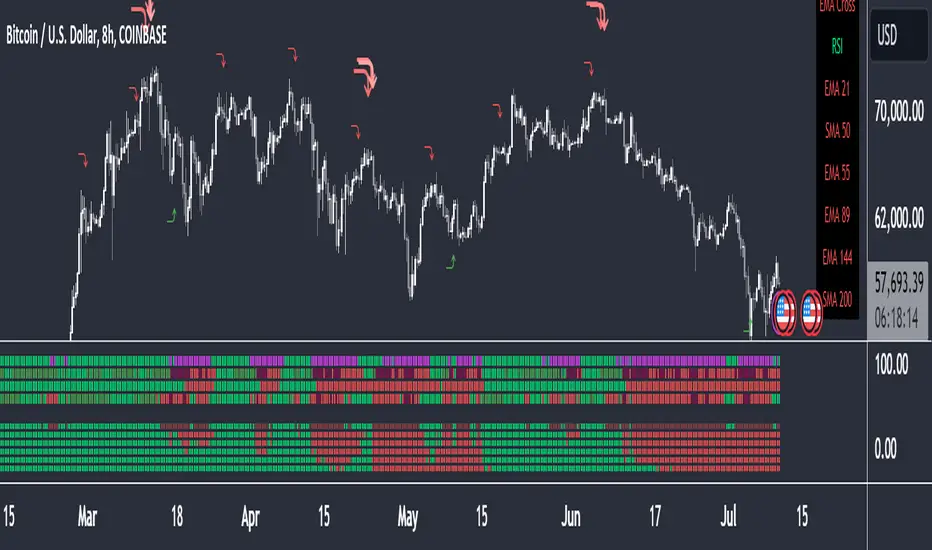
MA Cross + KillzonesCombines oscarvs' BTC Killzones with four EMAs and the trader's 13/49 golden cross as well as the investor's 50/200 golden cross. Note that the killzones highlight the first two hours of market action in each of the three main crypto markets, so this time period will have to be adjusted for daylight savings time in April and in November.

Efmus System : 10 indicators in 1
10 indicators in 1
MACD
RSI
PIVOT weekly:best
200 sma
100 sma
75 ema
55 ema
50 sma
20 ema
Golden EMA Crossover 13/48 based on tests Results of 1750 Moving Average Crossovers :
etfhq.com
Efmus System : 10 indicators in 1
10 indicators in 1
MACD
RSI
PIVOT weekly:best
200 sma
100 sma
75 ema
55 ema
50 sma
20 ema
Golden EMA Crossover 13/48 based on tests Results of 1750 Moving Average Crossovers :
etfhq.com

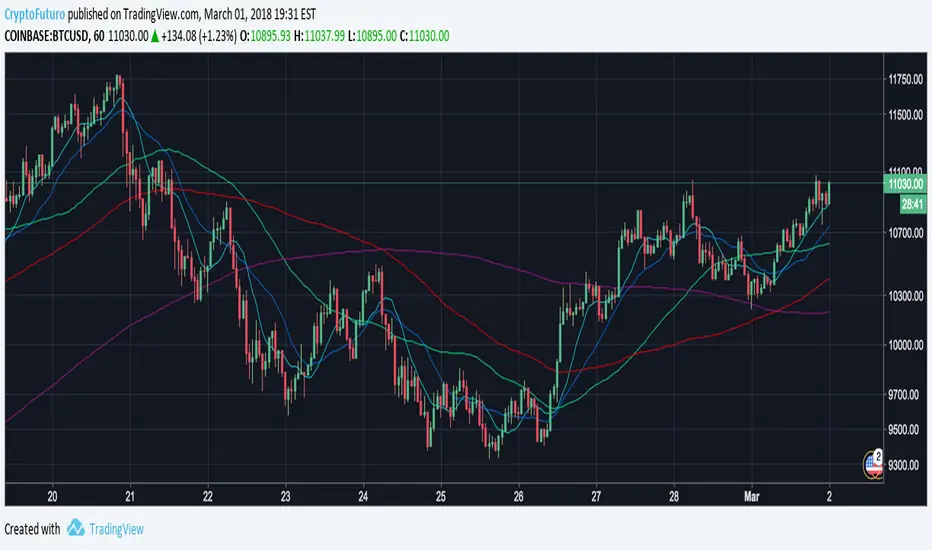
Multiple EMAs [CryptoFuturo]Enjoy viewing multiple Exponential Moving Averages (EMA) on your chart? Want to use only one indicator to display up to 5 EMAs? Then you've come to the right place!
FEATURES:
Configure and use up to 5 Exponential Moving Averages (EMA) using a single indicator.
Default lengths for the 5 EMAs are 10, 20, 50, 100, 200.
Length values, plot line colors and source data are all configurable.

Multiple SMAs [CryptoFuturo]Enjoy viewing multiple Simple Moving Averages (SMA) on your chart? Want to use only one indicator to display up to 5 SMAs? Then you've come to the right place!
FEATURES:
Configure and use up to 5 Simple Moving Averages ( SMA ) using a single indicator.
Default lengths for the 5 SMAs are 10, 20, 50, 100, 200.
Length values, plot line colors and source data are all configurable.
MA Cross 50/200 - Moving Averageindicates short-term 50-day moving average AND long-term 200-day moving average CROSS
@GateTicker

Multi-Timeframe Probability Zones [DW]This is an experimental study based on multi-timeframe price action and a simple average.
Use it to quickly identify MTF support and resistance, and high probability price levels.
NOTE: Because higher timeframe levels are not certain until the interval is closed, refresh your chart as new levels are drawn.

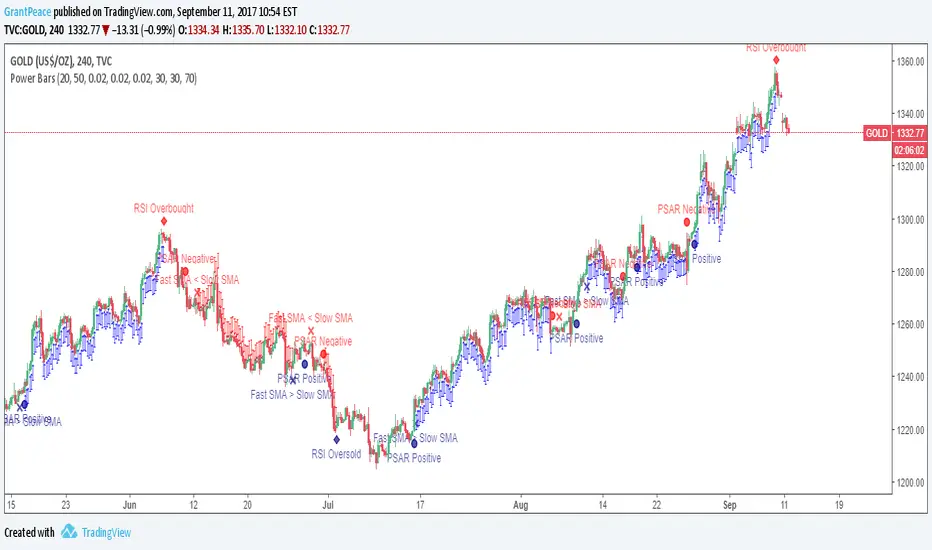
Power Bars This is the latest and greatest of technical analysis .
Values for your favourite indicators can easily be changed to customise your strategy.
When an indicator becomes bullish or bearish , a notification appears on the bar.
When all indicators align, Power Bars show up. Red Power Bars are bearish , blue Power Bars are bullish.
This is what the bars look like close-up.
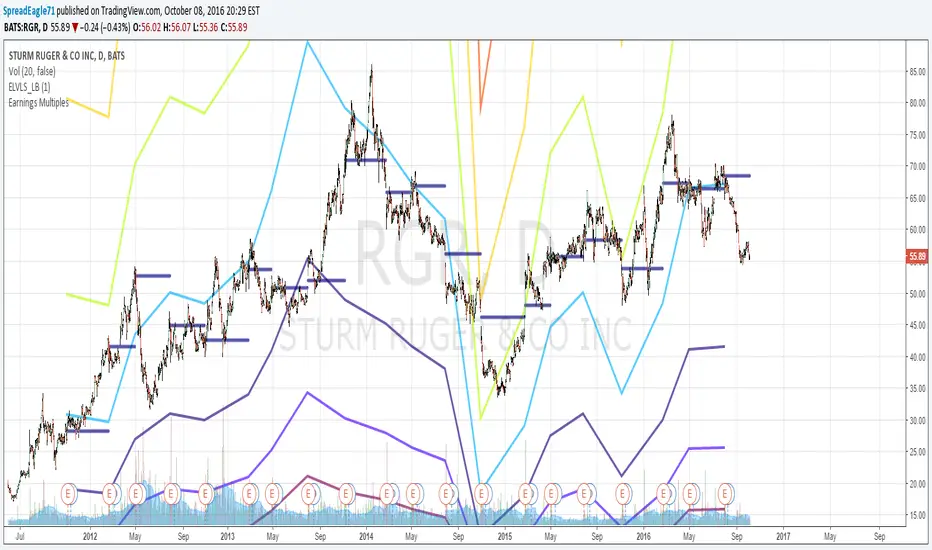
Earnings MultiplesMultiplies Quarterly Earnings x 13, x 21, x 34, x 55, x 89, x 144, x 233.
Yes its a fibonacci sequence.
"Goldilocks zone" seems to be in the 55x - 89x area.
Also when companies become profitable, the indicator looks like a "starburst".
EMA & SMA with FRACTAL DEVIATION BANDS by @XeL_ArjonaEMA & SMA with FRACTAL DEVIATION BANDS
Ver. 1.0.25.08.2015
By Ricardo M Arjona @XeL_Arjona
DISCLAIMER:
DISCLAIMER:
The Following indicator/code IS NOT intended to be a formal investment advice or recommendation by the author, nor should be construed as such. Users will be fully responsible by their use regarding their own trading vehicles/assets. The embedded code and ideas within this work are FREELY AND PUBLICLY available on the Web for NON LUCRATIVE ACTIVITIES and must remain as is.
WHAT IS THIS?
This is the adaptation of the FRACTAL DEVIATION BANDS to be used on Traditional Moving Averages (Simple & Exponential).
ALL NEW IDEAS OR MODIFICATIONS to these indicator(s) are Welcome in favor to deploy a better and more accurate readings. I will be very glad to be notified at Twitter or TradingVew accounts at: @XeL_Arjona
Any important addition to this work MUST REMAIN PUBLIC by means of CreativeCommons CC & TradingView.
2015

Acc/Dist. Cloud with Fractal Deviation Bands by @XeL_ArjonaACCUMULATION / DISTRIBUTION CLOUD with MORPHIC DEVIATION BANDS
Ver. 2.0.beta.23:08:2015
by Ricardo M. Arjona @XeL_Arjona
DISCLAIMER
The Following indicator/code IS NOT intended to be a formal investment advice or recommendation by the author, nor should be construed as such. Users will be fully responsible by their use regarding their own trading vehicles/assets.
The embedded code and ideas within this work are FREELY AND PUBLICLY available on the Web for NON LUCRATIVE ACTIVITIES and must remain as is.
Pine Script code MOD's and adaptations by @XeL_Arjona with special mention in regard of:
Buy (Bull) and Sell (Bear) "Power Balance Algorithm by Vadim Gimelfarb published at Stocks & Commodities V. 21:10 (68-72).
Custom Weighting Coefficient for Exponential Moving Average (nEMA) adaptation work by @XeL_Arjona with contribution help from @RicardoSantos at TradingView @pinescript chat room.
Morphic Numbers (PHI & Plastic) Pine Script adaptation from it's algebraic generation formulas by @XeL_Arjona
Fractal Deviation Bands idea by @XeL_Arjona
CHANGE LOG:
ACCUMULATION / DISTRIBUTION CLOUD: I decided to change it's name from the Buy to Sell Pressure. The code is essentially the same as older versions and they are the center core (VORTEX?) of all derived New stuff which are:
MORPHIC NUMBERS: The "Golden Ratio" expressed by the result of the constant "PHI" and the newer and same in characteristics "Plastic Number" expressed as "PN". For more information about this regard take a look at: HERE!
CUSTOM(K) EXPONENTIAL MOVING AVERAGE: Some code has cleaned from last version to include as custom function the nEMA , which use an additional input (K) to customise the way the "exponentially" is weighted from the custom array. For the purpose of this indicator, I implement a volatility algorithm using the Average True Range of last 9 periods multiplied by the morphic number used in the fractal study. (Golden Ratio as default) The result is very similar in response to classic EMA but tend to accelerate or decelerate much more responsive with wider bars presented in trending average.
FRACTAL DEVIATION BANDS: The main idea is based on the so useful Standard Deviation process to create Bands in favor of a multiplier (As John Bollinger used in it's own bands) from a custom array, in which for this case is the "Volume Pressure Moving Average" as the main Vortex for the "Fractallitly", so then apply as many "Child bands" using the older one as the new calculation array using the same morphic constant as multiplier (Like Fibonacci but with other approach rather than %ratios). Results are AWSOME! Market tend to accelerate or decelerate their Trend in favor of a Fractal approach. This bands try to catch them, so please experiment and feedback me your own observations.
EXTERNAL TICKER FOR VOLUME DATA: I Added a way to input volume data for this kind of study from external tickers. This is just a quicky-hack given that currently TradingView is not adding Volume to their Indexes so; maybe this is temporary by now. It seems that this part of the code is conflicting with intraday timeframes, so You are advised.
This CODE is versioned as BETA FOR TESTING PROPOSES. By now TradingView Admins are changing lot's of things internally, so maybe this could conflict with correct rendering of this study with special tickers or timeframes. I will try to code by itself just the core parts of this study in order to use them at discretion in other areas. ALL NEW IDEAS OR MODIFICATIONS to these indicator(s) are Welcome in favor to deploy a better and more accurate readings. I will be very glad to be notified at Twitter or TradingView accounts at: @XeL_Arjona

Trade Life Balance Multi EMAThe Trade Life Balance EMA Indicator is a versatile and essential tool for technical analysts and traders. It combines five of the most commonly used Exponential Moving Averages (EMAs) into a single indicator, and additionally offers two optional EMAs for advanced analysis. This indicator helps to quickly identify trend direction, dynamic support and resistance levels, and potential entry and exit points.
Important Note:
Moving averages are lagging indicators, meaning they are based on past price data and do not predict future price movements. For a comprehensive market analysis, it is highly recommended to use the TLB EMA indicator in combination with other analytical tools such as volume, price action, and oscillators.
How the TLB EMA Indicator Works
The indicator plots multiple Exponential Moving Averages directly on the price chart. An EMA is a type of moving average that gives more weight and significance to the most recent price data, making it more responsive to price changes than a Simple Moving Average (SMA).
Default Configuration:
The indicator comes pre-configured with five core EMAs that play a crucial role in many trading strategies:
EMA 13 & 20: Often used as short-term trend indicators. Their slope and the distance to the price can indicate the strength of the current momentum.
EMA 50: Considered an important mid-term trend indicator. A price holding above the 50 EMA often suggests a healthy uptrend.
EMA 100: Serves as a mid- to long-term trend filter.
EMA 200: Widely regarded as the decisive line between a long-term bull and bear market.
The color scheme, ranging from light red (fastest EMA) to dark red (slowest EMA), facilitates quick visual identification.
Customization Options
The TLB EMA indicator is fully customizable to suit individual trading strategies and preferences:
EMA Lengths: All five standard EMAs, as well as the two optional ones, can be set to any desired length in the "Inputs" settings.
Optional EMAs: Two additional EMAs are disabled by default. They can be activated via a checkbox to supplement the analysis with other user-defined periods (e.g., for Fibonacci numbers or specific strategies).
Visual Style: In the "Style" tab of the indicator settings, the color, thickness, and visibility of each individual EMA line can be adjusted as desired.
Advantages of the TLB EMA Indicator
All-in-One Solution: Consolidates the most important EMAs into a single indicator, keeping the chart view clean and eliminating the need to add multiple individual indicators.
High Flexibility: With fully customizable lengths and two optional EMAs, the indicator can be configured for any strategy and any market (stocks, forex, crypto, etc.).
Visual Clarity: The pre-configured color coding allows for an intuitive and quick interpretation of the different trend speeds.
Efficiency: Saves time in chart setup and analysis.
Using the TLB EMA Indicator
The TLB EMA can be used in various ways in trading:
Trend Identification: The simplest application is to determine the overall trend. If the price is above the EMAs (especially the 200), it indicates an uptrend. If it is below, the trend is downward.
Dynamic Support and Resistance: In an uptrend, the EMAs often act as dynamic support zones where the price can bounce. In a downtrend, they serve as dynamic resistance zones.
Crossover Signals: The crossing of EMAs can generate trading signals. A "Golden Cross" (e.g., the 50 EMA crosses above the 200 EMA) is considered a bullish signal, while a "Death Cross" (50 EMA crosses below the 200 EMA) is considered a bearish signal.
Please note that the TLB EMA indicator is a tool for analysis and does not guarantee profitable trades. Always use it in conjunction with a solid risk management strategy.