VWAP Market Structure Signals - ALCOTRADE Pro2VWAP-anchored signals with Liquidity Sweeps, Big Trades, and Market Structure filters — with symbol-aware presets for BTC/ETH/XAU.
---
**What it is**
A VWAP-anchored decision framework that combines:
1. Regime & trend via Weekly/Daily VWAP slope and ADX
2. Liquidity Sweeps (SFP) with wick/displacement/imbalance checks
3. Pullback/Breakout triggers with retest tolerance
4. “Big Trades” using volume & |delta| z-scores
5. Market Structure with a significance filter (min break %, swing ≥ ATR×, pivot age)
6. A MASTER state with weighted scoring and hysteresis
**Why combine these**
VWAP defines fair-value & regime; SFP hunts liquidity; PB/BO captures continuation/expansion; Big Trades confirm participation; Market Structure filters weak breaks. Together they reduce noise and keep signals context-aware.
**How it works (short)**
- **Regime:** Anchor = W-VWAP (or D-VWAP / HTF-MA). Slope (bps/bar) + ADX gate signals.
- **Proximity:** Signals prefer near-VWAP or within deviation bands.
- **Triggers:** SFP (wick %, ATR share, displacement/imbalance), Pullback/Breakout with retest tolerance, Big Trades z-scores.
- **Market Structure:** BOS/ChoCH must be “significant” (break %, swing ≥ ATR×, pivot age).
- **MASTER:** Weighted ensemble (SFP/PB/BO/BT/RSI/Slope/MS) with hysteresis, one MASTER per swing, cooldown.
**Presets**
Symbol-aware presets for **BTC/ETH/XAU** with tuned thresholds per timeframe (5m, 15m, 1h, 4h): proximity to VWAP, slope, ADX, zVol/z|Delta|, retest tolerance, and cooldown — designed to keep low noise on lower TFs.
**Usage**
1. Apply on a clean chart (no extra indicators on the publish screenshot).
2. Mode = **Full** for signals, or **VWAP only** for context.
3. Pick **Preset = Auto (symbol & TF)** or select a specific BTC/ETH/XAU preset.
4. Optional filters: RSI/MACD, HTF-MA and HTF Trend.
5. Signal markers are kept minimal by default (Shape). Enable labels only if needed.
**Alerts**
- `ALCOTRADE LONG`, `ALCOTRADE SHORT` with SL/TP1/TP2 payload (JSON).
- `ALCOTRADE MASTER LONG`, `ALCOTRADE MASTER SHORT` with score/ensemble payload.
**Inputs (high-level)**
- VWAPs (D/W/M) and deviation bands, proximity % or ATR.
- Triggers: SFP, Pullback/Breakout + retest tolerance.
- Filters: Slope, ADX, RSI/MACD, HTF-MA, HTF Trend.
- Market Structure significance filter (break %, swing≥ATR×, age).
- Big Trades (z-scores on volume and |delta|).
- Presets for BTC/ETH/XAU (Auto by symbol & TF).
- Performance controls: draw last N bars, minimal markers, debug table (off by default).
**Notes & Limits**
No performance promises. Not financial advice. Works best on liquid symbols. Heavy HTF requests may add overhead — keep debug off for a clean publish and faster rendering.
---
**خلاصهٔ کاربردی (فارسی)**
این اندیکاتور چارچوب تصمیمگیری مبتنی بر **VWAP** است که **ترند/رژیم، نزدیکی به VWAP، تریگرهای SFP و Pullback/Breakout، تأیید Big Trades با z-score، فیلتر ساختار بازار با «اهمیت»، و حالت MASTER با امتیازدهی وزنی** را ترکیب میکند. برای **BTC/ETH/XAU** پریستهای هوشمند 5m تا 4h دارد. روی چارت تمیز استفاده کنید؛ «Full» برای سیگنال و «VWAP only» برای کانتکست. هشدارها LONG/SHORT/MASTER با JSON هستند.
---
**Screenshot guideline**
Publish on a clean chart (no extra indicators/labels; debug = off; markers = Shape).
---
**Tags**
VWAP, Market Structure, Liquidity, SFP, BOS, ChoCH, Pullback, Breakout, Order Flow, Volume, Delta, Z-score, Big Trades, BTC, ETH, Gold, Futures, Risk Management
For access requests and subscription details, please see my TradingView profile.
Cerca negli script per "GOLD"

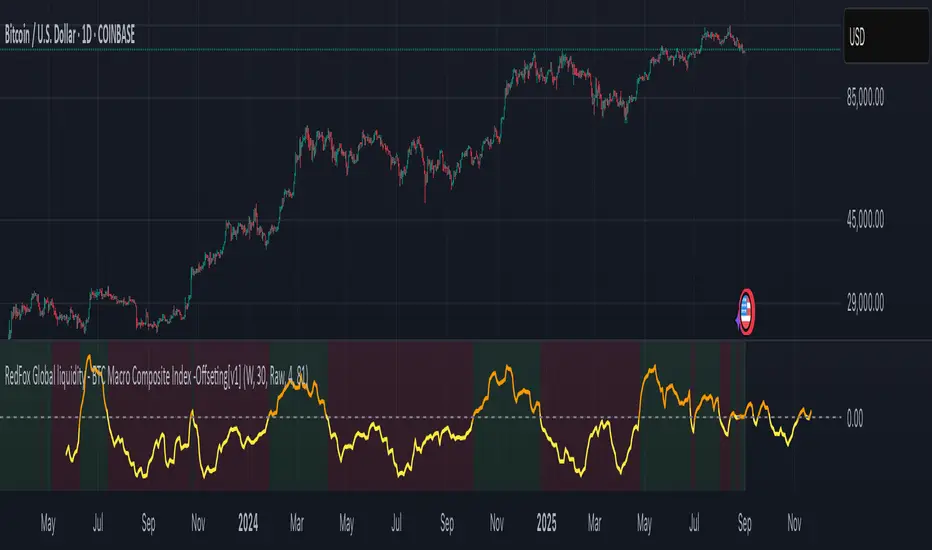
BTC Macro Composite Global liquidity Index -OffsetThis indicator is based on the thesis that Bitcoin price movements are heavily influenced by macro liquidity trends. It calculates a weighted composite index based on the following components:
• Global Liquidity (41%): Sum of central bank balance sheets (Fed , ECB , BoJ , and PBoC ), adjusted to USD.
• Investor Risk Appetite (22%): Derived from the Copper/Gold ratio, inverse VIX (as a risk-on signal), and the spread between High Yield and Investment Grade bonds (HY vs IG OAS).
• Gold Sensitivity (15–20%): Combines the XAUUSD price with BTC/Gold ratio to reflect the historical influence of gold on Bitcoin pricing.
Each component is normalized and then offset forward by 90 days to attempt predictive alignment with Bitcoin’s price.
The goal is to identify macro inflection points with high predictive value for BTC. It is not a trading signal generator but rather a macro trend context indicator.
❗ Important: This script should be used with caution. It does not account for geopolitical shocks, regulatory events, or internal BTC market structure (e.g., miner behavior, on-chain metrics).
💡 How to use:
• Use on the 1D timeframe.
• Look for divergences between BTC price and the macro index.
• Apply in confluence with other technical or fundamental frameworks.
🔍 Originality:
While similar components exist in macro dashboards, this script combines them uniquely using time-forward offsets and custom weighting specifically tailored for BTC behavior.
Greer Fair Value✅ Greer Fair Value
Greer Fair Value: Graham intrinsic value + Buffett-style DCF with auto EPS/FCF and auto growth (CAGR of FCF/share), defaulting to a simple GFV badge that color-codes opportunity at a glance.
📜 Full description
Greer Fair Value is inspired by the valuation frameworks of Benjamin Graham and Warren Buffett. It combines Graham’s rate-adjusted intrinsic value with a two-stage, per-share DCF. The script auto-populates EPS (TTM) and Free Cash Flow per share (FY/FQ/TTM) from request.financial(), and can auto-estimate the near-term growth rate (g₁) using the CAGR of FCF/share over a user-selected lookback (with sensible caps). All assumptions remain editable.
Default view: only the GFV badge is shown to keep charts clean.
Badge color logic:
Gold — both DCF and Graham fair values are above the current price
Green — exactly one of them is above the current price
Red — the current price is above both values
Show more detail (optional):
Toggle “Show Graham Lines” and/or “Show DCF Lines” to plot fair values (and optional MoS bands) over time.
Toggle “Show Dashboard” for a compact data table of assumptions and outputs.
Optional summary label can be enabled for a quick on-chart readout.
Inputs you can customize: EPS source/manual fallback, FCF/share source (FY/FQ/TTM), g₁ auto-CAGR lookback & caps, terminal growth gT, discount rate r, MoS levels, step-style plots, table position, and decimals.
Note: TradingView’s UI controls whether “Inputs/Values in Status Line” are shown. If you prefer a clean status line, open the indicator’s settings and uncheck those options, then Save as default.
Disclaimer: For educational/informational purposes only; not financial advice. Markets involve risk—do your own research.

量价标准化分析指标指标旨在通过量价关系的标准化分析,捕捉市场中的价格动能(Price Strength)和成交量强度(Volume Strength),并生成相对流量(RROF)指标,结合信号线和偏见/情绪线进行交易决策支持。主要功能包括:相对流量(RROF):结合价格强度(基于K线形态和价格变化)和成交量强度,计算量价加权的相对强度指标。
EVEREX 带:以可视化“均衡带”形式显示标准化价格和成交量强度,类似于音量均衡器。
偏见/情绪(Bias/Sentiment):基于较长周期计算市场趋势方向,提供背景趋势参考。
关键形态标记:识别“Ease of Movement”(价格强于成交量)和“Compression”(价格弱于成交量)形态,标记潜在交易机会。
警报系统:支持多头(金叉)和空头(死叉)信号,基于RROF和信号线的交叉。
指标适合日内交易、波段交易和动能分析,适用于有成交量数据的市场(如股票、期货)和无成交量数据的市场(如某些外汇对)
The indicators aim to capture price strength and volume strength in the market through standardized analysis of volume price relationships, and generate relative flow (RROF) indicators to support trading decisions by combining signal lines and bias/sentiment lines. The main functions include: Relative Flow (RROF): combining price intensity (based on K-line patterns and price changes) and trading volume intensity to calculate a volume price weighted relative strength indicator.
EVEREX Band: Displays standardized prices and trading volume intensity in the form of a visual 'balanced band', similar to a volume equalizer.
Bias/Sentiment: Calculate market trend direction based on longer cycles and provide background trend references.
Key form markers: Identify the "Ease of Movement" (price stronger than volume) and "Compression" (price weaker than volume) forms, and mark potential trading opportunities.
Alarm system: supports bullish (golden cross) and bearish (dead cross) signals, based on the intersection of RROF and signal lines.
The indicator is suitable for intraday trading, band trading, and momentum analysis, and is applicable to markets with trading volume data (such as stocks and futures) and markets without trading volume data (such as certain forex pairs)

Ai Golden Support and Resistance Adaptive Support & Resistance (ADR-scaled ABCD + Breakout/Retest Zones)
What it does
This indicator detects actionable support/resistance zones from swing structure and breakout events, then keeps each zone active until it’s invalidated by price. It adapts zone sensitivity using Average Daily Range (ADR) so the same rules scale across symbols and vol regimes.
Core Logic (high level)
Swing & ABCD pattern seed
Detects alternating pivots (high–low–high–low or low–high–low–high) using a user-selected lookback.
Validates basic AB–BC–CD proportions: BC must retrace a portion of AB; CD must extend BC within a set range.
From a valid sequence, sets a candidate level (top for bearish, bottom for bullish).
Breakout confirmation
A level becomes confirmed when price closes beyond it (crossover/crossunder).
On confirmation, the script draws a dotted reference line and records how many bars elapsed from the seed pivot to breakout. That count defines the lookback window used for local extremes.
Zone construction
Supply (bearish): builds a box around the most recent local range near the bearish seed;
Demand (bullish): builds a box around the most recent local range near the bullish seed.
Each zone’s height is derived from nearby extremes and the seed swing, so boxes reflect local structure rather than fixed pip widths.
Volatility normalization (ADR%)
ADR is computed from daily candles.
The Risk Profile input (“High/Medium/Low”) scales required move sizes using ADR%, and adjusts pivot sensitivity (fewer/more bars).
Higher risk → more sensitive (smaller ADR %, tighter pivot lookback).
Lower risk → stricter filters (larger ADR %, wider pivot lookback).
Explosive-move filter (streak logic)
Searches the seeded lookback for consecutive same-color candles (config via the risk profile).
Requires the cumulative % move of that streak to exceed an ADR-scaled threshold.
When found, the zone is tagged as originating from an “explosive” move (potentially higher reaction probability).
Zone persistence & invalidation
Zones persist and auto-extend to the right until invalidated.
Invalidation occurs when price closes through a rule-based threshold derived from the seed structure (stored per zone).
Once invalidated, the zone is marked inactive and stops updating.
Inputs & Controls
Risk Profile: High / Medium / Low (sets pivot lookback, streak length, and ADR% thresholds).
Labels & Visuals: Toggle labels and level lines; set line width.
Colors/Boxes: Supply (red), Demand (green); dotted breakout references.
No broker/session settings are required; the script adapts per symbol via ADR.
On-Chart Elements
Dotted breakout lines at confirmed levels (with measured bars-to-breakout).
Supply/Demand boxes that extend until invalidation.
Optional labels for clarity; minimal clutter by default.
How to Use
Context: Use higher-TF context for bias; apply zones on your trading TF.
Confluence: Combine zones with your own triggers (structure breaks, rejection wicks, momentum shifts).
Invalidation: If price closes beyond a zone’s invalidation threshold, treat that zone as inactive.
Sensitivity: If too many zones appear, switch to Medium/Low Risk (stricter ADR% & pivots); if too few, use High Risk.
Notes & Limitations
Logic is rule-based; there is no machine learning.
Daily ADR is computed from D timeframe, so intraday charts inherit daily volatility context.
Results vary by symbol and timeframe; validate settings per market.
This is an indicator (no orders or P/L).

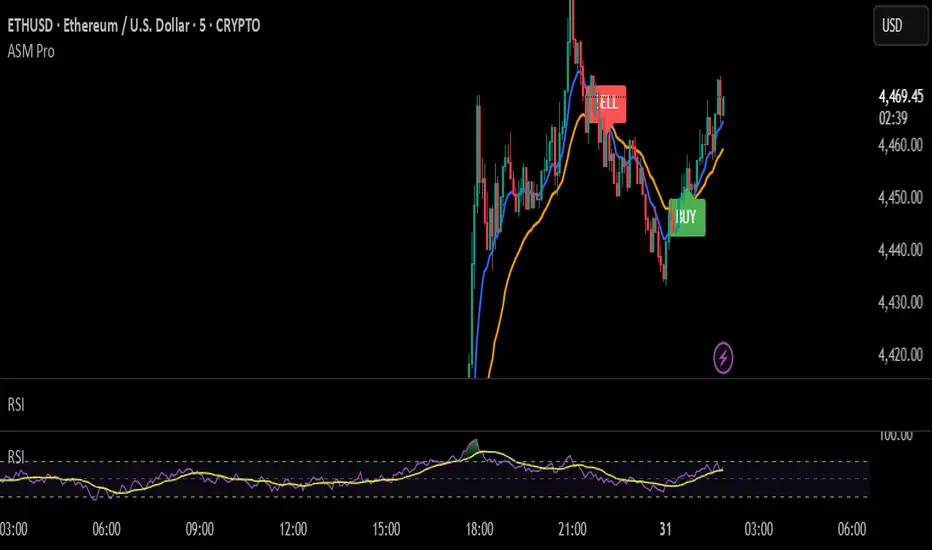
ASM Pro EMA Indicator – Smart Buy/Sell SignalsAdvanced EMA crossover indicator with auto Buy/Sell signals, real-time alerts, and multi-market support. Perfect for Indian Market, Crypto, Forex & Stocks traders.
🔹ASM Pro EMA Indicator – Key Features:
1.Dual EMA Crossover Strategy – Detects market trend shifts using Fast & Slow EMA crossover.
2.Auto Buy/Sell Labels – Instantly shows clear green BUY and red SELL signals on chart.
3.Multi-Timeframe Support – Works smoothly from 1-minute to daily charts.
4.Real-Time Alerts – Receive instant alerts on TradingView app, email, or pop-up.
5.Beginner Friendly – Simple, easy-to-use with no complex setup.
6.Professional Look – Premium design with Blue & Orange EMAs + smart labels.
7.Universal Market Fit – Optimized for Crypto, Forex, Stocks, and Gold.
8.Low Lag Signals – Faster and more reliable than standard EMA crossovers.
9.Risk-Reward Friendly – Helps traders find clear entries, stop-loss, and exit zones.
10.Premium Access Model – Available via monthly & yearly subscription.
🔹How to Make Profit with ASM Pro EMA Indicator:
1.Follow Buy/Sell Signals with Discipline – Enter on Green BUY, exit/short on Red SELL.
2.Use Multi-Timeframe Confirmation – Small timeframe entry, big timeframe trend confirmation.
3.Set Stop-Loss at EMA Levels – Below EMA for BUY, above EMA for SELL.
4.Book Partial Profits – Secure 50% at key levels, trail the rest with EMA.
5.Trade Only Trending Markets – Works best in strong uptrend or downtrend.
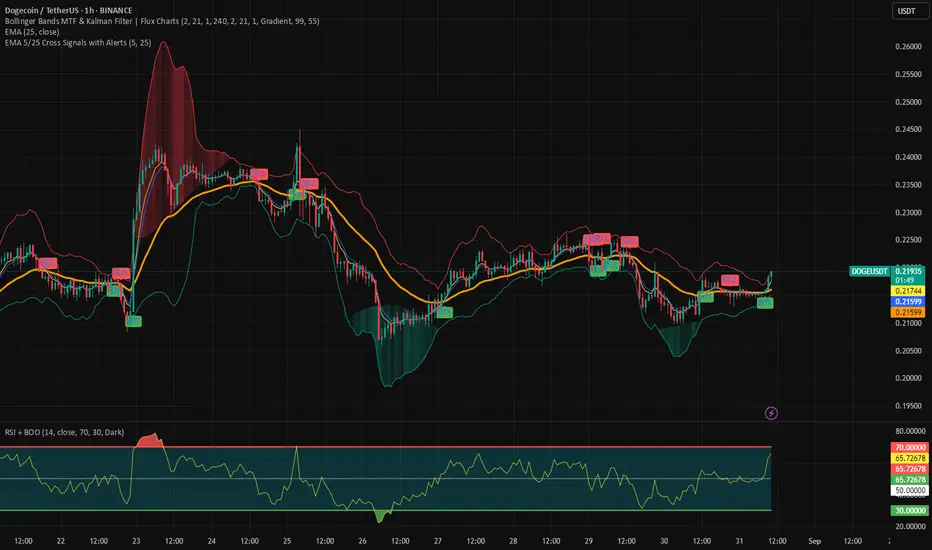
EMA 5/25 Cross Signals with AlertsIt is EMA 5/25 Cross Signals with Alerts
So you can find Golden Cross and Dead Cross
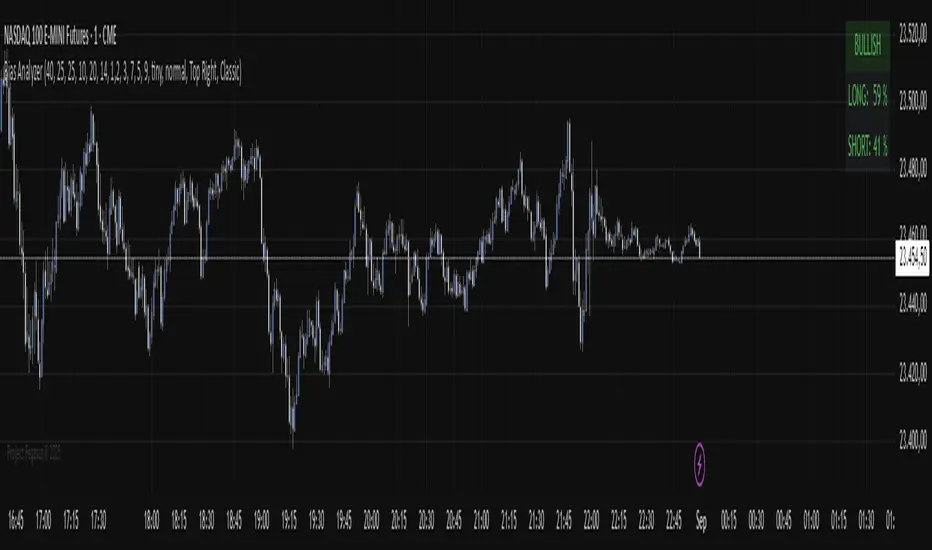
Bias AnalyzerBias Analyzer – Institutional Bias Scoring Tool
The Bias Analyzer combines multiple institutional trading concepts into a single adaptive scoring system. It calculates a directional bias score (0–100) by weighting volume, trend, structure, VWAP/imbalance, and momentum.
🔹 Main Features
Volume Bias → cumulative buy/sell pressure (customizable lookback)
Trend Bias → based on short-term moving average confirmation
Structure Bias → swing high/low detection with ATR filter
VWAP / Imbalance Bias → price relation to VWAP
Momentum Factor → adaptive impulse weighting
Final Bias Score → combined & volatility-adjusted (0–100 scale)
Flip Markers → optional EMA dots when bias changes
Bias Widget → on-chart display with long/short percentage and multiple style presets (Classic, Dark, Neon, Terminal, Gold, Midnight, Purple, etc.)
Custom Mode → fully user-defined widget colors
🔹 Use Case
This tool helps traders to quickly identify the institutional directional bias of the market.
It is designed as a decision-support indicator and not as an automated trading system.
© 2025 Project Pegasus
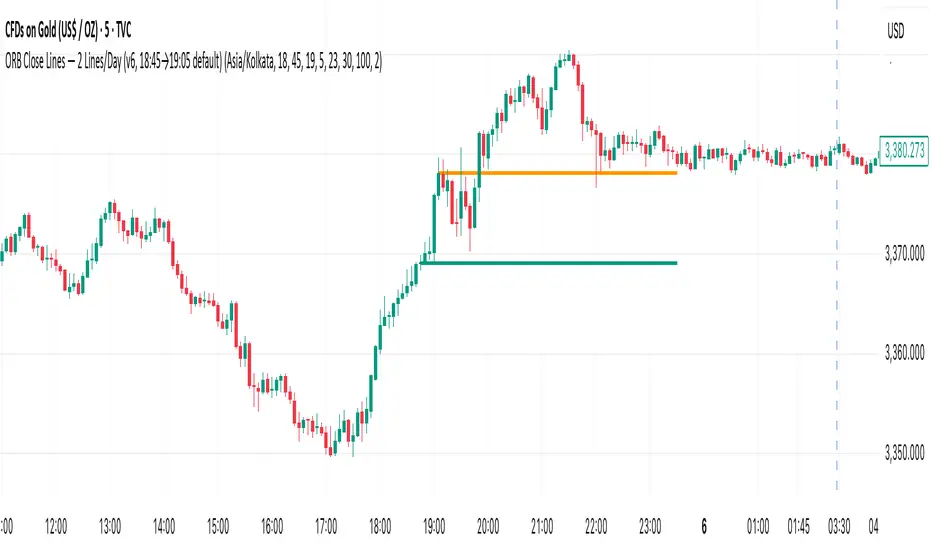
ARB Close Lines —18:45→19:05 his indicator plots exactly two horizontal lines per day:
Start line at the close of the 18:45 IST candle.
End line at the close of the 19:05 IST candle.
Both lines automatically extend to 23:30 IST (default, fully editable).
Features
Adjustable Start / End time (hour + minute, default 18:45 → 19:05).
Adjustable extension time (default 23:30).
Keeps the last N days of lines (default 100).
Works on intraday timeframes (1m–60m).
Clean: always exactly two lines per day.
Usage
Helps track short intraday windows (e.g., 20-minute ORB around 18:45–19:05 IST) for evening breakout/trap setups. Ideal for gold, Bitcoin, or other 24/7 instruments.
ARB 18:00–19:00 IST — Lines Only (v6)Draws a simple Opening Range for 24/7 markets using a custom time window. By default it captures the high and low formed between 18:00 and 19:00 IST each day, then locks those levels at 19:00 and extends two horizontal lines to the right. No alerts, no signals—pure levels so you can track breakouts or traps manually.
How it works
Uses a session in your chosen Timezone (default: Asia/Kolkata) to detect the 18:00–19:00 window.
Continuously updates the range during the window.
At 19:00 IST the range is “locked” and two lines (Range High/Range Low) are drawn and extended right.
Old lines are cleared so only the latest day’s ORB remains.
Inputs
Timezone (IANA): e.g., Asia/Kolkata, Asia/Dubai, UTC.
Start Hour / End Hour: default 18 → 19 (1-hour window). End must be after Start.
Line Width / Colors for High & Low.
Best used on
Intraday timeframes (1–60m).
24/7 symbols like BTCUSD, XAUUSD, major crypto pairs, spot gold.
Works regardless of your broker’s server timezone because the script uses the selected IANA timezone.
Notes
This is levels only: no alerts, no entries/exits, no statistics.
If you reload the chart after the window, lines persist and stay synced to the locked values.
Change the timezone if you want to anchor the window to a different locale.
Version: 1.0 (Pine v6).

MEMA X-OL9+A. 5, 10, 20, 50 ema's
B. When the 10 goes below the 20 it has shades of red between the 10 and 20.
C. When there is a downward crossover, There will be a Red arrow pointing down.
D. When the 10 is moving closer (upward) towards the 20 it has orange shading. I use this to catch 10 over 20 crossovers.
E. When there is a crossover 10 over 20 it will shade green and have a gold arrow pointing upward. A little redundant, because you'll see the crossover from the shading.
F. Finally there will be smaller blue arrows that represent when there is a close of a candle, if it is lower than the prior candle.
All customizable and defaults should work.

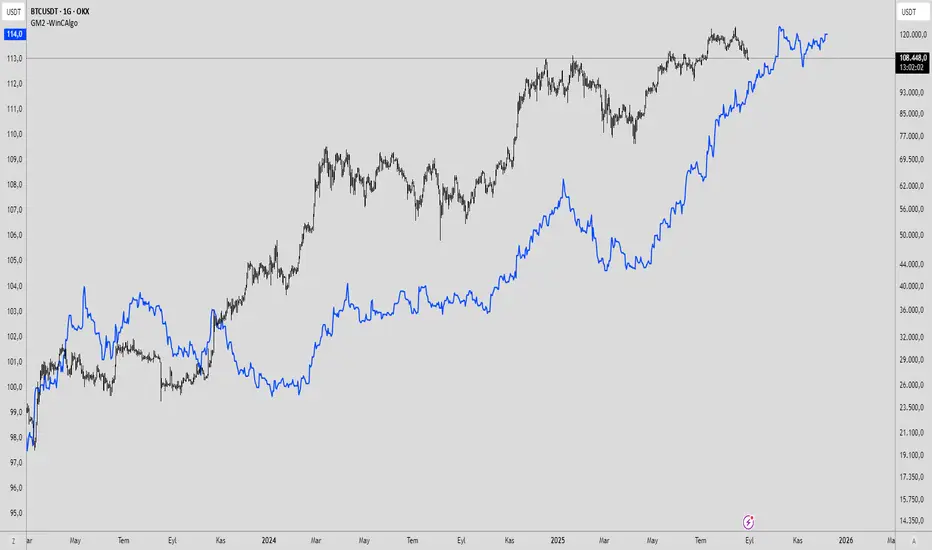
Global M2 Money Supply -WinCAlgoWhat is this Indicator?
The Global M2 Money Supply Indicator aggregates the M2 money supply data from 20 major economies worldwide, converted to USD. This powerful macro-economic tool tracks the total liquidity injected into the global financial system, providing crucial insights for long-term investment decisions across all asset classes including crypto, stocks, bonds, and commodities.
Key Features:
20 Major Economies: US, EU, China, Japan, UK, Canada, Switzerland, and 13 other significant markets
USD Normalized: All currencies converted to USD for unified comparison
Real-time Data: Updates with latest central bank releases
Time Offset: Adjustable time offset for correlation analysis (-1000 to +1000 days)
Macro Analysis: Essential tool for understanding global liquidity cycles
How to Use:
Long-term Analysis: Use on weekly/monthly timeframes for macro trend identification
Liquidity Cycles: Rising M2 typically correlates with asset price increases
Market Timing: Major inflection points often coincide with policy changes
Cross-Asset Analysis: Compare with Bitcoin, Gold, Stock indices for correlation
Time Offset: Adjust offset to analyze leading/lagging relationships
Trading Applications:
Crypto Analysis: Bitcoin and altcoins often correlate with global liquidity
Stock Markets: Equity valuations tend to follow liquidity expansion/contraction
Commodities: Gold, Silver, and other commodities react to money supply changes
Bond Markets: Interest rate expectations influenced by monetary policy
Currency Analysis: Understand relative strength between major currencies
Investment Strategy:
Rising Trend: Indicates increasing global liquidity - favorable for risk assets
Declining Trend: Suggests tightening conditions - defensive positioning recommended
Acceleration/Deceleration: Changes in slope indicate shifting monetary policy
Correlation Analysis: Use time offset to find optimal lead/lag relationships
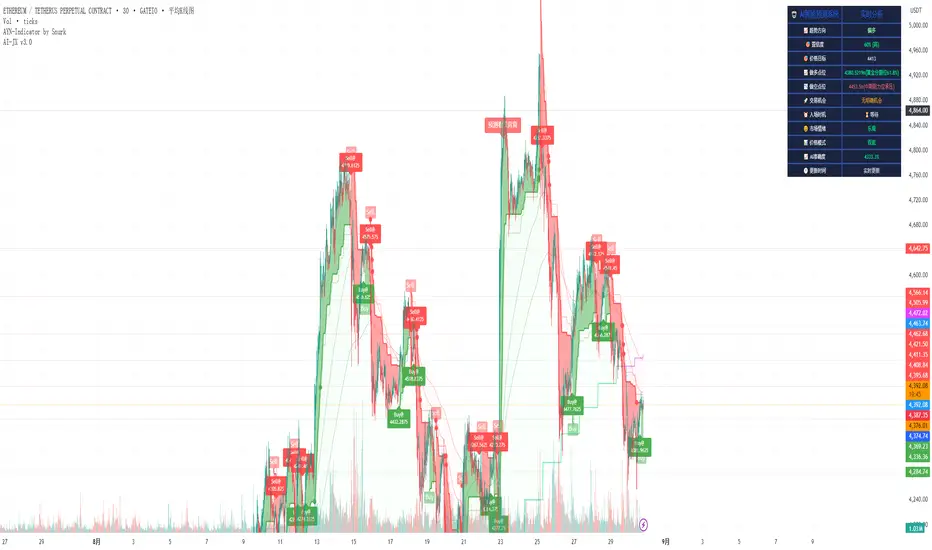
AI-JX# AI-JX v3.0 指标技术分析文档 / Technical Analysis Documentation
## 1. 指标概述 / Indicator Overview
AI-JX v3.0 是一个集成了人工智能学习系统的高级技术分析指标,结合了传统技术指标与AI预测功能,提供多维度的市场分析和交易信号。该指标基于Heikin Ashi蜡烛图和SuperTrend技术,通过AI权重学习系统动态优化参数组合。
AI-JX v3.0 is an advanced technical analysis indicator that integrates an artificial intelligence learning system, combining traditional technical indicators with AI prediction capabilities to provide multi-dimensional market analysis and trading signals. The indicator is based on Heikin Ashi candlesticks and SuperTrend technology, dynamically optimizing parameter combinations through an AI weight learning system.
## 2. 核心信号系统 / Core Signal System
### 2.1 主要交易信号 / Main Trading Signals
#### AI智能买卖信号 / AI Smart Buy/Sell Signals
- **AI买入信号 / AI Buy Signal**: 当buyScore ≥ 70分且AI确认无假突破时触发 / Triggered when buyScore ≥ 70 and AI confirms no false breakout
- **AI卖出信号 / AI Sell Signal**: 当sellScore ≥ 70分且AI确认无假突破时触发 / Triggered when sellScore ≥ 70 and AI confirms no false breakout
- **信号特点 / Signal Features**: 基于多指标融合评分,具有较高的准确性 / Based on multi-indicator fusion scoring with high accuracy
#### 传统SuperTrend信号 / Traditional SuperTrend Signals
- **传统买入 / Traditional Buy**: 趋势从下降转为上升时触发 / Triggered when trend changes from down to up
- **传统卖出 / Traditional Sell**: 趋势从上升转为下降时触发 / Triggered when trend changes from up to down
- **显示方式 / Display Method**: 小尺寸标签,作为参考信号 / Small-sized labels as reference signals
### 2.2 预测性信号 / Predictive Signals
#### 预测强买信号 / Predictive Strong Buy Signal
**触发条件 / Trigger Conditions**:
- RSI < 35 (超卖 / Oversold)
- MACD线上穿信号线 / MACD line crosses above signal line
- 价格接近支撑位(距离<2.5%) / Price near support level (distance <2.5%)
- 成交量放大确认(>1.5倍均量) / Volume confirmation (>1.5x average volume)
- 无假突破向下 / No false breakout downward
#### 预测强空信号 / Predictive Strong Sell Signal
**触发条件 / Trigger Conditions**:
- RSI > 65 (超买 / Overbought)
- MACD线下穿信号线 / MACD line crosses below signal line
- 价格接近阻力位(距离<2.5%) / Price near resistance level (distance <2.5%)
- 成交量放大确认(>1.5倍均量) / Volume confirmation (>1.5x average volume)
- 无假突破向上 / No false breakout upward
### 2.3 背离信号 / Divergence Signals
#### 预测性看涨背离 / Predictive Bullish Divergence
- 价格创新低但RSI未创新低 / Price makes new low but RSI doesn't make new low
- 结合成交量和动量确认 / Combined with volume and momentum confirmation
- 提示潜在的反转机会 / Indicates potential reversal opportunity
#### 预测性看跌背离 / Predictive Bearish Divergence
- 价格创新高但RSI未创新高 / Price makes new high but RSI doesn't make new high
- 结合成交量和动量确认 / Combined with volume and momentum confirmation
- 提示潜在的顶部风险 / Indicates potential top risk
## 3. AI学习系统 / AI Learning System
### 3.1 参数组合策略 / Parameter Combination Strategies
#### 保守型组合 / Conservative Combination
- **适用场景 / Application Scenario**: 横盘震荡市场 / Sideways oscillating markets
- **RSI周期 / RSI Period**: 21
- **MACD参数 / MACD Parameters**: 12,26,9
- **ATR周期 / ATR Period**: 14
- **特点 / Features**: 稳定性高,信号较少但准确性好 / High stability, fewer signals but good accuracy
#### 激进型组合 / Aggressive Combination
- **适用场景 / Application Scenario**: 强趋势突破市场 / Strong trending breakout markets
- **RSI周期 / RSI Period**: 12
- **MACD参数 / MACD Parameters**: 6,21,5
- **ATR周期 / ATR Period**: 10
- **特点 / Features**: 敏感性高,信号较多但需要过滤 / High sensitivity, more signals but require filtering
#### 平衡型组合 / Balanced Combination
- **适用场景 / Application Scenario**: 通用市场环境 / General market conditions
- **RSI周期 / RSI Period**: 17
- **MACD参数 / MACD Parameters**: 10,24,7
- **ATR周期 / ATR Period**: 12
- **特点 / Features**: 平衡敏感性和稳定性 / Balances sensitivity and stability
### 3.2 权重自适应调整 / Adaptive Weight Adjustment
- **学习机制 / Learning Mechanism**: 基于历史交易表现动态调整权重 / Dynamically adjusts weights based on historical trading performance
- **最小学习交易数 / Minimum Learning Trades**: 20笔 / 20 trades
- **学习速率 / Learning Rate**: 0.1 (可调 / adjustable)
- **记忆长度 / Memory Length**: 100笔交易 / 100 trades
## 4. 市场状态识别 / Market State Recognition
### 4.1 市场模式分类 / Market Pattern Classification
- **强趋势突破 / Strong Trend Breakout**: 波动率>1.5且趋势强度>5% / Volatility >1.5 and trend strength >5%
- **横盘震荡 / Sideways Oscillation**: 波动率<0.7且趋势强度<2% / Volatility <0.7 and trend strength <2%
- **上升趋势 / Uptrend**: 20日涨幅>3% / 20-day gain >3%
- **下降趋势 / Downtrend**: 20日跌幅>3% / 20-day decline >3%
- **弱势整理 / Weak Consolidation**: 其他情况 / Other conditions
### 4.2 支撑阻力分析 / Support and Resistance Analysis
#### 动态支撑阻力 / Dynamic Support and Resistance
- **计算方式 / Calculation Method**: 基于历史高低点统计 / Based on historical high/low statistics
- **强度分级 / Strength Classification**: 强/中等/弱 (基于触及次数) / Strong/Medium/Weak (based on touch count)
- **有效性 / Validity**: 价格偏差<0.2%认定为有效触及 / Price deviation <0.2% considered valid touch
#### 斐波那契关键位 / Fibonacci Key Levels
- **23.6%回撤位 / 23.6% Retracement**
- **38.2%回撤位 / 38.2% Retracement**
- **50.0%回撤位 / 50.0% Retracement**
- **61.8%回撤位 / 61.8% Retracement**
- **78.6%回撤位 / 78.6% Retracement**
## 5. 风险控制机制 / Risk Control Mechanisms
### 5.1 假突破识别 / False Breakout Identification
#### 向上假突破 / Upward False Breakout
- 价格突破阻力位后快速回落 / Price breaks resistance then quickly falls back
- 成交量萎缩(<0.8倍均量) / Volume shrinks (<0.8x average volume)
- 自动过滤相关买入信号 / Automatically filters related buy signals
#### 向下假突破 / Downward False Breakout
- 价格跌破支撑位后快速反弹 / Price breaks support then quickly rebounds
- 成交量萎缩(<0.8倍均量) / Volume shrinks (<0.8x average volume)
- 自动过滤相关卖出信号 / Automatically filters related sell signals
### 5.2 多时间框架验证 / Multi-Timeframe Validation
- **时间框架1 / Timeframe 1**: 5分钟 / 5 minutes
- **时间框架2 / Timeframe 2**: 15分钟 / 15 minutes
- **时间框架3 / Timeframe 3**: 60分钟 / 60 minutes
- **一致性要求 / Consistency Requirement**: 三个时间框架趋势方向一致时信号更可靠 / Signals are more reliable when all three timeframes show consistent trend direction
## 6. AI预测功能 / AI Prediction Features
### 6.1 趋势预测系统 / Trend Prediction System
#### 预测评分机制 / Prediction Scoring Mechanism
- **多时间框架一致性 / Multi-Timeframe Consistency**: 30分 / 30 points
- **价格动量分析 / Price Momentum Analysis**: 25分 / 25 points
- **成交量确认 / Volume Confirmation**: 20分 / 20 points
- **支撑阻力位置 / Support/Resistance Position**: 25分 / 25 points
#### 预测结果分类 / Prediction Result Classification
- **强烈看涨 / Strong Bullish**: 评分>80 / Score >80
- **温和看涨 / Moderate Bullish**: 评分60-80 / Score 60-80
- **震荡 / Sideways**: 评分40-60 / Score 40-60
- **温和看跌 / Moderate Bearish**: 评分20-40 / Score 20-40
- **强烈看跌 / Strong Bearish**: 评分<20 / Score <20
### 6.2 智能点位识别 / Smart Level Identification
#### 最佳做多点位 / Optimal Long Entry Points
- 基于支撑位和斐波那契回撤 / Based on support levels and Fibonacci retracements
- 结合RSI超卖和MACD金叉 / Combined with RSI oversold and MACD golden cross
- 提供具体价位和置信度 / Provides specific price levels and confidence scores
#### 最佳做空点位 / Optimal Short Entry Points
- 基于阻力位和斐波那契回撤 / Based on resistance levels and Fibonacci retracements
- 结合RSI超买和MACD死叉 / Combined with RSI overbought and MACD death cross
- 提供具体价位和置信度 / Provides specific price levels and confidence scores
## 7. 使用建议 / Usage Recommendations
### 7.1 信号优先级 / Signal Priority
1. **最高优先级 / Highest Priority**: AI智能信号(评分≥70) / AI smart signals (score ≥70)
2. **高优先级 / High Priority**: 预测性信号+多时间框架确认 / Predictive signals + multi-timeframe confirmation
3. **中等优先级 / Medium Priority**: 传统SuperTrend信号 / Traditional SuperTrend signals
4. **参考级别 / Reference Level**: 背离信号和支撑阻力提示 / Divergence signals and support/resistance hints
### 7.2 参数设置建议 / Parameter Setting Recommendations
#### 新手用户 / Beginner Users
- 启用AI学习系统 / Enable AI learning system
- 使用平衡型组合 / Use balanced combination
- 关注预测性信号 / Focus on predictive signals
- 重视风险控制 / Emphasize risk control
#### 经验用户 / Experienced Users
- 根据市场环境选择组合 / Choose combinations based on market conditions
- 结合多时间框架分析 / Combine multi-timeframe analysis
- 自定义学习参数 / Customize learning parameters
- 灵活运用各类信号 / Flexibly use various signal types
### 7.3 风险提示 / Risk Warnings
- **AI学习需要时间 / AI Learning Takes Time**: 至少20笔交易后才开始有效学习 / Effective learning starts after at least 20 trades
- **市场环境变化 / Market Environment Changes**: 需要定期重新训练AI系统 / AI system needs periodic retraining
- **信号延迟 / Signal Delay**: 部分信号可能存在1-2根K线的延迟 / Some signals may have 1-2 candlestick delay
- **假信号风险 / False Signal Risk**: 震荡市场中可能产生较多假信号 / May generate more false signals in choppy markets
- **过度优化 / Over-optimization**: 避免频繁调整参数导致过拟合 / Avoid frequent parameter adjustments causing overfitting
## 8. 显示面板说明 / Display Panel Description
### 8.1 AI统计面板 / AI Statistics Panel
显示内容包括 / Display contents include:
- 风险等级和买卖评分 / Risk level and buy/sell scores
- 市场状态和波动率 / Market state and volatility
- RSI当前值 / Current RSI value
- AI趋势预测和置信度 / AI trend prediction and confidence
- 最佳入场点位 / Optimal entry points
- 交易机会评估 / Trading opportunity assessment
- AI准确率统计 / AI accuracy statistics
### 8.2 AI预测信息面板 / AI Prediction Information Panel
显示内容包括 / Display contents include:
- 趋势方向和置信度 / Trend direction and confidence
- 价格目标位 / Price target levels
- 最佳做多/做空点位 / Optimal long/short entry points
- 交易机会类型 / Trading opportunity type
- 入场时机建议 / Entry timing recommendations
- 市场情绪分析 / Market sentiment analysis
- 价格形态识别 / Price pattern recognition
## 9. 总结 / Summary
AI-JX v3.0指标通过集成多种技术分析方法和AI学习能力,为交易者提供了一个全面的市场分析工具。其核心优势在于:
The AI-JX v3.0 indicator provides traders with a comprehensive market analysis tool by integrating various technical analysis methods and AI learning capabilities. Its core advantages include:
- **智能化 / Intelligence**: AI自动学习和优化参数 / AI automatically learns and optimizes parameters
- **多维度 / Multi-dimensional**: 结合趋势、动量、支撑阻力等多个维度 / Combines trend, momentum, support/resistance and other dimensions
- **预测性 / Predictive**: 提供前瞻性的市场预测 / Provides forward-looking market predictions
- **风险控制 / Risk Control**: 内置假突破识别和多重确认机制 / Built-in false breakout identification and multiple confirmation mechanisms
建议交易者在使用时结合自身交易风格和市场环境,合理设置参数,并注意风险管理。
It is recommended that traders combine their own trading style and market environment when using this indicator, set parameters reasonably, and pay attention to risk management.
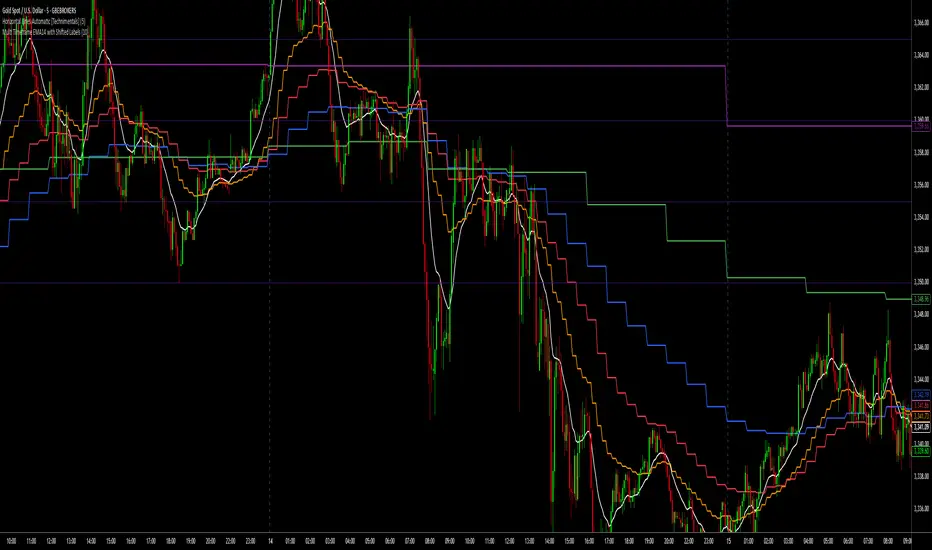
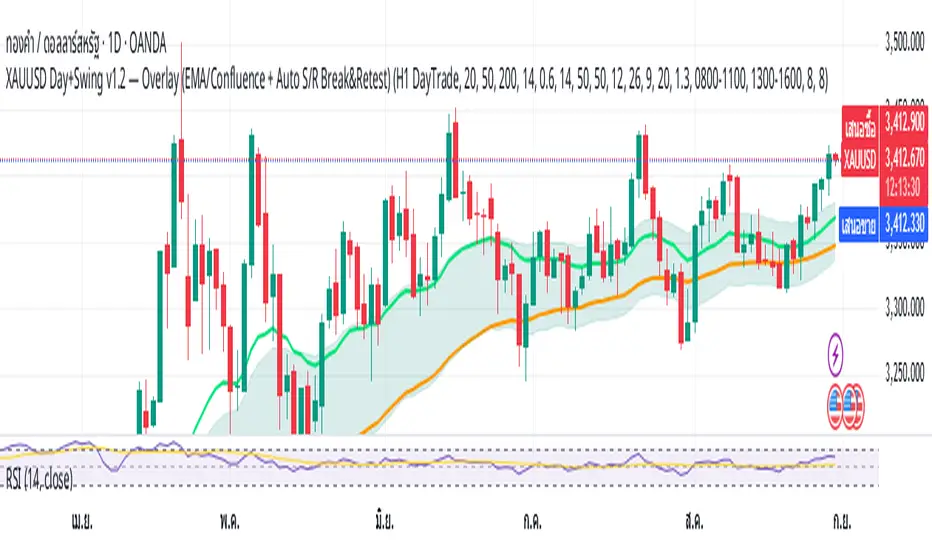
Multi Timeframe EMA14 (CHANUT)เป็นการใช้ อินดิเคเตอร์ ในการดู แนวโน้มตลาดเช่น ทองคำ
It is the use of indicators to look at market trends such as gold.
Pump/Dump Detector [Modular]//@version=5
indicator("Pump/Dump Detector ", overlay=true)
// ————— Inputs —————
risk_pct = input.float(1.0, "Risk %", minval=0.1)
capital = input.float(100000, "Capital")
stop_multiplier = input.float(1.5, "Stop Multiplier")
target_multiplier = input.float(2.0, "Target Multiplier")
volume_mult = input.float(2.0, "Volume Spike Multiplier")
rsi_low_thresh = input.int(15, "RSI Oversold Threshold")
rsi_high_thresh = input.int(85, "RSI Overbought Threshold")
rsi_len = input.int(2, "RSI Length")
bb_len = input.int(20, "BB Length")
bb_mult = input.float(2.0, "BB Multiplier")
atr_len = input.int(14, "ATR Length")
show_signals = input.bool(true, "Show Entry Signals")
use_orderflow = input.bool(true, "Use Order Flow Proxy")
use_ml_flag = input.bool(false, "Use ML Risk Flag")
use_session_filter = input.bool(true, "Use Volatility Sessions")
// ————— Symbol Filter (Optional) —————
symbol_nq = input.bool(true, "Enable NQ")
symbol_es = input.bool(true, "Enable ES")
symbol_gold = input.bool(true, "Enable Gold")
is_nq = str.contains(syminfo.ticker, "NQ")
is_es = str.contains(syminfo.ticker, "ES")
is_gold = str.contains(syminfo.ticker, "GC")
symbol_filter = (symbol_nq and is_nq) or (symbol_es and is_es) or (symbol_gold and is_gold)
// ————— Calculations —————
rsi = ta.rsi(close, rsi_len)
atr = ta.atr(atr_len)
basis = ta.sma(close, bb_len)
dev = bb_mult * ta.stdev(close, bb_len)
bb_upper = basis + dev
bb_lower = basis - dev
rolling_vol = ta.sma(volume, 20)
vol_spike = volume > volume_mult * rolling_vol
// ————— Session Filter (EST) —————
est_offset = -5
est_hour = (hour + est_offset + 24) % 24
session_filter = (est_hour >= 18 or est_hour < 6) or (est_hour >= 14 and est_hour < 17)
session_ok = not use_session_filter or session_filter
// ————— Order Flow Proxy —————
mfi = ta.mfi(close, 14)
buy_imbalance = ta.crossover(mfi, 50)
sell_imbalance = ta.crossunder(mfi, 50)
reversal_candle = close > open and close > ta.highest(close , 3)
// ————— ML Risk Flag (Placeholder) —————
ml_risk_flag = use_ml_flag and (ta.sma(close, 5) > ta.sma(close, 20))
// ————— Entry Conditions —————
long_cond = symbol_filter and session_ok and vol_spike and rsi < rsi_low_thresh and close < bb_lower and (not use_orderflow or (buy_imbalance and reversal_candle)) and (not use_ml_flag or ml_risk_flag)
short_cond = symbol_filter and session_ok and vol_spike and rsi > rsi_high_thresh and (not use_orderflow or sell_imbalance) and (not use_ml_flag or ml_risk_flag)
// ————— Position Sizing —————
risk_amt = capital * (risk_pct / 100)
position_size = risk_amt / atr
// ————— Plot Signals —————
plotshape(show_signals and long_cond, title="Long Signal", location=location.belowbar, color=color.green, style=shape.triangleup, size=size.small)
plotshape(show_signals and short_cond, title="Short Signal", location=location.abovebar, color=color.red, style=shape.triangledown, size=size.small)
// ————— Alerts —————
alertcondition(long_cond, title="Long Entry Alert", message="Pump fade detected: Long setup triggered")
alertcondition(short_cond, title="Short Entry Alert", message="Dump detected: Short setup triggered")

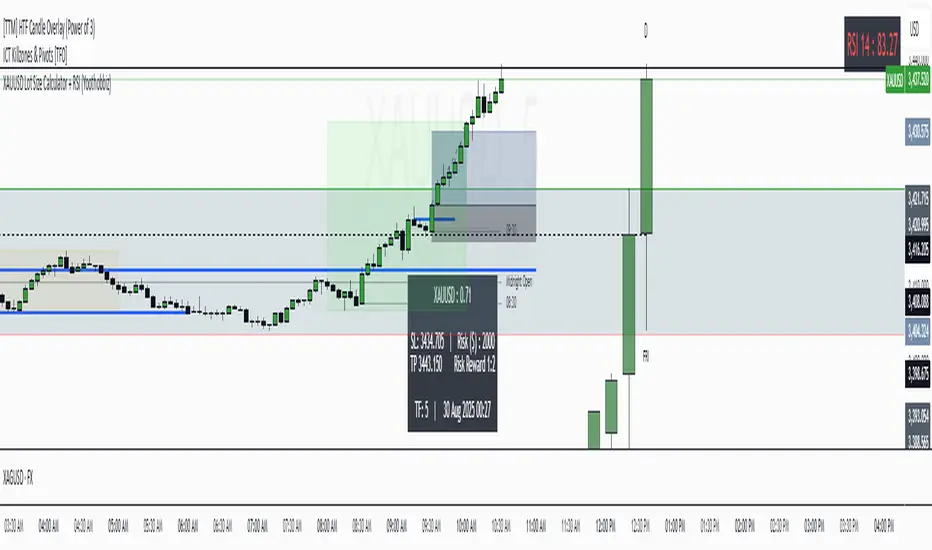
XAUUSD Lot Size Calculator + RSI (Yoothobbiz)This indicator is designed for Gold traders on the 5-minute timeframe (M5) who want a clear and editable lot size, stop loss, and take profit calculator directly on their chart.
✨ Features:
📌 Dynamic Lot Size Calculation – based on account capital, chosen risk %, and stop loss distance.
⚖️ Risk/Reward Management – automatically displays TP level using a customizable risk/reward ratio (e.g., 1:2, 1:3, etc.).
🛑 Stop Loss in Points & Price – calculates SL from recent M5 highs/lows, including spread.
🎯 Take Profit in Price & Points – automatically adjusted to your risk/reward ratio.
💵 Risk in USD – instantly shows how much capital is at risk per trade.
🕒 Custom Time Zone Support – displays the real trading time (default UTC-4 for New York), fully editable for any user.
⏱ Timeframe Label – clearly shows the working timeframe (M5 by default).
🎨 Fully Editable Display Panel:
Position (6 corners available).
Font family, size, style (bold/italic).
Text and background colors.
Adjustable spacing between lines.
🔑 How to Use:
Set your capital and risk % in the settings.
Adjust spread (in points) if needed.
Choose your risk/reward ratio.
The panel will display:
Recommended lot size for XAUUSD
Stop loss (price + points)
Take profit (price + ratio)
Risk in $
Timeframe & real-time clock
📍 Notes:
Optimized for XAUUSD (Gold) and the 5M timeframe.
Works on any asset/timeframe, but SL logic is based on M5 candle highs/lows.
Ideal for traders who want a fast and disciplined risk management tool right on their chart.

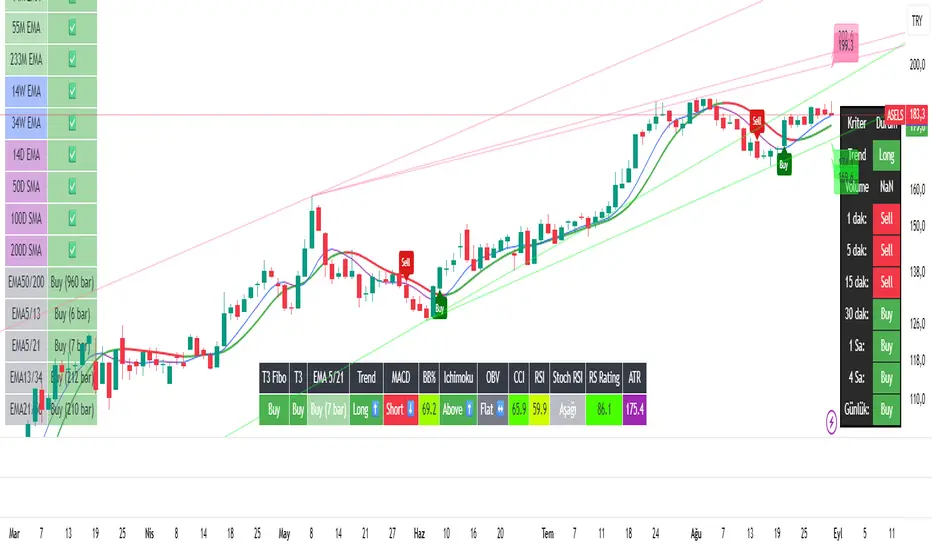
Cilbaga Indikator Tables General Purpose
This indicator provides decision support by multidimensionally analyzing the technical information of an asset (stocks, crypto, forex, etc.) with personalized visual charts and signals. It supports both trend tracking and multi-timeframe analysis. Key Features and Functions Multi EMA/SMA Analysis Displays Exponential Moving Averages (EMA) and Simple Moving Averages (SMA) on monthly, weekly, and daily bases.
Indicates whether the price is above or below these averages with / symbols.
Generates signals from crossovers, such as EMA50/200, EMA5/13, and EMA5/21.
Crossover Signals EMA crossovers (e.g., 50 and 200) are labeled as "BUY" or "SELL" signals.
Shows how long ago the crossover occurred (e.g., "5 days ago").
These signals can be displayed as labels on the chart (optional).
T3 Indicator and T3 Fibo The T3 indicator, an advanced smoothing tool for trend tracking, generates BUY/SELL signals based on direction (up/down).
T3 Fibo is an alternative T3 version calculated with different weights (e.g., 0.618 golden ratio).
Both are drawn with colors (green = bullish, red = bearish).
Multi-Timeframe Analysis Displays trend status based on the 144 EMA across different timeframes (1D, 15m, 1H, 4H, daily, etc.).
Provides users with "Long" (buy) or "Short" (sell) signals for short- and long-term trend perspectives.
Technical Indicator Signal Unit (Signal Table)
Combines the status of the following in a table: Trend: 55 EMA and 200 EMA
MACD: Positive or negative?
Ichimoku: Is the price above or below the cloud?
OBV (On-Balance Volume): Is the volume trend upward?
RSI: Overbought/oversold levels
Stoch RSI: Short-term momentum
Bollinger Bands % (BB%): Price position relative to the bands
CCI: Overbought/oversold and momentum
RS Rating: Relative strength compared to a selected index (e.g., BIST:XU100)
ATR(STOP!): Volatility-based support/resistance levels
Visual Presentation
Three customizable tables provide: EMA/SMA Status and Crossovers
Summary Table of All Signals
Multi-Timeframe Trend (EzAlgo)
Users can adjust the content, colors, transparency, and visibility of the tables.
User Customization Options Enable/disable lines, labels, and tables.
Customize visual settings such as color, position, and size.
Select a custom benchmark for RS Rating (e.g., SP500, BIST100).
Adjust T3 parameters (length, volume factor).
Who Is This Indicator For? Ideal for those who rely on technical analysis and trend tracking.
Suitable for day traders and medium- to long-term investors monitoring multiple timeframes.
Acts as a decision-support system for those who want to view signals from multiple indicators in one place.
In Summary:
The "Cilbaga Indicator Tables" is a user-friendly decision-support indicator with multi-timeframe and multi-indicator analysis, supported by visual charts. It combines trend, momentum, and relative strength analyses in one place to inform buy/sell decisions.
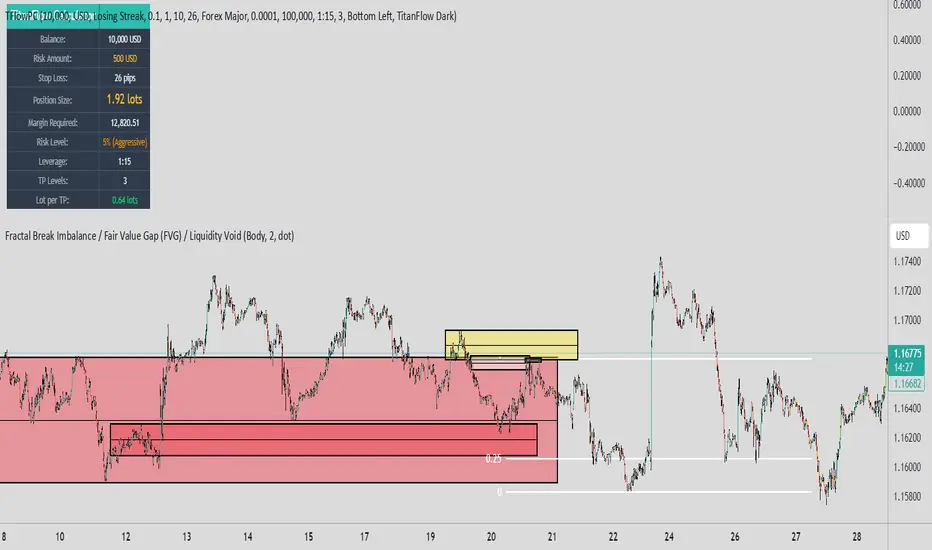
TitanFlow Position CalculatorTitanFlow Position Calculator - Professional Risk Management Tool
Transform your trading with precision position sizing and advanced risk management
The TitanFlow Position Calculator is a comprehensive Pine Script indicator designed for serious traders who demand professional-grade risk management tools. Whether you're trading forex, commodities, indices, or crypto, this calculator ensures you never risk more than intended while maximizing your profit potential.
🎯 Key Features:
SMART POSITION SIZING
Automatic lot size calculation based on your risk parameters
Support for percentage risk, fixed amount, or losing streak buffer modes
Real-time position size updates as market conditions change
Double-up mode for aggressive trading strategies
MULTI-ASSET SUPPORT
Pre-configured settings for Forex Major/Minor pairs
Commodities: Gold, Silver, Oil with accurate pip values
Stock indices with proper contract specifications
Cryptocurrency trading support
Custom instrument configuration for any asset
ADVANCED RISK MANAGEMENT
Visual risk level categorization (Conservative, Moderate, Aggressive, Extreme)
Color-coded risk warnings with threshold alerts
Margin requirement calculations with leverage integration
Take profit level planning with lot distribution
PROFESSIONAL THEMES
TitanFlow Dark theme matching the professional trading platform
TitanFlow Light theme for bright chart environments
Classic dark/light themes for traditional traders
Full custom colour control for personalized setups
COMPREHENSIVE LEVERAGE SUPPORT
Complete leverage options from 1:1 to 1:500 including:
1:1, 1:10, 1:15, 1:20, 1:30, 1:50, 1:100, 1:200, 1:300, 1:400, 1:500
📊 What You'll See:
REAL-TIME CALCULATIONS
Position size in lots displayed prominently
Risk level percentage with color coding
Margin requirements in your account currency
Stop loss distance in pips
Take profit distribution across multiple levels
CLEAN INFORMATION TABLE
Account balance and currency display
Current risk amount being wagered
Calculated position size and margin needs
Risk categorization with visual indicators
Leverage ratio confirmation
SMART ALERTS
Extreme risk warnings (>5% per trade)
Large position alerts (>10 lots)
High margin usage notifications (>50% account)
Real-time risk assessment updates
🚀 Take Your Trading Further with TitanFlow
Want more than just position sizing?
Visit titanflow.co.uk to discover the complete TitanFlow trading ecosystem:
✅ Advanced Trading Dashboard - Comprehensive portfolio tracking and analytics
✅ Trade Journal Integration - Log and analyze every trade automatically
✅ AI-Powered Coaching - Get personalized trading insights and recommendations
✅ Monthly Performance Reports - Detailed analytics delivered to your inbox
✅ Risk Management Suite - Professional tools for serious traders
✅ Trading Calendar - Never miss important market events
✅ Community Access - Connect with successful traders worldwide
Special Offer: TradingView users get exclusive access to premium features. Transform your trading from guesswork to systematic success. coming soon
🎨 Customization Options:
Theme Selection
Choose from 5 professional themes
Customize every colour element
Match your chart aesthetic perfectly
Professional branding options
Display Controls
Position table in any corner
Show/hide alerts and warnings
Adjustable text sizes
Clean, distraction-free interface
💡 Perfect For:
Day Traders who need quick position sizing decisions
Swing Traders planning multi-level exits
Scalpers requiring precise risk control
Portfolio Managers overseeing multiple accounts
Risk Managers monitoring exposure levels
Trading Educators teaching proper risk management
🚀 How to Use:
Set Your Account - Enter balance and currency
Choose Risk Mode - Percentage (recommended 1-2%), fixed amount, or losing streak buffer
Configure Instrument - Select asset type or use custom settings
Set Stop Loss - Enter your stop distance in pips
Read Results - Get instant position size and risk analysis
⚠️ Risk Management Excellence:
This calculator embodies the core principle that successful trading is about risk management, not just profit hunting. By using proper position sizing, you'll:
Survive losing streaks with capital intact
Compound profits systematically
Sleep better knowing your risk is controlled
Build consistent trading habits
Protect your trading capital long-term
Ready to elevate your entire trading operation? Start with this position calculator, then visit titanflow.co.uk to unlock the full potential of systematic, professional trading.
This indicator is part of the TitanFlow trading ecosystem. titanflow.co.uk coming soon here you'll be able to obtain the complete professional trading platform.
Price Grid# Price Grid Indicator
A versatile price grid indicator designed for multi-instrument trading, providing dynamic grid lines with customizable settings for different trading instruments.
## Key Features
1. 1.
Multi-Instrument Support
- Customizable grid settings for different symbols
- Supports major forex pairs, commodities, and cryptocurrencies
- Automatic symbol detection and parameter application
2. 2.
Dynamic Grid Configuration
- Adjustable grid intervals
- Customizable price range around current price
- Automatic grid line updates based on price movement
3. 3.
Visual Customization
- Three line styles: Solid, Dashed, and Dotted
- Multiple color levels (L1, L2, L3) for different price points
- Adjustable transparency for each color level
- Default grid color for standard price levels
4. 4.
Smart Price Level Detection
- Grid crossover alerts
- Automatic grid line adjustment as price moves
- Efficient line management to maintain performance
5. 5.
Default Settings Include:
- XAUUSD/Gold Futures
- Major Forex Pairs (EUR, GBP, JPY, etc.)
- Crypto Pairs (BTC, ETH)
- E-mini Futures
## Usage Tips
1. 1.
Grid Parameter Format:
- Symbol|Alias:GridInterval,PriceRange
- Multiple instruments separated by semicolons
- Example: "XAUUSD|MGC1!:5,25;EURUSD:0.002,0.02"
2. 2.
Color Matching Format:
- Symbol:PriceLevel=ColorLevel
- Supports multiple levels per instrument
- Example: "XAUUSD:100=L3,50=L2,10=L1"
3. 3.
Best Practices:
- Adjust grid intervals based on instrument volatility
- Use color levels to highlight significant price levels
- Set appropriate price ranges for your trading timeframe
## Notes
1. 1.
Grid lines automatically adjust as price moves
2. 2.
Alerts trigger when price crosses grid lines
3. 3.
Performance optimized for real-time trading
4. 4.
Compatible with all TradingView timeframes
This indicator is particularly useful for scalping, grid trading strategies, and identifying potential support/resistance levels across multiple instruments.
ValuationtoolValuation tools, updated version for every asset (vs futures price / vs gold / vs bounds)

Autoback Grid Lab [trade_lexx]Autoback Grid Lab: Your personal laboratory for optimizing grid strategies.
Introduction
First of all, it is important to understand that Autoback Grid Lab is a powerful professional tool for backtesting and optimization, created specifically for traders using both grid strategies and regular take profit with stop loss.
The main purpose of this script is to save you weeks and months of manual testing and parameter selection. Instead of manually testing one combination of settings after another, Autoback Grid Lab automatically tests thousands of unique strategies on historical data, providing you with a comprehensive report on the most profitable and, more importantly, sustainable ones.
If you want to find mathematically sound, most effective settings for your grid strategy on a specific asset and timeframe, then this tool was created for you.
Key Features
My tool has functionality that transforms the process of finding the perfect strategy from a routine into an exciting exploration.
🧪 Mass testing of thousands of combinations
The script is able to systematically generate and run a huge number of unique combinations of parameters through the built-in simulator. You set the ranges, and the indicator does all the work, testing all possible options for the following grid settings:
* Number of safety orders (SO Count)
* Grid step (SO Step)
* Step Multiplier (SO Multiplier) for building nonlinear grids
* Martingale for controlling the volume of subsequent orders
* Take Profit (%)
* Stop Loss (%), with the possibility of calculating both from the entry point and from the dynamic breakeven line
* The volume of the base order (Volume BO) as a percentage of the deposit
🏆 Unique `FinalScore` rating system
Sorting strategies by net profit alone is a direct path to self—deception and choosing strategies that are "tailored" to history and will inevitably fail in real trading. To solve this problem, we have developed FinalScore, a comprehensive assessment of the sustainability and quality of the strategy.
How does it work?
FinalScore analyzes each combination not one by one, but by nine key performance metrics at once, including Net Profit, Drawdown, Profit Factor, WinRate, Sharpe coefficients, Sortino, Squid and Omega. Each of these indicators is normalized, that is, reduced to a single scale. Then, to test the strategy for strength, the system performs 30 iterations, each time assigning random weights to these 9 metrics. A strategy gets a high FinalScore only if it shows consistently high results under different evaluation criteria. This proves her reliability and reduces the likelihood that her success was an accident.
📈 Realistic backtesting engine
The test results are meaningless if they do not take into account the actual trading conditions. Our simulator simulates real trading as accurately as possible, taking into account:
* Leverage: Calculation of the required margin to open and hold positions.
* Commission: A percentage commission is charged each time an order is opened and closed.
* Slippage: The order execution price is adjusted by a set percentage to simulate real market conditions.
* Liquidation model: This is one of the most important functions. The script continuously monitors the equity of the account (capital + unrealized P&L). If equity falls below the level of the supporting margin (calculated from the current value of the position), the simulator forcibly closes the position, as it would happen on a real exchange. This eliminates unrealistic scenarios where the strategy survives after a huge drawdown.
🔌 Integration with external signals
The indicator operates in two modes:
1. `No Signal': Standard mode. The trading cycle starts immediately as soon as the previous one has been closed. Ideal for testing the "pure" mechanics of the grid.
2. `External Signal`: In this mode, a new trading cycle will start only when a signal is received from an external source. You can connect any other indicator (such as the RSI, MACD, or your own strategy) to the script and use it as a trigger to log in. This allows you to combine the power of a grid strategy with your own entry points.
📊 Interactive and informative results panel
Upon completion of the calculations, a detailed table with the TOP N best strategies appears on the screen, sorted according to your chosen criterion. For each strategy in the rating, you will see not only the key metrics (Profit, Drawdown, duration of transactions), but also all the parameters that led to this result. You can immediately take these settings and apply them in your trading.
Application Options: How To Solve Your Problems
Autoback Grid Lab is a flexible tool that can be adapted to solve various tasks, from complete grid optimization to fine—tuning existing strategies. Here are some key scenarios for its use:
1. Complete Optimization Of The Grid Strategy
This is the basic and most powerful mode of use. You can find the most efficient grid configuration for any asset from scratch.
* How to use: Set wide ranges for all key grid parameters ('SO Count`, SO Step, SO Multiplier, Martingale, TP, etc.).
* In the `No Signal` mode: You will find the most stable grid configuration that works as an independent, constantly active strategy, regardless of which-or entrance indicators.
* In the `External Signal` mode: You can connect your favorite indicator for input (for example, RSI, MACD or a complex author's script) and find the optimal grid parameters that best complement your input signals. This allows you to turn a simple signaling strategy into a full-fledged grid system.
2. Selecting the Optimal Take Profit and Stop Loss for Your Strategy
Do you already have an entry strategy, but you are not sure where it is best to put Take Profit and Stop Loss? Autoback Grid Lab can solve this problem as well.
* How to use:
1. Disable optimization of all grid parameters (uncheck SO Count, SO Step, Martingale, etc.). Set the Min value for SO Count to 0.
2. Set the ranges for iteration only for 'Take Profit` and `Stop Loss'.
3. Turn on the External Signal mode and connect your indicator with input signals.
* Result: The script will run your historical entry signals with hundreds of different TP and SL combinations and show you which stop order levels bring maximum profit with minimal risk specifically for your entry points.
3. Building a Secure Network with Risk Management
Many traders are afraid of grid strategies because of the risk of large drawdowns. With the help of the optimizer, you can purposefully find the parameters for such a grid, which includes mandatory risk management through Stop Loss.
* How to use: Enable and set the range for Stop Loss, along with other grid parameters. Don't forget to test both types of SL calculations (`From entry point` and `From breakeven line`) to determine which one works more efficiently.
* Result: You will find balanced strategies in which the grid parameters (number of orders, martingale) and the Stop Loss level are selected in such a way as to maximize profits without going beyond the acceptable risk level for you.
How To Use The Indicator (Step-By-Step Guide)
Working with the Autoback Grid Lab is a sequential process consisting of four main steps: from initial setup to analysis of the finished results. Follow this guide to get the most out of the tool.
Step 1: Initial Setup
1. Add the indicator to the chart of your chosen asset and timeframe.
2. Open the script settings. The first thing you should pay attention to is the ⚙️ Optimization Settings ⚙️ group.
3. Set the `Bars Count'. This parameter determines how much historical data will be used for testing.
* Important: The more bars you specify, the more statistically reliable the backtest results will be. We recommend using the maximum available value (25,000) to test strategies at different market phases.
* Consider: The indicator performs all calculations on the last historical bar. After applying the TradingView settings, it will take some time to load all the specified bars. The results table will appear only after the data is fully loaded. Don't worry if it doesn't appear instantly. And if an error occurs, simply switch the number of combinations to 990 and back to 1000 until the table appears.
Step 2: Optimization Configuration
At this stage, you define the "universe" of parameters that our algorithm will explore.
1. Set the search ranges (🛠 Optimization Parameters 🛠 group).
For each grid parameter that you want to optimize (for example, SO Count or `Take Profit'), you must specify three values:
* Min: The minimum value of the range.
* Max: The maximum value of the range.
* Step: The step with which the values from Min to Max will be traversed.
*Example:* If you set Min=5, Max=10, and Step=1 for SO Count, the script will test strategies with 5, 6, 7, 8, 9, and 10 safety orders.
* Tip for users: To get the first results quickly, start with a larger step (for example, TP from 0.5% to 2.5% in 0.5 increments instead of 0.1). After you identify the most promising areas, you can perform a deeper analysis by expanding the ranges around these values.
2. Set Up Money Management (Group `💰 Money Management Settings 💰`).
Fill in these fields with the values that best match your actual trading conditions. This is critically important for obtaining reliable results.
* Capital: Your initial deposit.
* Leverage: Leverage.
* Commission (%): Your trading commission as a percentage.
* Slippage (%): Expected slippage.
* Liquidation Level (%): The level of the supporting margin (MMR in %). For example, for Binance Futures, this value is usually between 0.4% and 2.5%, depending on the asset and position size. Specify this value for your exchange.
3. Select the Sorting Criterion and the Direction (Group `⚙️ Optimization Settings ⚙️').
* `Sort by': Specify the main criteria by which the best strategies will be selected and sorted. I strongly recommend using finalScore to find the most balanced and sustainable strategies.
* `Direction': Choose which trades to test: Long, Short or Both.
Step 3: Start Testing and Work with "Parts"
The total number of unique combinations generated based on your ranges can reach tens of millions. TradingView has technical limitations on the number of calculations that the script can perform at a time. To get around this, I implemented a "Parts" system.
1. What are `Part` and `Combinations in Part'?
* `Combinations in Part': This is the number of backtests that the script performs in one run (1000 by default).
* `Part`: This is the number of the "portion" of combinations that you want to test.
2. How does it work in practice?
* After you have everything set up, leave Part:1 and wait for the results table to appear. You will see the TOP N best strategies from the first thousand tested.
* Analyze them. Then, to check the next thousand combinations, just change the Part to 2 in the settings and click OK. The script will run a test for the next batch.
* Repeat this process by increasing the Part number (`3`, 4, 5...), until you reach the last available part.
* Where can I see the total number of parts? In the information row below the results table, you will find Total parts. This will help you figure out how many more tests are left to run.
Step 4: Analyze the Results in the Table
The results table is your main decision—making tool. It displays the best strategies found, sorted by the criteria you have chosen.
1. Study the performance metrics:
* Rating: Position in the rating.
* Profit %: Net profit as a percentage of the initial capital.
* Drawdown%: The maximum drawdown of the deposit for the entire test period.
* Max Length: The maximum duration of one transaction in days, hours and minutes.
* Trades: The total number of completed trades.
2. Examine the winning parameters:
* To the right of the performance metrics are columns showing the exact settings that led to this result ('SO Count`, SO Step, TP (%), etc.).
3. How to choose the best strategy?
* Don't chase after the maximum profit! The strategy with the highest profit often has the highest drawdown, which makes it extremely risky.
* Seek a balance. The ideal strategy is a compromise between high profitability, low drawdown (Drawdown) and the maximum length of trades acceptable to you (Max Length).
* finalScore was created to find this balance. Trust him — he often highlights not the most profitable, but the most stable and reliable options.
Detailed Description Of The Settings
This section serves as a complete reference for each parameter available in the script settings. The parameters are grouped in the same way as in the indicator interface for your convenience.
Group: ⚙️ Optimization Settings ⚙️
The main parameters governing the testing process are collected here.
* `Enable Optimizer': The main switch. Activates or deactivates all backtesting functionality.
* `Direction': Determines which way trades will be opened during the simulation.
* Long: Shopping only.
* Short: Sales only.
* Both: Testing in both directions. Important: This mode only works in conjunction with an External Signal, as the script needs an external signal to determine the direction for each specific transaction.
* `Signal Mode`: Controls the conditions for starting a new trading cycle (opening a base order).
* No Signal: A new cycle starts immediately after the previous one is completed. This mode is used to test "pure" grid mechanics without reference to market conditions.
* External Signal: A new cycle begins only when a signal is received from an external indicator connected via the Signal field.
* `Signal': A field for connecting an external signal source (works only in the `External Signal` mode). You can select any other indicator on the chart.
* For Long** trades, the signal is considered received if the value of the external indicator ** is greater than 0.
* For Short** trades, the signal is considered received if the value of the external indicator ** is less than 0.
* `Bars Count': Sets the depth of the history in the bars for the backtest. The maximum value (25000) provides the most reliable results.
* `Sort by`: A key criterion for selecting and ranking the best strategies in the final table.
* FinalScore: Recommended mode. A comprehensive assessment that takes into account 9 metrics to find the most balanced and sustainable strategies.
* Profit: Sort by net profit.
* Drawdown: Sort by minimum drawdown.
* Max Length: Sort by the minimum length of the longest transaction.
* `Combinations Count': Indicates how many of the best strategies (from 1 to 50) will be displayed in the results table.
* `Close last trade`: If this option is enabled, any active trade will be forcibly closed at the closing price of the last historical bar. For grid strategies, it is recommended to always enable this option in order to get the correct calculation of the final profit and eliminate grid strategies that have been stuck for a long time.
Group: 💰 Money Management Settings 💰
The parameters in this group determine the financial conditions of the simulation. Specify values that are as close as possible to your actual values in order to get reliable results.
* `Capital': The initial deposit amount for the simulation.
* `Leverage`: The leverage used to calculate the margin.
* `Slippage` (%): Simulates the difference between the expected and actual order execution price. The specified percentage will be applied to each transaction.
* `Commission` (%): The trading commission of your exchange as a percentage. It is charged at the execution of each order (both at opening and closing).
* `Liquidation Level' (%): Maintenance Margin Ratio. This is a critical parameter for a realistic test. Liquidation in the simulator occurs if the Equity of the account (Capital + Unrealized P&L) falls below the level of the supporting margin.
Group: 🛠 Optimization Parameters 🛠
This is the "heart" of the optimizer, where you set ranges for iterating through the grid parameters.
* `Part`: The portion number of the combinations to be tested. Start with 1, and then increment (`2`, 3, ...) sequentially to check all generated strategies.
* `Combinations in Part': The number of backtests performed at a time (in one "Part"). Increasing the value may speed up the process, but it may cause the script to error due to platform limitations. If an error occurs, it is recommended to switch to the step below and back.
Three fields are available for each of the following parameters (`SO Count`, SO Step, SO Multiplier, etc.):
* `Min`: Minimum value for testing.
* `Max': The maximum value for testing.
* `Step`: The step with which the values in the range from Min to Max will be iterated over.
There is also a checkbox for each parameter. If it is enabled, the parameter will be optimized in the specified range. If disabled, only one value specified in the Min field will be used for all tests.
* 'Stop Loss': In addition to the standard settings Min, Max, Step, it has an additional parameter:
* `Type`: Defines how the stop loss price is calculated.
* From entry point: The SL level is calculated once from the entry price (base order price).
* From breakeven line: The SL level is dynamically recalculated from the average position price after each new safety order is executed.
Group: ⚡️Filters⚡️
Filters allow you to filter out those results from the final table that do not meet your minimum requirements.
For each filter (`Max Profit`, Min Drawdown, `Min Trade Length`), you can:
1. Turn it on or off using the checkbox.
2. Select the comparison condition: Greater (More) or Less (Less).
3. Set a threshold value.
*Example:* If you set Less and 20 for the Min Drawdown filter, only those strategies with a maximum drawdown of less than 20% will be included in the final table.
Group: 🎨 Visual Settings 🎨
Here you can customize the appearance of the results table.
* `Position': Selects the position of the table on the screen (for example, Bottom Left — bottom left).
* `Font Size': The size of the text in the table.
* `Header Background / Data Background`: Background colors for the header and data cells.
* `Header Font Color / Data Font Color`: Text colors for the header and data cells.
Important Notes and Limitations
So that you can use the Autoback Grid Lab as efficiently and consciously as possible, please familiarize yourself with the following key features of its work.
1. It is a Tool for Analysis, not for Signals
It is extremely important to understand that this script does not generate trading signals in real time. Its sole purpose is to conduct in—depth research (**backtesting**) on historical data.
* The results you see in the table are a report on how a particular strategy would have worked in the past.
* The script does not provide alerts and does not draw entry/exit points on the chart for the current market situation.
* Your task is to take the best sets of parameters found during optimization and use them in your real trading, for example, when setting up a trading bot or in a manual trading system.
2. Features Of Calculations (This is not a "Repainting")
You will notice that the results table appears and is updated only once — when all historical bars on the chart are loaded. It does not change in real time with each tick of the price.
This is correct and intentional behavior.:
* To test thousands, and sometimes millions of combinations, the script needs to perform a huge amount of calculations. In the Pine Script™ environment, it is technically possible to do this only once, at the very last bar in history.
* The script does not show false historical signals, which then disappear or change. It provides a static report on the results of the simulation, which remains unchanged for a specific historical period.
3. Past Results do not Guarantee Future Results.
This is the golden rule of trading, and it fully applies to the results of backtesting. Successful strategy performance in the past is not a guarantee that it will be as profitable in the future. Market conditions, volatility and trends are constantly changing.
My tool, especially when sorting by finalScore, is aimed at finding statistically stable and reliable strategies to increase the likelihood of their success in the future. However, it is a tool for managing probabilities, not a crystal ball for predicting the future. Always use proper risk management.
4. Dependence on the Quality and Depth of the Story
The reliability of the results directly depends on the quantity and quality of the historical data on which the test was conducted.
* Always strive to use the maximum number of bars available (`Bars Count: 25,000`) so that your strategy is tested on different market cycles (rise, fall, flat).
* The results obtained on data for one month may differ dramatically from the results obtained on data for two years. The longer the testing period, the higher the confidence in the parameters found.
Conclusion
The Autoback Grid Lab is your personal research laboratory, designed to replace intuitive guesses and endless manual selection of settings with a systematic, data—driven approach. Experiment with different assets, timeframes, and settings ranges to find the unique combinations that best suit your trading style.
