GOLDEN RSI by @thejamiulGOLDEN RSI thejamiul is a versatile Relative Strength Index (RSI)-based tool designed to provide enhanced visualization and additional insights into market trends and potential reversal points. This indicator improves upon the traditional RSI by integrating gradient fills for overbought/oversold zones and divergence detection features, making it an excellent choice for traders who seek precise and actionable signals.
Source of this indicator : This indicator is based on @TradingView original RSI indicator with a little bit of customisation to enhance overbought and oversold identification.
Key Features
1. Customizable RSI Settings:
RSI Length: Adjust the RSI calculation period to suit your trading style (default: 14).
Source Selection: Choose the price source (e.g., close, open, high, low) for RSI calculation.
2. Gradient-Filled RSI Zones:
Overbought Zone (80-100): Gradient fill with shades of green to indicate strong bullish conditions.
Oversold Zone (0-20): Gradient fill with shades of red to highlight strong bearish conditions.
3. Support and Resistance Levels:
Upper Band: 80
Middle Bands: 60 (bullish) and 40 (bearish)
Lower Band: 20
These levels help identify overbought, oversold, and neutral zones.
4. Divergence Detection:
Bullish Divergence: Detects lower lows in price with corresponding higher lows in RSI, signaling potential upward reversals.
Bearish Divergence: Detects higher highs in price with corresponding lower highs in RSI, indicating potential downward reversals.
Visual Indicators:
Bullish divergence is marked with green labels and line plots.
Bearish divergence is marked with red labels and line plots.
5. Alert Functionality:
Custom Alerts: Set up alerts for bullish or bearish divergences to stay notified of potential trading opportunities without constant chart monitoring.
6. Enhanced Chart Visualization:
RSI Plot: A smooth and visually appealing RSI curve.
Color Coding: Gradient and fills for better distinction of trading zones.
Pivot Labels: Clear identification of divergence points on the RSI plot.
Cerca negli script per "GOLD"

Golden GateGolden Gate Indicator is a chart pattern analysis
every time 4 EMA line close to each other line
then show something big in Stock
rise otherwise down a sharp rally come soon
Sovereign Gold Hodlers Script for comparing nations and their gold, with options including:
Default Comparing the Price of Gold
Use Relative Valuations price / prior price
Measure Reserves/Price
GDP/Gold Price
GDP/Gold Reserves
Given the state of the world I thought it'd be good do see where countries stand, how much real money they hold. I think gold is going to play an increased role in trade between economies in the near future.

Gold Silver SpreadGold silver Spread
Different Between Gold & Silver Price
Find Spread Opportunity
Gold Vs Silver Strength Strategy

Full Swing Gold Vwap Macd SMO StrategyThis is a full strategy designed for gold market using 12h timeframe chart.
Its components are:
VWAP monthly
SMO oscillator
MACD histogram
Rules for entry:
For long: when enter when close of the candle is above vwap monthly, current histogram is higher than the previous one and SMO oscillator is above 0
For long: when enter when close of the candle is below vwap monthly, current histogram is lower than the previous one and SMO oscillator is below 0
Rules for exit:
We exit the trade if we get a reverse condition.
We also exit the trade based on a risk management system, both for SL and TP using % movements.
If you have any questions let me know !

{Gunzo} Stock to Flow (Gold, Silver, Dollar, Bitcoin)This indicator displays the Stock to Flow (S2F) ratio for popular commodities (Gold, Silver, Dollar, Euro, Bitcoin, Ethereum) in order to
compare them and determine which ones could be a good Store of Value (SoV).
OVERVIEW :
Stock to Flow is a popular indicator used to predict commodities scarcity. It evaluates the total stock of a commodity against the total amount that can be produced during a year. This model supposes that if scarcity is increasing, the price is going to increase.
This model has been used over the last years on Bitcoin to determine if the asset was undervalued or overvalued, and even make prediction models on the future price.
This script is going to focus on the Stock to Flow ratio (total stock/amount produced) to compare the following assets over time :
Mining resources (mined) for Gold and Silver
Cryptos assets (mined) for Bitcoin and Ethereum
FIAT currencies (banknotes printed) for Dollar and Euro
CALCULATION :
The calculation of the Stock to Flow ratio evaluates the total stock of a commodity produced against the production made for a specific year. The data is calculated on a yearly basis, then interpolated to get monthly or daily values.
DATA ORIGIN :
The main information needed to calculate the Stock to Flow ratio is the "yearly production" of a commodity. I tried to retrieve that information from the most reliable sources :
for Gold from research on www.gold.org
for Silver from research on www.silverinstitute.org
for Ethereum from research on etherscan.io
for Bitcoin from data source "QUANDL:BCHAIN/TOTBC" from www.quandl.com
for Dollar from research on www.federalreserve.gov
for Euro from research on www.ecb.europa.eu
SETTINGS :
Smoothing for interpolated data : Smoothing factor for assets that are calculated yearly and then interpolated (Gold, Silver, Dollar, Euro, and Ethereum)
Smoothing for non interpolated data : Smoothing factor for assets that are calculated daily and not interpolated (Bitcoin)
Display asset names : Display assets names in a colored rectangle on the right side of the chart
Display asset values : Display assets Stock to Flow ratio in a colored rectangle on the right side of the chart
Display key events for assets : Display important events for the assets at the bottom of the chart using the same color as the assets lines (for example Orange diamond is a Bitcoin halving). Please refer to the script code for the details of all events.
USAGE :
This script can be used on any asset available on TradingView as the data used is either static or external.
However I recommend using it the Gold asset from currency.com as the depth of the chart will be bigger (since 1980s).
It is recommended to used this script on the monthly timeframe as the chart data is calculated yearly and then interpolated.

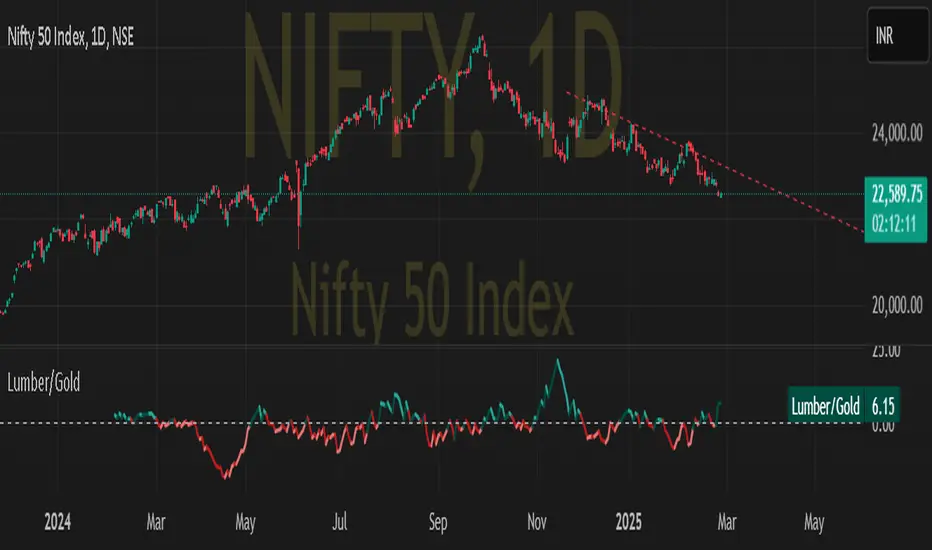
Lumber to Gold ratioDISCRIPTION:-
Lumber to gold ratio helps to predict up upcomming market correction as investors are flocking towards safe heaven.
USE CASE SCENARIO:-
If the ratio is above the zero horizontal line it is a risk of scenario
If the ratio plunge below zero it might show imminent market correction.
Swing or scalping GOLD [RickAtwood] Swing or scalping - automatically determine the currently active trends. Various moving averages are used. It is also designed for any type of trader from scalping to swing.
The key 3 moving averages are designed to identify support and resistance. If the price bounces off them, boldly open and place a stop of 10-20 pips(currency pairs)
Functional
buy ---> green candles
sell ----> red candles
There are alerts for buy and sell based on crossovers
If the price is above the cloud then buy. If the price is below the cloud then sell. The main thing is to open deals only at the very beginning when the price starts to leave the cloud. Also, your stops will be minimal.
When testing this system, we opened 750 trades manually. Success rate of 71% for currency pairs and for gold
P.s If you have any questions about how to open, how to close deals. Always write to me, I will help you) Success to all.

Golden & Death Cross SMA 50 Cross SMA 200 Alert by pakmanGolden & Death Cross SMA 50 Cross SMA 200 Alert by pakman

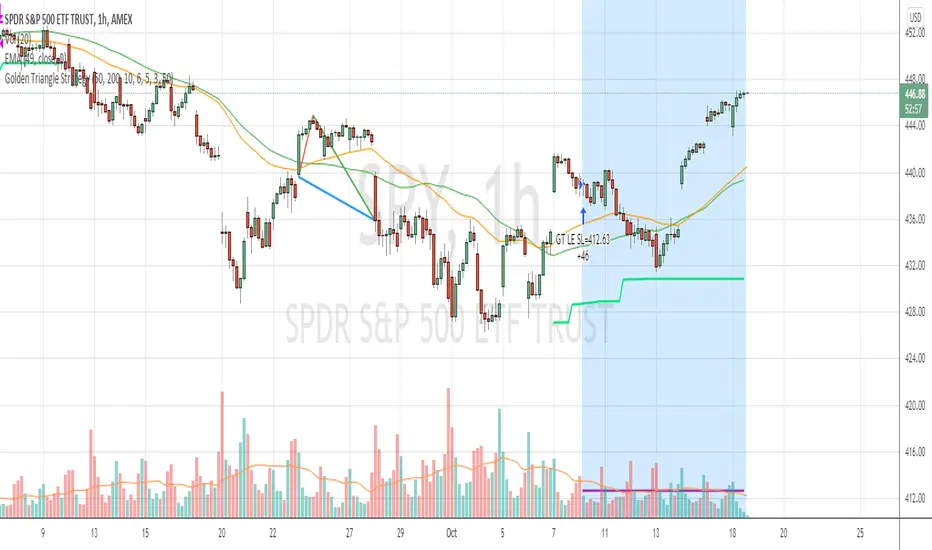
Golden Triangle StrategyGolden Triangle strategy setup is a variation of the buy-the-dip strategy, by Charlotte Hudgin.
You can find the detailed explanation here by Thomas N. Bulkowski thepatternsite.com
BUY
===
1. price should be trading above sma50
2. when it touches sma50 first time , check the starting rallypoint of where it initiated
3. from the above point to current close , see if you have white space , then draw the triangle
4. then check for volume confirmation ( current volume should be greater than last 4 ) --- I have slightly changed this to fit into hourly strategy by adding condition close>vwap
EXIT
====
1. Exit when close crossing down sma50 with at least 2% profit (slightly modified original condition)
StopLoss
========
2. stop loss is set to 6%
Warning
=======
For the use of educational purposes only
Portfolio and Risk Management: Gold Based Net Growth CoefficientHello, if our topic is stocks, whatever signal we get, we have to divide and reduce the risk.
Apart from the risk, we need inflation-free figures to detect a clear growth.
Gold is one of the most successful tools to beat inflation in this regard in the historical context.
When the economy is good, we have to beat both commodities and inflation.
For this purpose, I found it appropriate to develop a net growth factor free from gold growth.
Investors need several stocks with a high growth rate and as much risk-free as possible.
Personally, I think that the science of portfolio and risk management will last a lifetime and should continue.
I think this subject is a research and development subject.(R & D)
My research and publications on this matter will continue publicly.
I wish everyone a good day.
NOTE : You can determine the return in the time period you want to look back by adjusting the period in the rate you want from the menu.
The standard value is 200 days. (1 year)

ANN MACD GOLD (XAUUSD)This script aims to establish artificial neural networks with gold data.(4H)
Details :
Learning cycles: 329818
Training error: 0.012767 ( Slightly above average but negligible.)
Input columns: 19
Output columns: 1
Excluded columns: 0
Training example rows: 300
Validating example rows: 0
Querying example rows: 0
Excluded example rows: 0
Duplicated example rows: 0
Input nodes connected: 19
Hidden layer 1 nodes: 5
Hidden layer 2 nodes: 1
Hidden layer 3 nodes: 0
Output nodes: 1
Learning rate: 0.7000
Momentum: 0.8000
Target error: 0.0100
NOTE : Alarms added.
And special thanks to dear wroclai for his great effort.
Deep learning series will continue . Stay tuned! Regards.


Gap finder (gold minds)This tool highlights where gaps happens and outlines in the chart where the gap zones are. If there is a gap up there is a green line, a gap down it is red. The gap zone is highlighted in blue. You can choose the size of your gap with the input menu to the desired size. Feel free to ask comment below. Made for the Gold Minds group


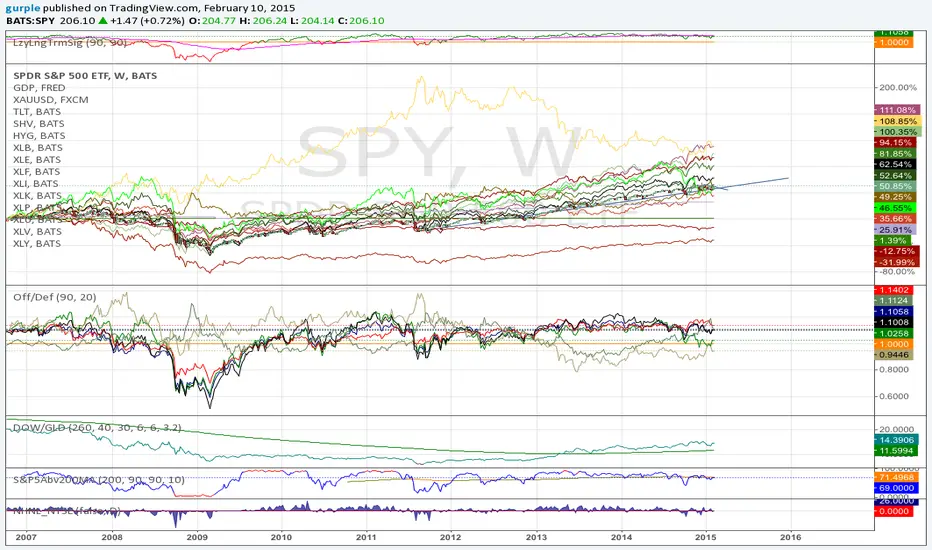
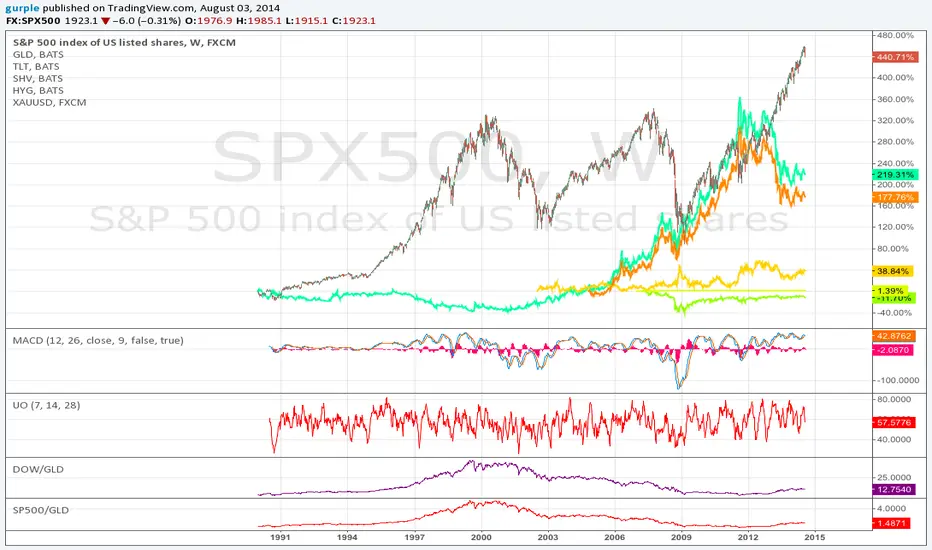
DOW / GOLD RatioHere's a new version with color goodness and using CL1! as the gold spot source (longer history).
GoldenCrossLibrary "GoldenCross"
get_signals(short_len, long_len)
Parameters:
short_len (int)
long_len (int)
Gold and Bitcoin: The Evolution of Value!The Eternal Luster of Gold
In the dawn of time, when the earth was young and rivers whispered secrets to the stones, a wanderer named Elara found a gleam in the silt of a sun-kissed stream. It was pure gold, radiant like a captured star fallen from the heavens. She held it in her palm, feeling its warmth pulse like a heartbeat, and in that moment, humanity’s soul awakened to the allure of eternity.
As seasons turned to centuries, gold wove itself into the story of empires. In ancient Egypt, pharaohs crowned themselves with its glow, believing it to be the flesh of gods. It built pyramids that reached for the sky and tombs that guarded kings forever. Across the sands in Mesopotamia, merchants traded it for spices and silks, its weight a promise of power and trust.
Translation moment: Gold became the first universal symbol of value. People trusted it more than words or promises because it did not rust, fade, or vanish.
The Greeks saw in gold not only wealth but wisdom, the symbol of the sun’s eternal fire. Alexander the Great carried it across the continent, forging an empire of golden threads. Rome rose on its back, minting coins whose clink echoed through history.
Through the ages, gold endured the rush of California’s dreamers, the halls of Versailles, and the quiet vaults of modern fortunes. It has been both a curse and a blessing, the fuel of wars and the gift of love, whispering of beauty’s fragility and the human desire for something that lasts beyond the grave. In its shine, we see ourselves fragile yet forever chasing light.
The Digital Dawn of Bitcoin
Centuries later, under the glow of computer screens, a visionary named Satoshi dreamed of a new gold born not from the earth but from the ether of ideas. Bitcoin appeared in 2009 amid a world weary of banks and broken trust.
Like gold’s ancient gleam, Bitcoin was mined not with picks but with puzzles solved by machines. It promised freedom, a currency without kings, flowing from person to person, unbound by borders or empires.
Translation moment: Bitcoin works like digital gold. Instead of digging the ground, miners use computers to solve problems and unlock new coins. No one controls it, and that is what makes it powerful.
Through doubt and frenzy, it rose as a beacon for those seeking sovereignty in a digital world. Its volatility became its soul, a reminder that true value is built on belief. Bitcoin speaks to ingenuity and rebellion, a star of code guiding us toward a future where wealth is weightless yet profoundly honest.
Gold’s Cycles: Echoes of War and Crisis
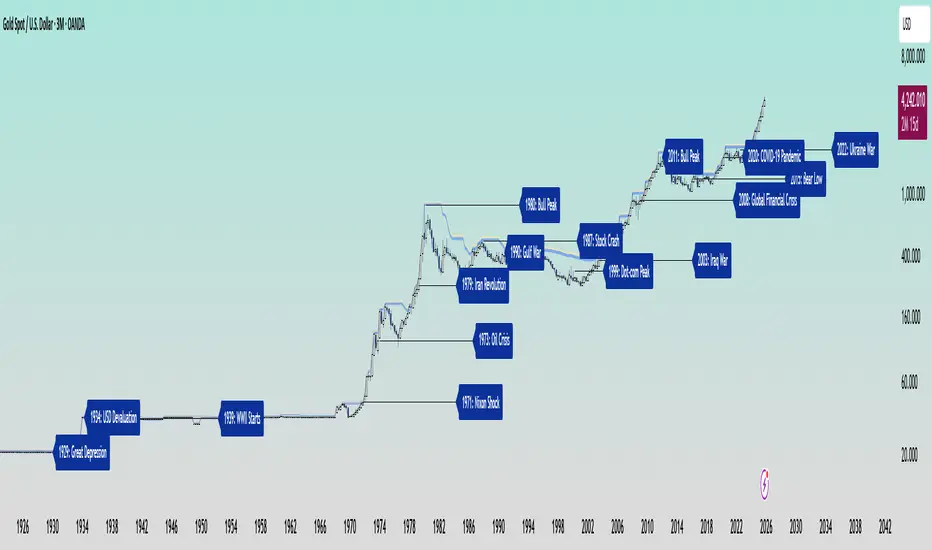
In the early 20th century, gold was held under fixed prices until the Great Depression of 1929 shattered these illusions. The 1934 dollar devaluation lifted it from 20.67 to 35, restoring faith amid despair. When World War II erupted in 1939, gold’s role as a refuge was muted by controls, yet it quietly held its place as the world’s silent guardian.
The 1970s awakened its wild spirit. The Nixon Shock of 1971 freed gold from 35, sparking a bull run during the 1973 Oil Crisis. The 1979 Iranian Revolution led to a 1980 peak of 850, a leap of more than 2,000 percent, as investors sought safety from the chaos.
Translation moment: When fear rises, people rush to gold. Every major war or economic crisis has sent gold upward because it feels safe when paper money loses trust.
The 1987 stock crash caused brief dips, but the 1990 Gulf War reignited its glow. Around 2000, after the Dot-com Bust, gold found new life, climbing from $ 270 to over $1,900 during the 2008 Financial Crisis. It dipped to 1050 in 2015, then surged again past 2000 during the 2020 pandemic.
The 2022 Ukraine War added another chapter with prices climbing above 2700 by 2025. Across a century of crises, gold has risen whenever fear tested humanity’s resolve, teaching patience and fortitude through its quiet endurance.
Bitcoin’s Cycles: Echoes of Innovation and Crisis
Born from the ashes of the 2008 Financial Crisis, Bitcoin began its story at mere cents. It traded below $1 until 2011, when it reached $30 before crashing by 90 percent following the MTGOX collapse.
In 2013, it soared to 1242 only to fall again to 200 in 2015 as regulations tightened. The 2017 bull run lifted it to nearly 20000 before another long winter brought it to 3200 in 2018. Each fall taught resilience, each rise renewed belief.
During the 2020 pandemic, it fell below 5000 before rallying to 69000 in 2021. The Ukraine War and the FTX collapse of 2022 brought it down to 16000, but also proved its role in humanitarian aid. By 2024, the halving and ETF approvals helped it break 100000, marking Bitcoin’s rise as digital gold.
Translation moment: Bitcoin’s rhythm follows four-year halving cycles when mining rewards are cut in half. This keeps supply limited, which often triggers new bull runs as demand returns.
Every four years, it's halving cycles 2012, 2016, 2020, 2024, fueling new waves of adoption and correction. Bitcoin grows strongest in times of uncertainty, echoing humanity’s drive to evolve beyond limits.
The Harmony of Gold and Bitcoin Modern Parallels
In today’s markets, gold’s ancient glow meets Bitcoin’s electric pulse. As of October 17, 2025, their correlation stands near 0.85, close to its historic high of 0.9. Both rise as guardians against inflation and the erosion of trust in the dollar.
Gold trades near 4310 per ounce a record high while Bitcoin hovers around 104700 showing brief fractures in their unity. Gold offers the comfort of touch while Bitcoin provides the thrill of code. Together, they reflect fear and hope, the twin emotions that drive every market.
Translation moment: A correlation of 0.85 means they often move in the same direction. When fear or inflation rises, both gold and Bitcoin tend to rise in tandem.
Analysts warn of bubbles in stocks, gold, and crypto, yet optimism remains for Bitcoin’s growth through 2026, while gold holds its defensive strength.
Gold carries risks of storage cost and theft, but steadiness in chaos. Bitcoin carries volatility and regulatory challenges, but it also offers unmatched innovation and reach. One is the anchor, the other the dream, and both reward those who hold conviction through uncertainty.
Epilogue: The Timeless Balance
Gold and Bitcoin form a bridge between the ancient and the future. Gold, the earth’s eternal treasure, stands as a symbol of stability and truth. Bitcoin, the digital heir, shines with the spark of innovation and freedom.
Experts view gold as the ultimate inflation hedge, forged in fire and tested over centuries. They see Bitcoin as its digital counterpart, scarce by code and limitless in reach.
Gold’s weight grounds us in reality while Bitcoin’s light expands our imagination. In 2025, as gold surpasses $4,346 and Bitcoin hovers near $105,000, the wise investor sees not rivals but reflections.
Translation moment: Gold reminds us to protect what we have. Bitcoin reminds us to dream of what could be. Together, they balance caution and courage, the two forces every generation must master.
One whispers of legacy, the other of evolution, yet together they tell humanity’s oldest story, our unending quest to preserve value against time and to chase the light that never fades.
🙏 I ask (Allah) for guidance and success. 🤲
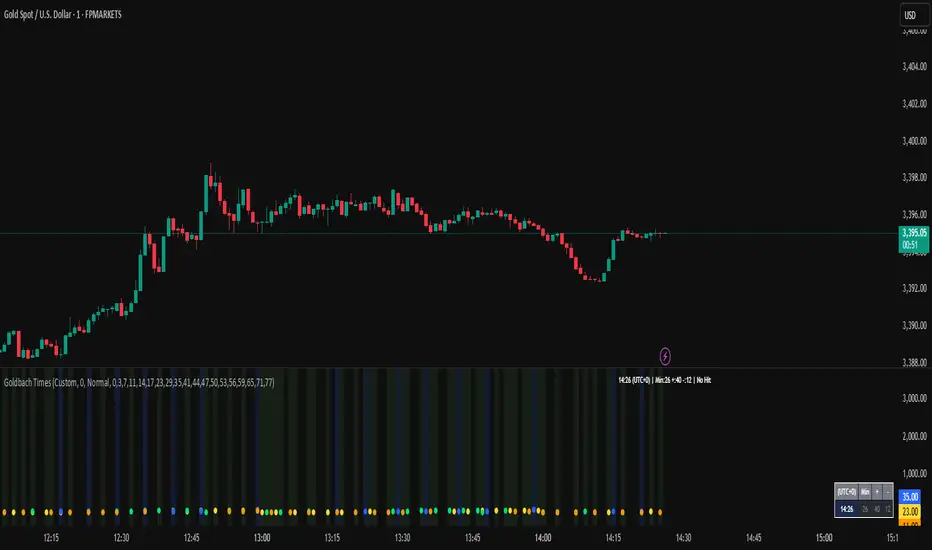
Goldbach Time Indicator🔧 Key Fixes Applied:
1. Time Validation & Bounds Checking:
Hour/Minute Bounds: Ensures hours stay 0-23, minutes stay 0-59
Edge Case Handling: Prevents invalid time calculations from causing missing data
UTC Conversion Safety: Better handling of timezone edge cases
2. Enhanced Value Validation:
NA Checking: Validates all calculated values before using them
Goldbach Detection: Only flags valid, non-NA values as Goldbach hits
Plot Safety: Prevents plotting invalid or NA values that could cause gaps
3. Improved Plot Logic:
Core Level Colors: Blue for core levels (29,35,71,77), yellow/lime/orange for regular hits
Debug Mode Enhanced: Shows all calculations with gray dots when enabled
Better Filtering: Only plots positive, valid values for minus calculations
4. Background vs Dots Issue:
The large green/blue background you see suggests the indicator is detecting Goldbach times correctly, but the dots weren't plotting due to validation issues. This should now be fixed.
Goldman Sachs Risk Appetite ProxyRisk appetite indicators serve as barometers of market psychology, measuring investors' collective willingness to engage in risk-taking behavior. According to Mosley & Singer (2008), "cross-asset risk sentiment indicators provide valuable leading signals for market direction by capturing the underlying psychological state of market participants before it fully manifests in price action."
The GSRAI methodology aligns with modern portfolio theory, which emphasizes the importance of cross-asset correlations during different market regimes. As noted by Ang & Bekaert (2002), "asset correlations tend to increase during market stress, exhibiting asymmetric patterns that can be captured through multi-asset sentiment indicators."
Implementation Methodology
Component Selection
Our implementation follows the core framework outlined by Goldman Sachs research, focusing on four key components:
Credit Spreads (High Yield Credit Spread)
As noted by Duca et al. (2016), "credit spreads provide a market-based assessment of default risk and function as an effective barometer of economic uncertainty." Higher spreads generally indicate deteriorating risk appetite.
Volatility Measures (VIX)
Baker & Wurgler (2006) established that "implied volatility serves as a direct measure of market fear and uncertainty." The VIX, often called the "fear gauge," maintains an inverse relationship with risk appetite.
Equity/Bond Performance Ratio (SPY/IEF)
According to Connolly et al. (2005), "the relative performance of stocks versus bonds offers significant insight into market participants' risk preferences and flight-to-safety behavior."
Commodity Ratio (Oil/Gold)
Baur & McDermott (2010) demonstrated that "gold often functions as a safe haven during market turbulence, while oil typically performs better during risk-on environments, making their ratio an effective risk sentiment indicator."
Standardization Process
Each component undergoes z-score normalization to enable cross-asset comparisons, following the statistical approach advocated by Burdekin & Siklos (2012). The z-score transformation standardizes each variable by subtracting its mean and dividing by its standard deviation: Z = (X - μ) / σ
This approach allows for meaningful aggregation of different market signals regardless of their native scales or volatility characteristics.
Signal Integration
The four standardized components are equally weighted and combined to form a composite score. This democratic weighting approach is supported by Rapach et al. (2010), who found that "simple averaging often outperforms more complex weighting schemes in financial applications due to estimation error in the optimization process."
The final index is scaled to a 0-100 range, with:
Values above 70 indicating "Risk-On" market conditions
Values below 30 indicating "Risk-Off" market conditions
Values between 30-70 representing neutral risk sentiment
Limitations and Differences from Original Implementation
Proprietary Components
The original Goldman Sachs indicator incorporates additional proprietary elements not publicly disclosed. As Goldman Sachs Global Investment Research (2019) notes, "our comprehensive risk appetite framework incorporates proprietary positioning data and internal liquidity metrics that enhance predictive capability."
Technical Limitations
Pine Script v6 imposes certain constraints that prevent full replication:
Structural Limitations: Functions like plot, hline, and bgcolor must be defined in the global scope rather than conditionally, requiring workarounds for dynamic visualization.
Statistical Processing: Advanced statistical methods used in the original model, such as Kalman filtering or regime-switching models described by Ang & Timmermann (2012), cannot be fully implemented within Pine Script's constraints.
Data Availability: As noted by Kilian & Park (2009), "the quality and frequency of market data significantly impacts the effectiveness of sentiment indicators." Our implementation relies on publicly available data sources that may differ from Goldman Sachs' institutional data feeds.
Empirical Performance
While a formal backtest comparison with the original GSRAI is beyond the scope of this implementation, research by Froot & Ramadorai (2005) suggests that "publicly accessible proxies of proprietary sentiment indicators can capture a significant portion of their predictive power, particularly during major market turning points."
References
Ang, A., & Bekaert, G. (2002). "International Asset Allocation with Regime Shifts." Review of Financial Studies, 15(4), 1137-1187.
Ang, A., & Timmermann, A. (2012). "Regime Changes and Financial Markets." Annual Review of Financial Economics, 4(1), 313-337.
Baker, M., & Wurgler, J. (2006). "Investor Sentiment and the Cross-Section of Stock Returns." Journal of Finance, 61(4), 1645-1680.
Baur, D. G., & McDermott, T. K. (2010). "Is Gold a Safe Haven? International Evidence." Journal of Banking & Finance, 34(8), 1886-1898.
Burdekin, R. C., & Siklos, P. L. (2012). "Enter the Dragon: Interactions between Chinese, US and Asia-Pacific Equity Markets, 1995-2010." Pacific-Basin Finance Journal, 20(3), 521-541.
Connolly, R., Stivers, C., & Sun, L. (2005). "Stock Market Uncertainty and the Stock-Bond Return Relation." Journal of Financial and Quantitative Analysis, 40(1), 161-194.
Duca, M. L., Nicoletti, G., & Martinez, A. V. (2016). "Global Corporate Bond Issuance: What Role for US Quantitative Easing?" Journal of International Money and Finance, 60, 114-150.
Froot, K. A., & Ramadorai, T. (2005). "Currency Returns, Intrinsic Value, and Institutional-Investor Flows." Journal of Finance, 60(3), 1535-1566.
Goldman Sachs Global Investment Research (2019). "Risk Appetite Framework: A Practitioner's Guide."
Kilian, L., & Park, C. (2009). "The Impact of Oil Price Shocks on the U.S. Stock Market." International Economic Review, 50(4), 1267-1287.
Mosley, L., & Singer, D. A. (2008). "Taking Stock Seriously: Equity Market Performance, Government Policy, and Financial Globalization." International Studies Quarterly, 52(2), 405-425.
Oppenheimer, P. (2007). "A Framework for Financial Market Risk Appetite." Goldman Sachs Global Economics Paper.
Rapach, D. E., Strauss, J. K., & Zhou, G. (2010). "Out-of-Sample Equity Premium Prediction: Combination Forecasts and Links to the Real Economy." Review of Financial Studies, 23(2), 821-862.

Gold Trade Setup Strategy
Title: Profitable Gold Setup Strategy with Adaptive Moving Average & Supertrend
Introduction:
This trading strategy for Gold (XAU/USD) combines the Adaptive Moving Average (AMA) and Supertrend, tailored for high-probability setups during specific trading hours. The AMA identifies the trend, while the Supertrend confirms entry and exit points. The strategy is optimized for swing and intraday traders looking to capitalize on Gold’s price movements with precise trade timing.
Strategy Components:
1. Adaptive Moving Average (AMA):
• Reacts dynamically to market conditions, filtering noise in choppy markets.
• Serves as the primary trend indicator.
2. Supertrend:
• Confirms entry signals with clear buy and sell levels.
• Acts as a trailing stop-loss to protect profits.
Trading Rules:
Trading Hours:
• Only take trades between 8:30 AM and 10:30 PM IST.
• Avoid trading outside these hours to reduce noise and low-volume setups.
Buy Setup:
1. Trend Confirmation: The Adaptive Moving Average (AMA) must be green.
2. Signal Confirmation: The Supertrend should turn green after the AMA is green.
3. Trigger: Take the trade when the high of the trigger candle (the candle that turned Supertrend green) is broken.
Sell Setup (Optional if included):
• Reverse the rules for a short trade: AMA and Supertrend should both indicate bearish conditions (red), and take the trade when the low of the trigger candle is broken.
Stop-Loss and Targets:
• Place the stop-loss at the low of the trigger candle for long trades.
• Set a 1:2 risk-reward ratio or use the Supertrend line as a trailing stop-loss.
Timeframes:
• Recommended timeframes: 1H, 4H, or Daily for swing trading.
• For intraday trading, use 15-minute or 30-minute charts.
Why This Strategy Works:
• Combines trend-following (AMA) with momentum-based entries (Supertrend).
• Focused trading hours filter out low-probability setups.
• Provides precise entry, stop-loss, and target levels for disciplined trading.
Conclusion:
This Gold Setup Strategy is designed for traders seeking a structured approach to trading Gold. Follow the rules strictly, backtest the strategy extensively, and share your results. Let’s master the Gold market together!
Tags: #Gold #XAUUSD #SwingTrading #Intraday #Supertrend #AMA #TechnicalAnalysis #GoldStrategy
