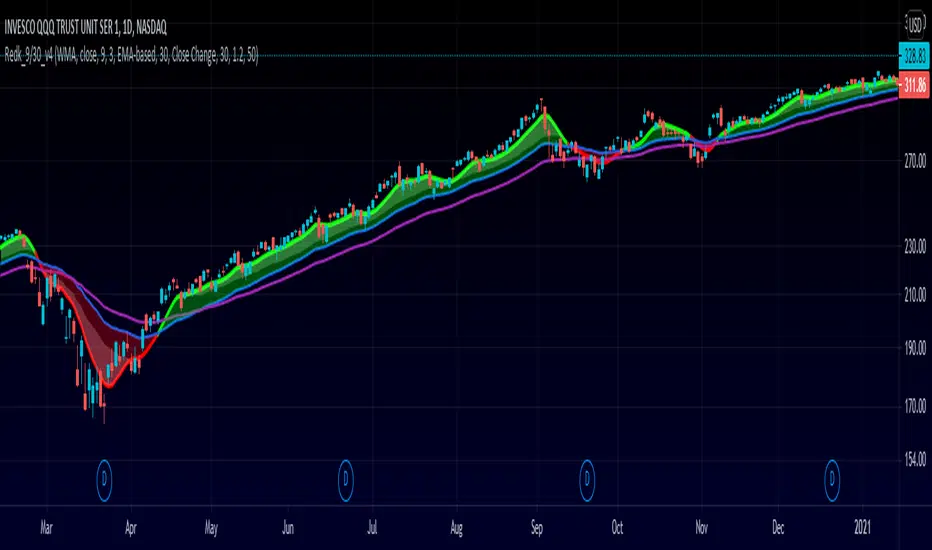
RedK_9/30 Trader_v1: aka The MusicianThis is my implementation of a simple trading system inspired by the 9/30 trading strategy, which i came across few years ago. i hope some traders are still using it :)
(please google "9/30 trading strategy" if you're not sure what it is)
- the improvements i added focus on: faster (long/short) signals, discovery of best entry "zone", ride the trend
- no exit option, trader can use a pre-set target, a trailing stop, or any other mechanisms
- i tried to explain some of the definitions and rules on the below chart
- in spite if its simplicity, the 9/30 has a lot to offer - different traders will also use it differently and add their own "do's and don't's"
default settings should be adjusted to suit timeframe, type of trader and what is being traded (Stocks, FOREX,..etc) - the concept itself is very flexible and well-tested for mechanical trading.
code-named "The Musician" due to the 5-line plot :)
i will continue to improve this work whenever i find time - i liked it a lot.. (please tag the idea to receive the updates)
Extras and improvements (compared to the classic 9/30 concept)
---------------------------------------------------------------------------------
* signal line is a smoothed zero-lag WMA of a shorter length (responds faster to trend change = faster signal)
* instead of a single longer MA line, we utilize an "average range" -based channel (not ATR, but provides the same concept) to provide the ideal "entry zones" in both directions - an adjustable multiplier is included in the settings to adjust the channel width
* adds an optional long EMA as additional filter (take longs only above, take shorts only below)
* clearer visualization
What's next:
==============
* clean-up code
* add signals (arrow-up & arrow-dn) for entry and for exit
* tri-color signal line (green on long, red on short, gray on no trade)
* other options for the channel (ATR-based, DC center-line..etc)
* other MA-type options for the Filter MA (SMA, WMA ?)
* maybe: convert to strategy and back-test
Please feel free to explore and test - Comments and feedback are welcome.
Good Luck!
Cerca negli script per "Google公司基本面分析"
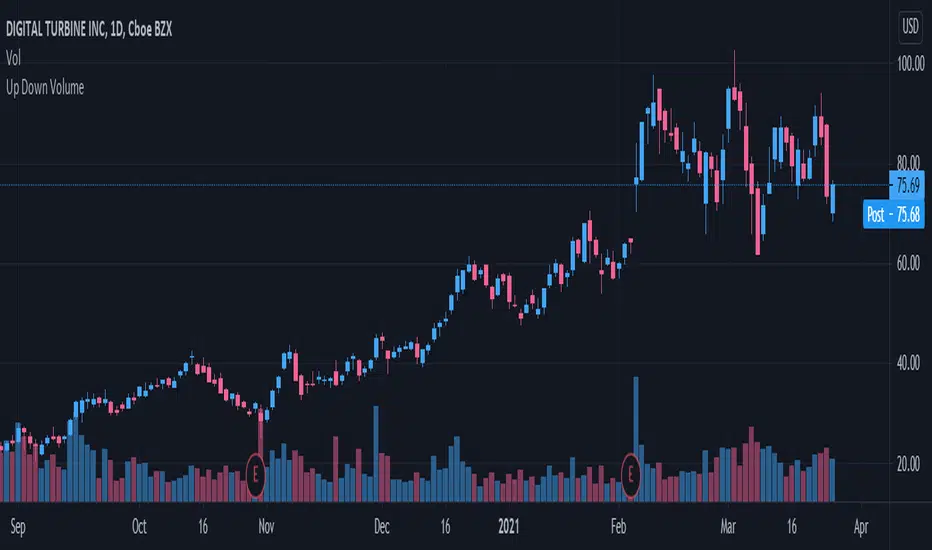
Up/Down Volume RatioUp/Down Volume Ratio is calculated by summing volume on days when it closes up and divide that total by the volume on days when the stock closed down.
High volume up days are typically a sign of accumulation(buying) by big players, while down days are signs of distribution(selling) by big market players. The Up Down volume ratio takes this assumption and turns it into a tangible number that's easier for the trader to understand. My formula is calculated using the past 50 periods, be warned it will not display a value for stocks with under 50 periods of trading history. This indicator is great for identify accumulation of growth stocks early on in their moves, most of the time you would like a growth stocks U/D value to be above 2, showing institutional sponsorship of a stock.
Up/Down Volume value interpretation:
U/D < 1 -> Bearish outlook, as sellers are in control
U/D = 1 -> Sellers and Buyers are equal
U/D > 1 -> Bullish outlook, as buyers are in control
U/D > 2 -> Bullish outlook, significant accumulation underway by market makers
U/D >= 3 -> MONSTER STOCK ALERT, market makers can not get enough of this stock and are ravenous to buy more
U/D values greater than 2 are rare and typically do not last very long, and U/D >= 3 are extremely rare one example I kind find of a stock's U/D peaking above 3 was Google back in 2005.
MAKE SURE TO HIT THE SETTINGS WHEEL AND CHECK THE BOX NEXT TO PLOT IN ORDER TO GET RID OF THE PLOTTED LINE.
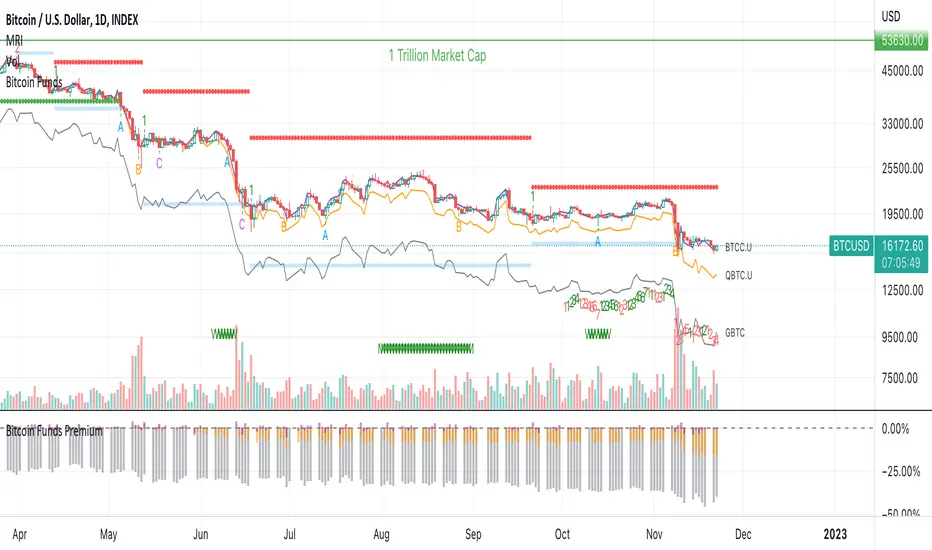
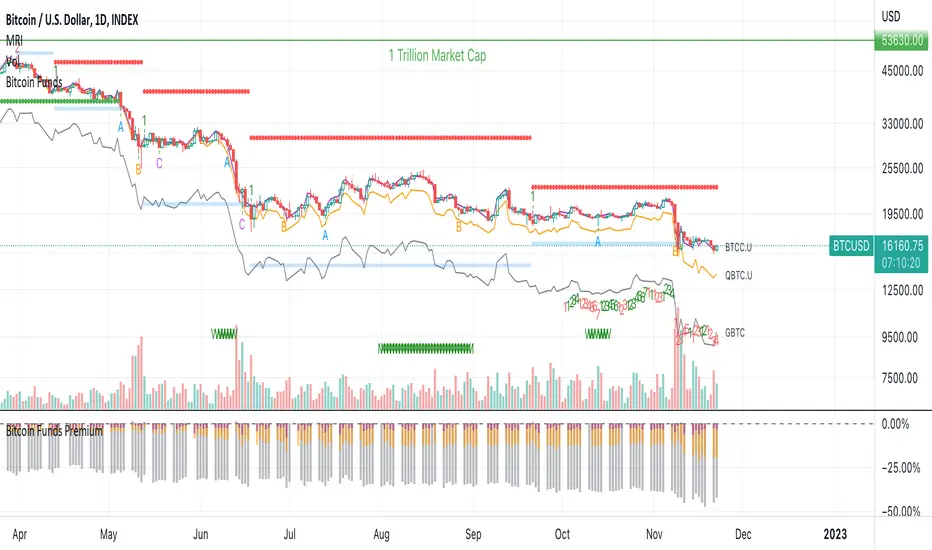
Bitcoin Funds PremiumDisplay the % premium of 4 different Bitcoin Funds relative to the price of Bitcoin in your current chart.
BTCC ETF
QBTC Fund
GBTC Trust
VBTC ETN
This indicator uses the metrics from the fund management websites to calculate the "Net Asset Value per Unit (NAVPU)" to calculate the true underlying value of the fund.
The difference is then compared to the price of Bitcoin in the chart you have open.
Note that the metrics change and therefore the graph is not accurate for long past timeframes.
If TradingView would expand their script language in a way to ingest CSV data from the funds website then this could be improved.
You can update the metrics for each fund in the settings dialogue.
The script will autodetect the currency pairs of your current graph and only display compatible funds:
BTC / USD will show BTCC.U, QBTC.U and GBTC
BTC / CAD will show BTCC and QBTC
BTC / EUR will show VBTC
The script should not show in other currency pairs so it will not mess up other charts you might switch to.
If you find bugs with this logic, please comment below so I can fix them.
Due to TradingViews "no-links in description" policy, you need to google each funds website yourself to find the current metrics. These search terms should help:
BTCC search "Purpose Bitcoin ETF"
QBTC search "3iq The Bitcoin Fund (QBTC)"
GBTC search "Grayscale® Bitcoin Trust"
VBTC search "VanEck Vectors Bitcoin ETN"
Bitcoin Funds OverlayOverlay the Net Asset Value per Unit (NAVPU) of 4 different Bitcoin Funds on your Bitcoin chart.
BTCC ETF
QBTC Fund
GBTC Trust
VBTC ETN
This indicator uses the metrics from the fund management websites to calculate the "Net Asset Value per Unit (NAVPU)" to display the true underlying value of the fund.
Note that the metrics can change and therefore the graph is not accurate for long past timeframes.
You can update the metrics for each fund in the settings dialogue.
The script will autodetect the currency pairs of your current graph and only display compatible funds:
BTC / USD will show BTCC.U, QBTC.U and GBTC
BTC / CAD will show BTCC and QBTC
BTC / EUR will show VBTC
The script should not show in other currency pairs so it will not mess up other charts you might switch to.
If you find bugs with this logic, please comment below so I can fix them.
Due to TradingViews "no-links in description" policy, you need to google each funds website yourself to find the current metrics. These search terms should help:
BTCC search "Purpose Bitcoin ETF"
QBTC search "3iq The Bitcoin Fund (QBTC)"
GBTC search "Grayscale® Bitcoin Trust"
VBTC search "VanEck Vectors Bitcoin ETN"
Correlation MeterThis script calculates the covariance and correlation coefficient between two markets using arrays.
Lookback: How many bars to perform the calculation on.
Source: Price source to calculate the correlation on.
Reference Market: The reference market to compare to the current market.
It's a simple indicator, but very useful for determining how correlated your preferred markets to trade are.
A correlation reading of +1.0 means the markets are perfectly positively correlated, a reading of -1.0 means they are perfectly negatively correlated.
If you're not sure what correlation & covariance are then Google the terms with "Investopedia" added to the end - they have some great definitions and examples.
For traders this can be useful for deciding how much risk to spread across two markets that have a high correlation, or how to hedge existing positions by trading a negatively correlated market.
For investors this can be useful for building a truly diversified portfolio.
If a market has a high positive correlation, the black line will stay above zero most of the time. If a market has a high negative correlation, the black line will stay below zero most of the time.
A market with no or little correlation will bounce between the two or hover around zero most of the time.
The example market above is comparing Apple's weekly price action to the S&P500's over the past 20 weeks. It has a high positive correlation as the black line is above zero most of the time.
Good luck with your trading!

Trend Line Fibonacci [TLF]TLF is a price based Adaptive Scalping Indicator ideally to be used over lower timeframes
1min, 5min,.... 30 min
Its made using pivot calculations of fibonacci lookback lengths, which gives it an adaptability
default lookback lengths are:
55,89,144,233
This indicator is a pine script clone of Trend Line Fibonacci as available in MT4
google search ( prorealcode , trend line fibonacci )
Volume calculationHello friends
First let me say that my English is poor and I am using Google Translator 😬🙃🙃🙃
Secondly, this indicator is open source and its use is allowed in its indicator, but in order to play it, my name must be mentioned.
Well, let's go to the description of the indicator :
This indicator gives you the amount of purchasing volume in relation to the capital, the risk you trade and the stop loss.
And shows you the LRP
I hope you use the indicator well
Your pocket is full of money
Let me say that I am Iranian

Indices Sector SigmaSpikes█ OVERVIEW
“The benchmark Dow Jones Industrial Average is off nearly 300 points as of midday today...”
“So what? Is that a lot or a little? Should we care?”
-Adam H Grimes-
This screener aims to provide Bird-Eye view across sector indices, to find which sector is having significant or 'out-of-norm' move in either direction.
The significance of the move is measured based on Sigma Spikes, a method proposed by Adam H. Grimes, where Standard Deviation of returns used as a baseline.
*You can google his blog or read his book, got some gold in there, especially on how he use indicators for trading
█ Understanding Sigma Spikes
As described by Grimes, moves in markets are only meaningful when we consider what “normal” is for that market.
Without that baseline, the daily change number, and even the percent change on the day doesn’t really mean much.
To overcome that problem, Sigma Spikes, as a measure of volatility, attempt to put todays change in price (aka return) in context of the standard deviation of 20 days daily's return.
Refer chart below:
1. The blue bars refer to each days return
2. The orange line is 1 time standard deviation of past 20days daily's return (today not included)
3. The red line is 2 time standard deviation of past 20days daily's return (today not included)
Using the ratio of today's return over the Std Deviation, determining your threshold (1,2,3,etc) will be the key that tells if today's move is significant or not.
*Threshold referring to times standard deviation, and different market may require different threshold.
*20 Days period are based on the Lookback Period, adjustable from user input window.
█ Features
- Scan up to 13 symbols at a time (Bursa (MYX) indices are defaulted, but you may change to any symbols/index from the user input setting)
█ Limitation
- Due to multiple use of security() function required to call other symbols, expect the screener to be slow at certain times
- Custom Timeframe currently accept only Daily and Weekly. I'll try to include lower timeframe in the next update
█ Disclaimer
Past performance is not an indicator of future results.
My opinions and research are my own and do not constitute financial advice in any way whatsoever.
Nothing published by me constitutes an investment recommendation, nor should any data or Content published by me be relied upon for any investment/trading activities.
I strongly recommends that you perform your own independent research and/or speak with a qualified investment professional before making any financial decisions.
Any ideas to further improve this indicator are welcome :)

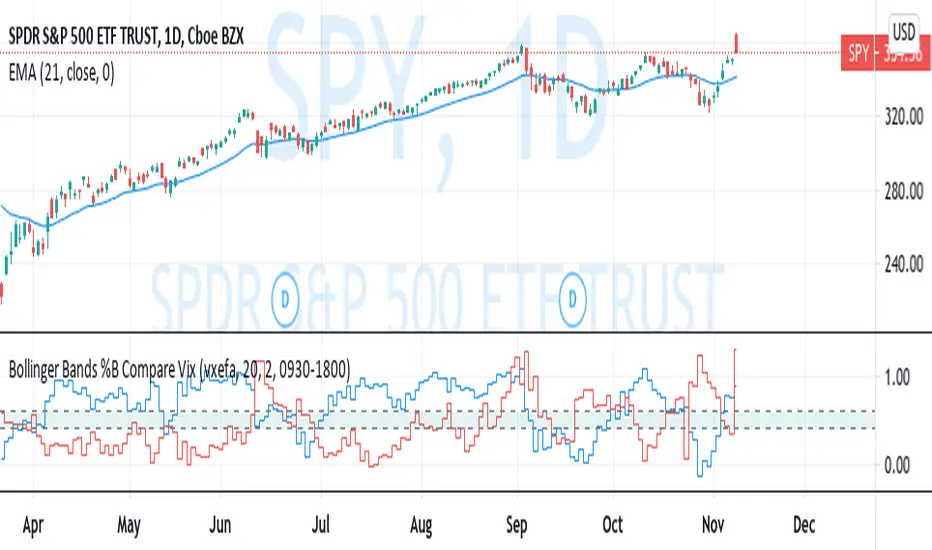
Bollinger Bands %B Compare VixThis imple script converts your chosen chart price and outputs it as a percentage in relation to the Vix percentage.
If price (Blue line) is higher than 0.60 and vix (Red Line) is lower than 0. 40 then there is lower volatility and this is good for buying.
If price (Blue line) is lower than 0. 40 and vix (Red Line) is higher than 0.60 then there is higher volatility and this is good for selling, exiting and cash only.
If you like risk you can enter as soon as the price and vix cross in either direction
This is my first script, please give me a lot of critique, I won't cry hahaha :)
For greater accuracy, you use these Vix products for their specific stocks/Indicies:
Apple - VXAPL
Google - VXGOG
Amazon - CBOE:VXAZN
IBM - CBOE:VXIBM
Goldman Sachs - CBOE:VXGS
NASDAQ 100 = CBOE:VXN
SP100 - CBOE:VXO
SP500 (3months) - VIX3M
XLE(energy sector) - CBOE:VXXLE
EWZ(brazil etf) - VXEWZ
EEM( emerging markets etf) - CBOE:VXEEM
EFA (MSCI ETF) - CBOE:VXEFA
FXI (Cina ETF) - CBOE:VXFXI
GAURs Polynomial Regression ChannelsThanks to The Sweet Lord , here is the Gaur's Polynomial Regression Channel.
Its a Polynomial Regression Channel but applied a little differently. Wont go into technical details much. Overview of options is as follows-
- - - - - - - - - - - - - - - - - - - - - - - - - - - - - - - - - - - - - - - - - - - - - - - - - - - - - - - - - - - - - - - - - - - - - - - - - - - - - - - - - - - - - - - - - - - - - - - -
Channel Options
- - - - - - - - - - - - - - - - - - - - - - - - - - - - - - - - - - - - - - - - - - - - - - - - - - - - - - - - - - - - - - - - - - - - - - - - - - - - - - - - - - - - - - - - - - - - - - - -
1. Degree of Polynomial: 1/2/3
Default = 3
Defines the degree of polynomials - 1,2,3. Note here, degree 1 will not be a straight line since its applied differently.
Try different degrees for different fits and market conditions.
2. Channel Length:
Default 30 (candles)
You can go beyond 100 or 200 candle lengths but smaller is the usual preference of Poly-Reg-channel traders. It all depends on market conditions and your style of trading. Do your research. I am usually comfortable with a range of 20-50 (in crypto markets).
3. Basis of Channel height/boundries: ATR/Manual
Default: ATR
ATR provides a dynamically adjusted entry/exit bounds of the channels. As ATR changes, the channel bounds also changes its height. It can also be fixed manually. Manual heights wont change automatically.
4. Basis of Y-Value: open/close/ sma / ema / wma /hilow
Default: close
Y- value is the y value of the (x,y) coordinates used while calculating the regression coefficients. Dont worry about it, its nothing serious.
5. Apply channel smoothning using sma?: Yes/No
Default: Yes
Without smoothning, the channel does not "look" good.
6. Shaded Area Height Percentage:
Its the extra margin for the channel. Its in percentage of the total height (defined 3 above) of channels. The shaded area provides an extra allowance for your entries or exits beyond the ATR or manual heights.
7. Plot RSI?: Yes/No
Default: Yes
Plots RSI (orange line in between the channel - its different from the dotted center line) considering the downbound of channels as 0 (oversold) and upbound of channels as 100 (overbought)
8. Plot 200 sma?: Yes/No
Default: Yes
It plots a 200 period fast (green) and 225 period slow (red) sma . I usually use two MAs. Its visually very easy to understand.
- - - - - - - - - - - - - - - - - - - - - - - - - - - - - - - - - - - - - - - - - - - - - - - - - - - - - - - - - - - - - - - - - - - - - - - - - - - - - - - - - - - - - - - - - - - - - - - -
Sample Strategy
- - - - - - - - - - - - - - - - - - - - - - - - - - - - - - - - - - - - - - - - - - - - - - - - - - - - - - - - - - - - - - - - - - - - - - - - - - - - - - - - - - - - - - - - - - - - - - - -
You can develop your own strategy with the channels. But following is just one of the ways you can trade.
Best Application: Ranging markets. But can be happily used in volatile conditions, with a little experience.
1. SMA: -- (this condition is optional really)
If green (200) is above red (225) go only long. If red is above green go only short. Defines long term trend of the market.
2. Channel slope: -- (this stuff needs practice/experience)
Depending on the channel slope, like if its tending to go up or down, you can choose to take only short or long trades. It defines short term momentum of the market.
3. ATR based heights:
Since its ATR based, the channel height are our natural entry and exit points.
Long:
When price touches lower shaded area, consider possible long entry. Exit on price entering the upper shaded area.
Short:
Enter on upper bound shaded area, exit on lower.
4. RSI:
For additional conformations. Again note, the RSI considers the lower bound of channel as 0 and upper as 100. But since, the channel moves up and down, the RSI will also move not only as RSI but also with the channel. Meaning, say if the RSI is valued at 50, then it will be near the center of the channel but since the center changes as time and price changes, the RSI valued at 50 at different times will not be at the same horizontal level respect to the graph, although it will be at the same level (center) respect to the channel.
5. PRC Channel Percentage label:
This label is at the lower side a bit ahead of the current candle. Provides you info on what is the channel percentage. This is especially helpful in crypto markets to gauge your possible percentage profit where profits can be much higher than forex or other instruments. It can also helps you select a suitable market/instrument if the channels are based on ATR.
6. Extra indicators:
I usually use stochastic along with this setup for extra conformations.
- - - - - - - - - - - - - - - - - - - - - - - - - - - - - - - - - - - - - - - - - - - - - - - - - - - - - - - - - - - - - - - - - - - - - - - - - - - - - - - - - - - - - - - - - - - - - - - -
Donate
- - - - - - - - - - - - - - - - - - - - - - - - - - - - - - - - - - - - - - - - - - - - - - - - - - - - - - - - - - - - - - - - - - - - - - - - - - - - - - - - - - - - - - - - - - - - - - - -
Use freely and donate generously if you find value. Your help will really help.
I had earlier provided BTC addresses for donations but it seems to violate TV House rules.
Hope they make TV coins redeemable in future.
- Pranav Joshi
- - - - - - - - - - - - - - - - - - - - - - - - - - - - - - - - - - - - - - - - - - - - - - - - - - - - - - - - - - - - - - - - - - - - - - - - - - - - - - - - - - - - - - - - - - - - - - - -
Extra Info
- - - - - - - - - - - - - - - - - - - - - - - - - - - - - - - - - - - - - - - - - - - - - - - - - - - - - - - - - - - - - - - - - - - - - - - - - - - - - - - - - - - - - - - - - - - - - - - -
// © cpranavjoshi
// special thanks to the "Trading View" people for providing this great platform for free
// ------------------------
// MATH
// ------------------------
// special thanks to an article on the web that provided layman friendly explanation of the maths
// unfortunately i wont be able to provide the link to that article owing to TV restrictions, though i sincerely would have liked to credit the author.
// Google search this phrase, and you should be able to get it in one of the first results - "polynomialregression Mathematics of Polynomial Regression"
// my regression math calculation is a further resolution upon the generalized matrix formula given in the that article.
// the generalized matrix looks scary but in fact its much simpler than one may assume
// the summation sign things are just float numbers that can be easily found out
// so we get a matrix with number of equations equal to the number of unknowns.
// e.g. if its a 3rd degree poly, it has 4 unknowns (c0,c1,c2,c3) with 4 equations as in the generalized matrix
// it can be resolved by simple algebra
// Note: the results have been verified with excel using same input data points.
// pine was difficult for me so i coded it in python first to verify
// ------------------------
// WHY
// ------------------------
// this script was coded because Pranav badly needed Polynomial channels (had used them in mt4 earlier)
// and at the time of this coding, i could not find any readily available script in the trading view public library ( tnx public)
// the complex math was probably the hurdle
// i m not good in maths, but by the Will of the Lord, i could resolve the issue with simple algebra and logic
// ------------------------
// PINE
// ------------------------
// i am just an average (even poor probably) programmer and pine script is not my language
// this is a humble attempt to write my first pine with whatever i could do quickly
// experts - feel free to develop if needed. have used some workarounds in drawings/plottings. rectify them if possible
//
//
// - Pranav Joshi

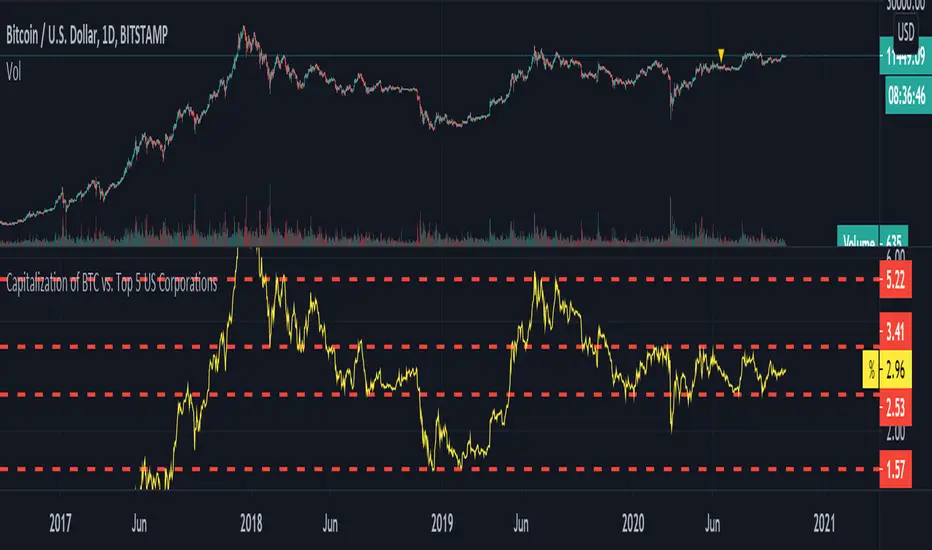
Capitalization of BTC vs. Top 5 US CorporationsThis script displays the capitalization of Bitcoin as a percentage of the capitalization of 5 large US corporations: Apple, Microsoft, Amazon, Google, Facebook. According to www.tradingview.com these are (at the current time) the largest US companies.
Position Sizing Calculator [racer8]Brief Description:
This indicator calculates your position size. It adjusts to the ATR & the maximum amount of risk (% of equity) you can tolerate.
Thus, it allows you to control your risk & adapt to market volatility.
Recommended settings for parameters:
Converted Capital ***Make sure you convert your capital's currency to whatever currency/instrument you are trading. (Use Google)
Percent Risk = 1 to 3
ATR SL Multiplier = 1 to 2
ATR Period = 7 to 14
How it's calculated:
Risk amount = Converted Capital * ( Percent Risk / 100 )
Stop Loss = ATR * (ATR SL Multiplier)
# of Units = Risk amount / Stop loss
Hit the like button & enjoy!

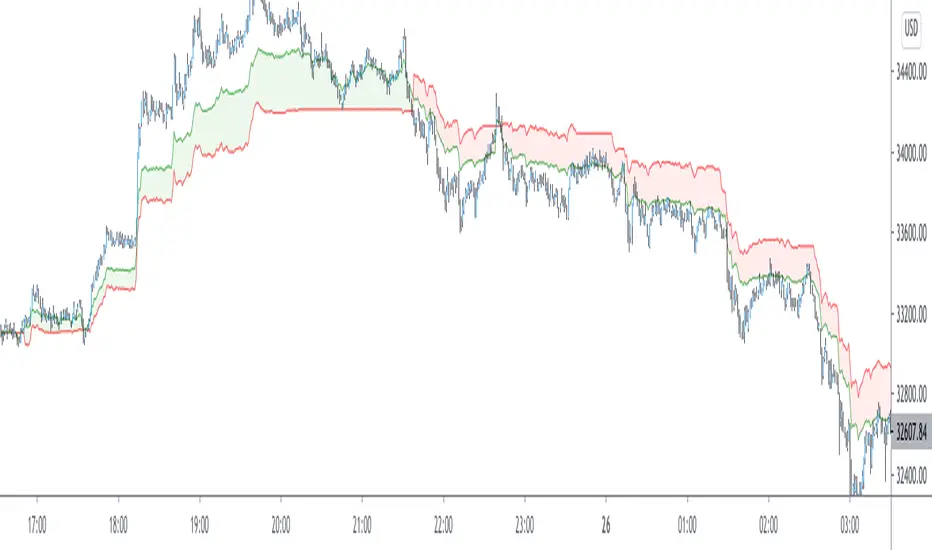
Mean recursion envelopeFree for public consumption
There is very little original here, the idea is discussed in the underground traders alliance, (google em), and was apparently the basis of what was at one time myfxbooks most profitable strategy.
I can't find the original video that was floating around on youtube, but if i find it again, i'll link it here.
This is bascially just the TV default envelope code copied and modified.
The idea is to have an envelope based on a low length, exponential basis. Then to manually "tune" the percent input so that the envelopes engulf most bars. Whenever price goes outside the envelopes (especially at key levels), look for a change to enter a reversion back to the ema.
This manual tuning when switching between time-frames and symbols of the percentage input, becomes arduous.
Instead this script uses the TV envelope code, but gets a setting based on the average of true range and "autotunes" with this.
Anything that protrudes beyond that level, especially at key levels, is likely to revert back to the ema. Bear in mind, a run away trend will also push past the envelopes and continue running for several (3-5) bars so, use it mindfully and thoughtfully with all the usual cautions about risk management.

Alpha & BetaAlpha & Beta Indicators for Portfolio Performance
β = Σ Correlation (RP, RM) * (σP/σM)
α P = E(RP) –
Where,
RP = Portfolio Return (or Investment Return)
RM = Market Return (or Benchmark Index)
RF = Risk-Free Rate
How to use the Indicator
RM = SPX (Default)
The Market Return for the indicator has the options of $SPX, $NDX, or $DJI (S&P 500, Nasdaq 100, Dow 30)
RF = FRED: DTB3
The Risk-Free Rate in the Indicator is set to the 3-Month Treasury Bill: Secondary Market Rate
The Default Timeframe is 1260 or 5-Years (252 Trading Days in One Year)
RP = The symbol you enter
HOWEVER , you can determine your portfolio value by following the following directions below.
Note: I am currently working on an indicator that will allow you to insert the weights of your positions.
Complete Portfolio Analysis Directions
You will first need...
a) spreadsheet application - Google Sheets is Free, but Microsoft Excel will convert ticker symbols to Stocks and Retrieve Data.
b) your current stock tickers, quantity of shares, and last price information
In the spreadsheet,
In the first column list the stock tickers...
AMZN
AAPL
TSLA
In the second column list the quantity of shares you own...
5
10
0.20
In the third column insert the last price
Excel: Three tickers will automatically give you the option to "Convert to Stocks",
after conversion, click once on cell and click the small tab in the upper right-hand of the highlighted cell.
Click the tab and a menu pops up
Find "Price", "Price Extended-Hours", or "Previous Close"...
$3,284.72
$497.48
$2,049.98
Next, multiply the number of shares by the price (Stock Market Value)
Excel: in fourth column type "=(B1*C1)", "=(B2*C2)", "=(B3*C3)"...
= $16,423.60
= $4,974.80
= $410.00
add the three calculated numbers together or click "ΣAutoSum" (Portfolio Market Value)
= $21,808.40
Last, divide the market value of AMZN ($16,423.60) by the Portfolio Market Value ($21,808.40) for each of the stocks.
= 0.7531
= 0.2281
= 0.0188
These values are the weight of the stock in your portfolio.
Go back to TradingView
Enter into the "search box" the following...
AMZN*0.7531 + AAPL*0.2281 + TSLA*0.0188
and click Enter
Now you can use the "Alpha & Beta" Indicator to analyze your entire portfolio!

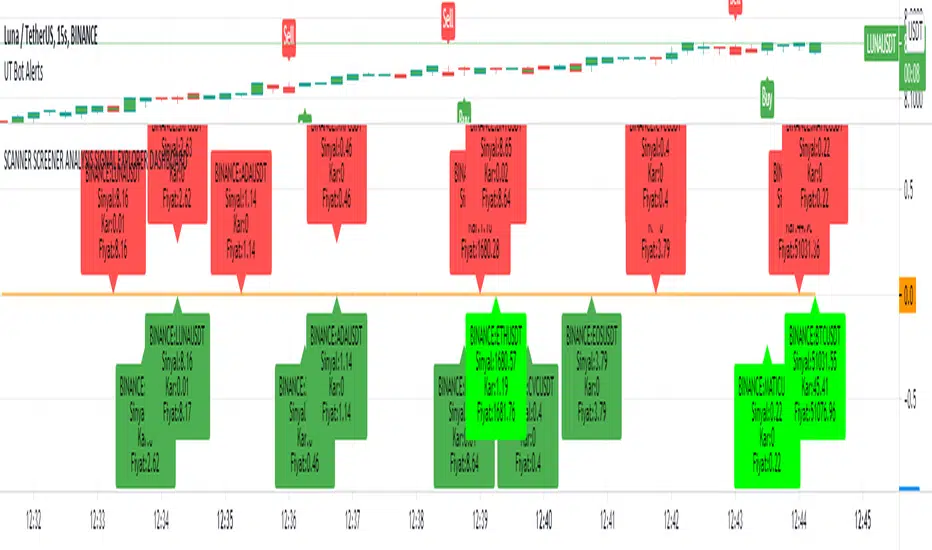
SCANNER SCREENER ANALYSIS SIGNAL EXPLORER DASHBOARDNew Buy signal: light green color
New Sell signal: light red color
Bullish dark green condition
Brearish dark red condition
Set your trend strategy in settings.
You can watch 20 pair in one indicator. Add more indicator panel and move same window and watch more signals in the same window. Set X axis cordinates 0-25-50-75-100-125-150-175-200 etc.for not overlap
You can add your favorite stocks, fx, crypto and analys for buy and sell signal.
When change the time frame new signal show on your selected time frame
it shows profit and signal price.
Look and review my other amazing indicator. It is best on TVs.
For Access and try my other best quality indicators till 7 days, message me. You can monthly subscribe my scripts my google play app on my profile or sent (30 USD) btc my bitcoin adress.
DeltalexИндикатор связывает спред (momentum=1) и объем. Если они большие на конкретном баре, то индикатор будет повышенным.
Также учитывается хвосты продаж и покупок. Например спред положительный, объем тоже, но хвост покупок составляет всего 10% от диапазона изменения цены на баре, тогда индикатор будет умножен на эти 10%, тем самым уменьшив его и показывая как бы, что да покупки есть но плохие.
Индикатор подкрашивается в зависимости от направления спреда, зелёный если momentum>1, красный если momentum<1
Скрип следует использовать с теорией VSA
Google translate:
The indicator connects spread (momentum = 1) and volume . If they are large on a particular bar, then the indicator will be raised.
The tails of sales and purchases are also taken into account. For example, the spread is positive, the volume is also, but the buy tail is only 10% of the price change range on the bar, then the indicator will be multiplied by these 10%, thereby decreasing it and showing, as it were, that there are but bad buys.
The indicator is colored depending on the direction of the spread, green if momentum> 1, red if momentum <1
Squeak should be used with VSA theory

Volume on bar VSA - signalЭтот индикатор сравнивает объем со средним его значением и обозначает бар в зависимости от того какой хвост на баре, бычий или медвежий.
В настройках можно задать сигнальную линию (чувствительность) для подкрашивания объемов, если он превышает эту линию. (на графике красная линия)
Сигнальная линия задаётся в процентах от среднего объема за указанный период.
Серым цветом показан средний объем.
Google translate.
This indicator compares the volume with its average value and designates a bar depending on which tail on the bar is bullish or bearish.
In the settings, you can set a signal line (sensitivity) for tinting volumes, if it exceeds this line. (red line on the chart)
The signal line is set as a percentage of the average volume for the specified period.
Gray indicates the average volume.

Volume on bar VSA - indicatorЭтот индикатор сравнивает объем со средним его значением и подкрашивает его в зависимости от того какой хвост на баре, бычий или медвежий.
В настройках можно задать сигнальную линию (чувствительность) для подкрашивания объемов, если он превышает эту линию. (на графике красная линия)
Сигнальная линия задаётся в процентах от среднего объема за указанный период.
Серым цветом показан средний объем.
Google translate
This indicator compares the volume with its average value and tints it depending on which tail on the bar is bullish or bearish.
In the settings, you can set a signal line (sensitivity) for tinting volumes, if it exceeds this line. (red line on the chart)
The signal line is set as a percentage of the average volume for the specified period.
Gray indicates the average volume.

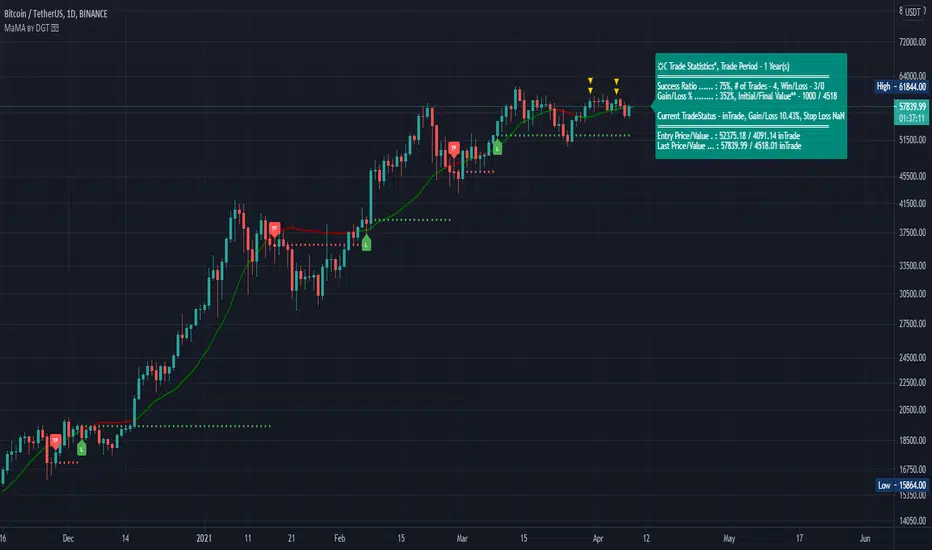
Momentum adjusted Moving Average by DGTA brand new Moving Average , calculated using Momentum, Acceleration and Probability (Psychological Effect).
Momentum adjusted Moving Average(MaMA) is an indicator that measures Price Action by taking into consideration not only Price movements but also its Momentum, Acceleration and Probability. MaMA, provides faster responses comparing to the regular Moving Average
Here is the math of the MaMA idea
Momentum measures change in price over a specified time period
momentum = source – source(length)
where,
source, indicates current bar’s price value
source(length), indicates historical price value of length bars earlier
Lets play with this formula and rewrite it by moving source(length) to other side of the equation
source = source(length) + momentum
to avoid confusion let’s call the source that we aim to predict as adjustedSource
adjustedSource = source(length) + momentum
looks nice the next value of source simply can be calculated by summing of historical value of the source value and value of the momentum. I wish it was so easy, the formula holds true only when the momentum is conserved/constant/steady but momentum move up or down with the price fluctuations (accelerating or decelerating)
Let’s add acceleration effects on our formula, where acceleration is change in momentum for a given length. Then the formula will become as (skipped proof part of acceleration effects, you may google for further details)
adjustedSource = source(length) + momentum + 1/2 * acceleration
here again the formula holds true when the acceleration is constant and once again it is not the case for trading, acceleration also changes with the price fluctuations
Then, how we can benefit from all of this, it has value yet requires additional approaches for better outcome
Let’s simulate behaviour with some predictive approach such as using probability (also known as psychological effect ), where probability is a measure for calculating the chances or the possibilities of the occurrence of a random event. As stated earlier above momentum and acceleration are changing with the price fluctuations, by using the probability approach we can add a predictive skill to determine the likelihood of momentum and acceleration changes (remember it is a predictive approach). With this approach, our equations can be expresses as follows
adjustedSource = source(length) + momentum * probability
adjustedSource = source(length) + ( momentum + 1/2 * acceleration ) * probability , with acceleration effect
Finally, we plot MaMA with the new predicted source adjustedSource, applying acceleration effect is made settable by the used from the dialog box, default value is true.
What to look for:
• Trend Identification
• Support and Resistance
• Price Crossovers
Recommended settings are applied as default settings, if you wish to change the length of the MaMA then you should also adjust length of Momentum (and/or Probability). For example for faster moving average such as 21 period it would be suggested to set momentum length to 13
Alternative usage , set moving average length to 1 and keep rest lengths with default values, it will produce a predictive price line based on momentum and probability. Experience acceleration factor by enabling and disabling it
Conclusion
MaMA provide an added level of confidence to a trading strategy and yet it is important to always be aware that it implements a predictive approach in a chaotic market use with caution just like with any indicator
Trading success is all about following your trading strategy and the indicators should fit within your trading strategy, and not to be traded upon solely
Disclaimer : The script is for informational and educational purposes only. Use of the script does not constitutes professional and/or financial advice. You alone the sole responsibility of evaluating the script output and risks associated with the use of the script. In exchange for using the script, you agree not to hold dgtrd TradingView user liable for any possible claim for damages arising from any decision you make based on use of the script
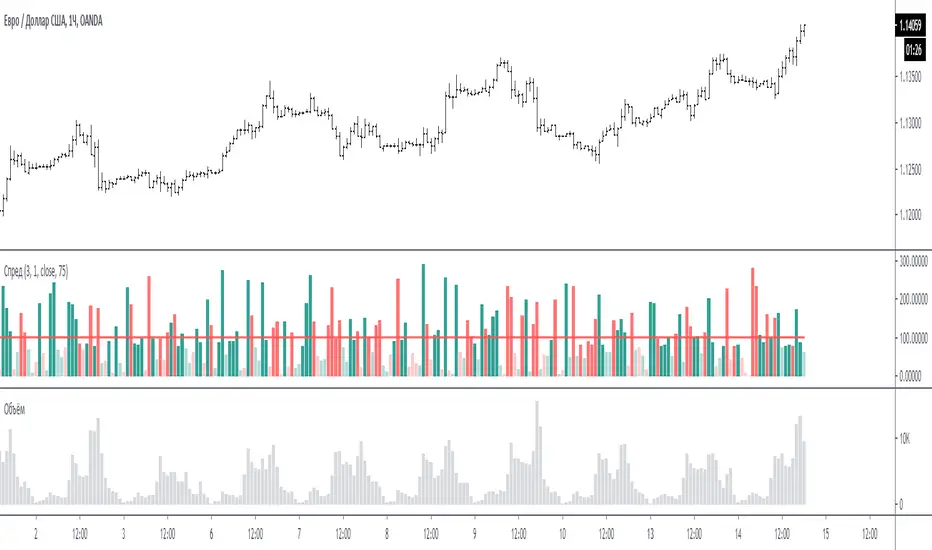
Spread for VSAЭтот индикатор сравнивает спрэд (расстояние от закрытия предыдущего бара до закрытия текущего бара или индикатор Momentum = 1) на периоде для сравнения.
На графике за 100 % принимается среднее значение спрэда за период для сравнения - красная линия. (по умолчанию период сравнения равен 3 - то есть три последних бара)
Размер бара на графике равен текущему спрэду по отношению к 100 %.
Если бар меньше 100 % то он ниже среднего, и наоборот если больше 100% то он больше среднего.
Если бар красный - спрэд отрицательный (текущее закрытие меньше предыдущего закрытия)
Если бар зелёный - спрэд положительный (текущее закрытие больше предыдущего закрытия)
Если бар меньше 75% то он будет окрашен в тусклый цвет (этот процент можно менять в настройках)
Если в настройках период спрэда указать больше 1, например 2, то спрэд будет равен закрытие мину закрытие через 1 бар назад. (это для экспериментов).
Примечание:
по умолчанию период для сравнения равен 3, но также интересен график и при значениях 15 и больше. Экспериментируйте.
По вопросам и предложениям пишите в комментариях.
Automatic translation google translate.
This indicator compares the spread (the distance from the closing of the previous bar to the closing of the current bar or the Momentum indicator = 1) on the period for comparison.
On the chart, the average spread value for the period for comparison is the red line, taken as 100%. (by default, the comparison period is 3 - that is, the last three bars)
The size of the bar on the chart is equal to the current spread with respect to 100%.
If the bar is less than 100%, then it is below average, and vice versa, if more than 100%, then it is more than average.
If the bar is red, the spread is negative (the current close is less than the previous close)
If the bar is green, the spread is positive (the current close is greater than the previous close)
If the bar is less than 75%, then it will be painted in a dull color (this percentage can be changed in the settings)
If in the settings the period of the spread is specified more than 1, for example 2, then the spread will be equal to closing mine closing after 1 bar back. (this is for experimentation).
Note:
the default period for comparison is 3, but the chart is also interesting for values of 15 or more. Experiment.
For questions and suggestions, write in the comments.
SOT INDICATOR for VSARussian language
SOT бар для VSA (Volume spread analysis)
Индикатор обозначает бары указывающие на остановку цены и возможный разворот.
Индикатор в первую очередь написан для таймфреймов от одного часа. На таймфреймах менее 1 часа сигнал будет приводить к неверным результатам, поскольку вечерние объемы существенно ниже дневных.
условие 1: закрытие текущего бара близко к закрытию предыдущего (достигается путём сравнения среднего диапазона последних 5 баров)
sma(high-close,5) - это средний диапазон за 5 баров
итого получается разница между закрытиями меньше 1/2 среднего диапазона за последние 5 баров.
Условие 2: должен быть хвост продаж или покупок (критерий - составляет не менее 2/3 от всего диапазона бара)
Условие 3: объемы должны быть увеличивающиеся (я взял, что текущей объем должен быть больше среднего за последние 5 баров)
Индикатор следует использовать совместно с теорией VSA.
English language (Google Translate)
SOT bar for VSA
The indicator indicates bars indicating a stop of the price and a possible reversal.
The indicator is primarily written for time frames from one hour. On time frames of less than 1 hour, the signal will lead to incorrect results, since evening volumes are significantly lower than daily volumes.
Condition 1: closing the current bar is close to closing the previous one (achieved by comparing the average range of the last 5 bars)
sma (high-close, 5) is the average range for 5 bars
total, the difference between closures is less than 1/2 of the average range for the last 5 bars.
Condition 2: there must be a tail of sales or purchases (the criterion is at least 2/3 of the entire range of the bar)
Condition 3: volumes must be increasing (I took that the current volume should be more than the average for the last 5 bars)
The indicator should be used in conjunction with VSA theory.

3 Bar Triangle Breakout////Current bar's High is less than the 3rd bar's High///
/// and Current bar's Low to be higher the 3rd bar's Low.////
////This then predicts the market might breakout to new levels ////
///within 2-3 of the next coming bars///
////Entry occurs when have two inside days and close break candle three high or low//
//If need more information recommend google search/////
I have coded when candle conducts breakout the formation above is the setup criteria !!

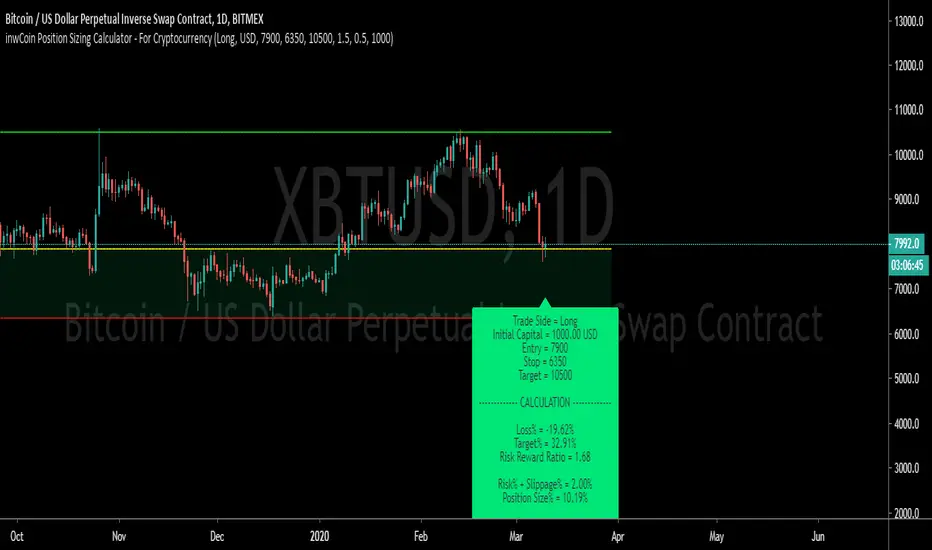
inwCoin Position Sizing Calculator - For CryptocurrencySimple study for calculate position sizing with define risk percent.
The goal of this study is to eliminate excel/google sheet calculation and we can just calculate proper position size within chart.
How to use
-------------
1) Specific your trade side ( Long or Short )
2) Define your Entry/Stop price. These values are important for position size calculation
3) Define your Target price, if you have one.
4) Define your risk percent per trade and some slippage + fee. Most top traders are recommend 2% risk per trade. And maximum risk is 6% per month/per concurrent positions.
5) Define your initial capital ( your money in portfolio )
Optional
-------------
- Specific currency type for display purpose.
How to read the result
-------------
1) Position Size will tell you how big your position size per trade that match your specific risk percent.
2) You can check Risk-Reward ratio ( RRR ) to see if this trade is a good one or not, the Gurus are recommend RRR = 1.5 - 2.0 to win in a long run.
3) You can check your profit target and profit % per your capital if the target reach. Also you can check how much profit amount you'll get if target reach.