kyle algo v1
Integration of multiple technical indicators: The strategy mainly combines two technical indicators - Keltner Channels and Supertrend, to generate trading signals. It also calculates fifteen exponential moving averages (EMAs) for the high price with different periods ranging from 9 to 51.
Unique combination of indicators: The traditional Supertrend typically uses Average True Range (ATR) to calculate its upper and lower bands. In contrast, this script modifies the approach to use Keltner Channels instead.
Flexible sensitivity adjustment: This strategy provides a "sensitivity" input parameter for users to adjust, which controls the multiplier for the range in the Supertrend calculation. This can make the signals more or less sensitive to price changes, allowing users to tailor the strategy to their own risk tolerance and trading style.
EMA Energy Representation: The code offers a visualization of "EMA Energy", which color-codes the EMA lines based on whether the closing price is above or below the EMA line. This can provide an intuitive understanding of market trends.
Clear visual signals: The strategy generates clear "BUY" and "SELL" signals, represented as labels on the chart. This makes it easy to identify potential entry and exit points in the market.
Customizable: The script provides several user inputs, making it possible to fine-tune the strategy according to different market conditions and individual trading preferences.
EMA (Exponential Moving Average) Principle:
The EMA is a type of moving average that assigns more weight to the most recent data.
It responds more quickly to recent price changes and is used to capture short-term price trends.
Principle of Color Change :
In this trading strategy, the color of the EMA line changes based on whether the closing price is above or below the EMA. If the closing price is above the EMA, the EMA line turns green,
indicating an upward price trend. Conversely, if the closing price is below the EMA, the EMA line turns red,
indicating a downward price trend. These color changes help traders to more intuitively identify price trends
In short, our team provides a lot of practical space
That is your development space
Cerca negli script per "KELTNER"

MyVolatilityBandsLibrary "MyVolatilityBands"
Just a lil' library of volatility bands that I use in some scripts
bollingerbands(src, lkbk, mult, basis)
Bollinger Bands
Parameters:
src (float) : float
lkbk (int) : int
mult (float) : float
basis (float)
Returns: Bollinger Bands
donchianchannels(src, lkbk, band_width)
Donchian Channels
Parameters:
src (float) : float
lkbk (int) : int
band_width (float) : float
Returns: Donchian Channels with an outer band of varying thickness adjusted by the band_width input
doublehalfdonchianchannels(src, lkbk, divisor)
Double Half Donchian Channels
Parameters:
src (float) : float
lkbk (int) : int
divisor (float) : float
Returns: two adjustable bases calculated using Donchian Channels calculation that act as a measure of volatility

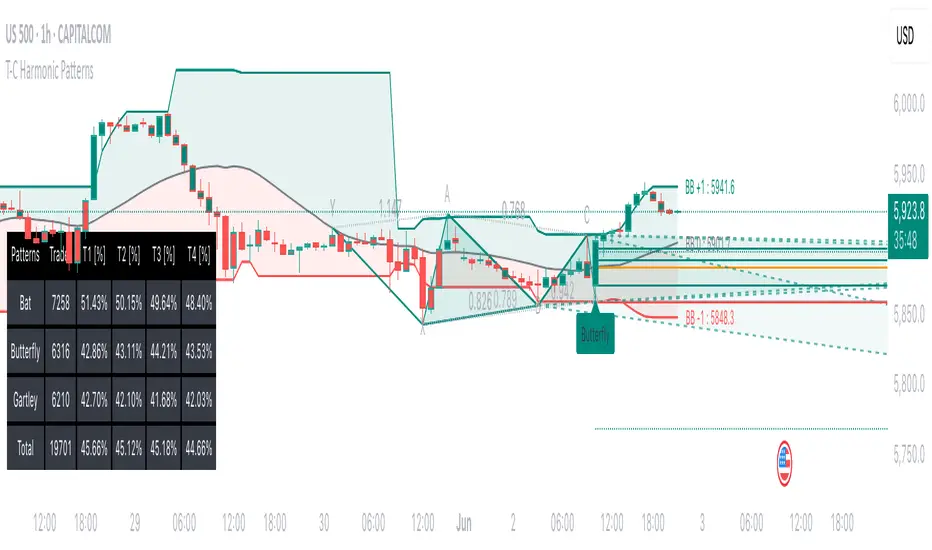
Tailored-Custom Hamonic Patterns█ OVERVIEW
We have included by default 3 known Patterns. The Bat, the Butterfly and the Gartley. But have you ever wondered how effective other,
not yet known models could be? Don't ask yourself the question anymore, it's time to find out for yourself! You have the option to customize
your own Patterns with the Backtesting tool and set Retracement Ratios and Targets for your own Patterns. In addition to this, in order to determine
the Trend at a glance and make Pattern detection more efficient, we have linked the calculation of Patterns to Bands of several types to choose
from (Bollinger, Keltner, Donchian) that you can select from a drop-down menu in the settings and play with the Multiplier
and the Adaptive Length of the Patterns to see how it affects the success rate in the Backtesting table.
█ HOW DOES IT WORK?
- Harmonic Patterns
-Pattern Names, Colors, Style etc… Everything is customizable.
-Dynamic Adaptative Length with Min/Max Length.
- XAB/ABC Ratio
-Min/Max XAB/ABC Configurable Ratio for each Pattern to create your own Patterns.
(This is really the particular option of this Indicator, because it allows you to be able to Backtest in real time
after having played at configuring your own Ratios)
- Bands
-Contrary to the original logic of the HeWhoMustNotBeNamed script, here when the price breaks out of the upper Bands
(example, Bollinger band, Keltner Channel or Donchian Channel) , with a predetermined Minimum and Maximum Length and Multiplier, we can consider
the Trend to be Bearish (and not Bullish) and similarly when the price breaks down in the lower band, we can consider the Trend
to be Bullish (not Bearish) . We have also added the middle line of the Channels (which can be useful for 'Scalper' type Traders.
-The Length of the Bands Filter is directly related to the Dynamic Length of the Patterns.
-You can use a drop-down menu to select from the following Bands Filters :
SMA, EMA, HMA, RMA, WMA, VWMA, HIGH/LOW, LINREG, MEDIAN.
-Sticky and Adaptive Bands options has been included.
- Projections
-BD/CD Projection Ratio configurable for each Pattern.
(Projections are visible as Dotted Lines which we can choose to Extend or not)
- Targets
-Target, PRZ and Stop Levels are set to optimal values based on individual Patterns. (The PRZ Level corresponds to point D
of the detected Pattern so its value should always be 0) but you can change the Targets value (defined in %) as you wish.
Again here, you have the option to fully configure the Style and Extend the Lines or not.
- Backtesting Table
-As said previously, with the possibility of testing the Success Rate of each of the 3 Customizable Patterns,
this option is part of the logic of this Indicator.
- Alerts
-We originally believe that this Indicator does not even need Alerts. But we still decided to include at least one Alert
that you can set for when a new Pattern is detected.
█ NOTES
Thanks to HeWhoMustNotBeNamed for his permission to reuse some part of his zigzag scripts.
Remember to only make a decision once you are sure of your analysis. Good trading sessions to everyone and don't forget,
risk management remains the most important!
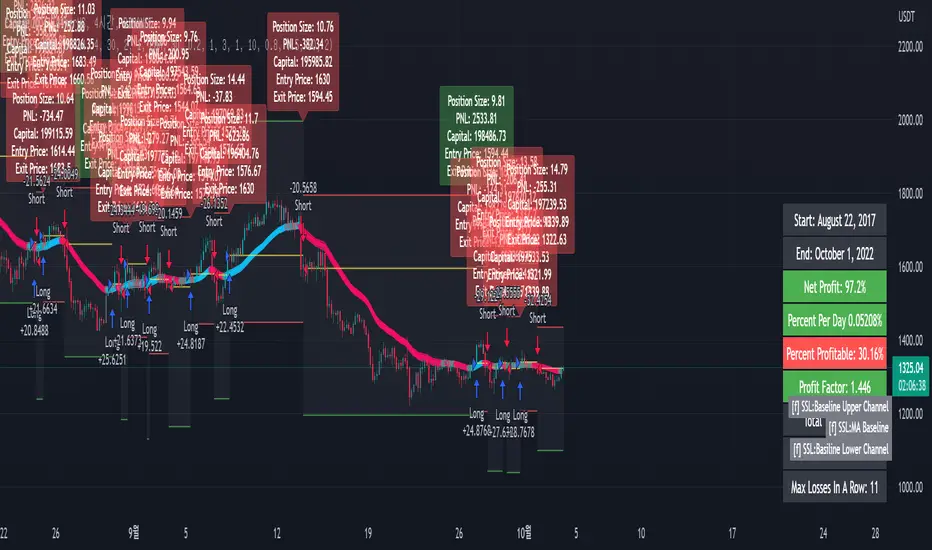
[fpemehd] SSL Baseline StrategyHello Guys! Nice to meet you all!
This is my third script!
This Logic is trend following logic, This detects long & short trends based on SSL Hybrid Baseline.
This fits to the longer time frame like 4hr and 1d.
### Long Condition
1. close > SSL Hybrid baseline upper k
- Baseline is the ma of close price. (You can choose ma type and length)
- Upper k is the upper Keltner Channel.
### Short Condition
1. close < SSL Hybrid baseline lower k
- Baseline is the ma of close price. (You can choose ma type and length)
- Lower k is the lower Keltner Channel.
### Etc
1. Added Stoploss based on highest high or lowest low with lookback.
2. Strategy Template is based on @kevinmck100 template. Thank you!
Relative Andean ScalpingThis is an experimental signal providing script for scalper that uses 2 of open source indicators.
First one provides the signals for us called Andean Oscillator by @alexgrover . We use it to create long signals when bull line crosses over signal line while being above the bear line. And reverse is true for shorts where bear line crosses over signal line while being above bull line.
Second one is used for filtering out low volatility areas thanks to great idea by @HeWhoMustNotBeNamed called Relative Bandwidth Filter . We use it to filter out signals and create signals only when the Relative Bandwith Line below middle line.
The default values for both indicators changed a bit, especially used linreg values to create relatively better signals. These can be changed in settings. Please be aware that i did not do extensive testing with this indicator in different market conditions so it should be used with caution.

All-in-one CPR indicator Introduction and Acknowledgement:
The script is basically a mashup script and provides a combined functionality of various indicators. I'll explain the usefulness and the optimal usage of the script after giving the credits where it is due. A CPR indicator for visually identifying the trend along with the strength of the trend is NOT available in the public library of TradingView. Hence, the need of this indicator.
The credit of creating the original indicators remain unknown to me but I would like to acknowledge the authors whose formulae and codes I have used for creating this mashup indicator.
- Frank Ochoa
- Guruprasad Meduri
- Rafael Zioni
- Stoked Stocks
- Pine team for default indicators
The prime focus of the script is identifying and simplifying the 2 main aspects of a trend:
1. Direction / Underlying trend
2. Strength of the trend
Flaws in traditional CPR:
Some may see this as a flaw, some may not. So take my opinion with a grain of salt. In general, the traditional CPR indicator is used to plot just support and resistance levels, and the trend identification is purely discretionary. In addition to this, there is no way to assess the strength of the move without using a dedicated volumed based indicator. This causes amateur traders to take counter trades to the market direction.
What is the need of this hybrid indicator?
A CPR indicator that also aids in visually identifying the trend and the strength of the trend with respect to the price action in NOT available in the public library of TradingView. The traditional CPR can be used to assess the rough direction of the market but if it combined with the Hull ribbon, the probability of identifying the trend increases manifold. Hence, I decided to create this mashup indicator.
In addition to the basic CPR pivots, the script provides the functionality of the following indicators:
1. HMA based trend ribbons with auto buy/sell signals
2. Volatility based bands - Bollinger bands, Keltner channel, Donchian channel, envelope.
3. Coloured volume candles to determine the strength of the trend
4. CPR with daily, weekly, and monthly levels
5. Previous day high/low
6. Tomorrow CPR
7. 3 Simple moving averages
8. Volume Weighted Average Price (VWAP)
Correct usage of the indicator:
The optimal usage of the indicators consists of mainly 2 parts:
1. Identification of the trend using the combination of CPR and Hull ribbon
2. Determining the strength of the trend
How to identify the trend?
In general, when the price is above CPR it is considered a bullish trend. Also, when the price is above the Hull ribbon, it is considered bullish. Reverse is true for a bearish trend. Combining the traditional CPR logic with the Hull trend ribbon, we can conclude that:
1. Bullish trend = Price above CPR and above the Hull ribbon
2. Bearish trend = Price below CPR and below the Hull ribbon
If the Hull ribbon is showing a zig-zag move, the trend will be sideways. Also, the time frame of the Hull ribbon can be defined as per the need of the user.
Exhibit: Identification of a bullish trend
Exhibit: Identification of a bullish trend with a contra move (pullback)
Exhibit: Identification of a bearish trend
Exhibit: Identification of a bearish trend with a contra move (pullback)
How to determine the strength of the trend?
1. Strong trend = The dark coloured candles represent volume more than 150% of the look back period. For instance
2. Moderate trend = The bright coloured candles represent volume between 50-150%.
3. Neutral trend = The Grey coloured candles represent a weak trend where the volume is less than 50%.
Exhibit: Identification of a strong bearish trend along with the trend direction
Exhibit: Identification of a strong bullish trend using only coloured candles
All the other indicators including the SMA, VWAP, Bollinger bands, Keltner channels, etc. can be used as per the taste of the trader.
Thanks for reading! I hope you find this indicator useful.
Happy learning. Cheers!
Rajat Kumar Singh (@johntradingwick)
Community Manager (India), TradingView

IsPullbackPivotRetested experimentThe indicator counts how often a pullback that starts outside the Keltner Channel resolves or fails.
Resolves: the pullback high or low is retested.
Fails: price goes outside the oppositie side of the Keltner Channel.

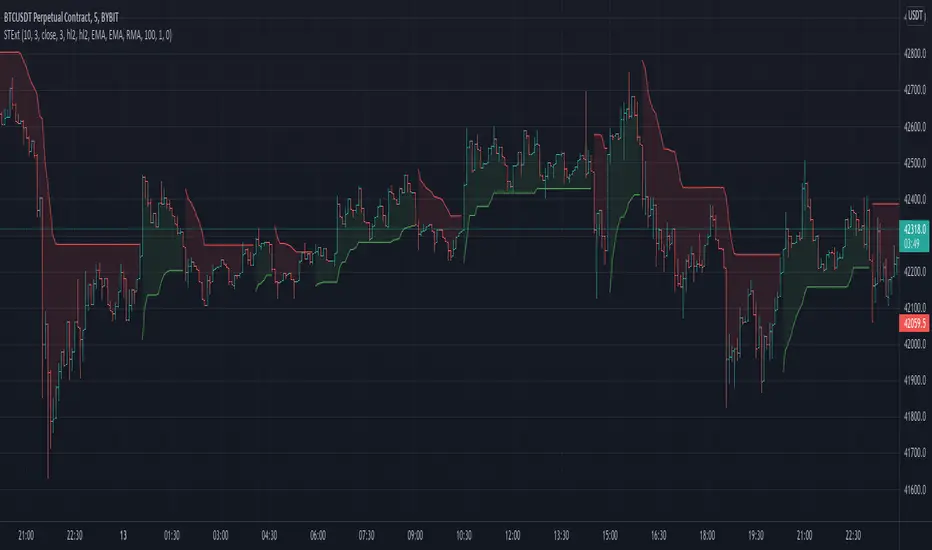
Supertrend Ext1st it exactly looks like the original Supertrend indicator. But if you see the options, you can see it is totally different:
It uses my other indicator inside: Zero Lag Keltner Channels, so you can use smoothed ATR bands for calculation instead of the raw ATR. By default it's length is 1 so it works like the original Supertrend.
You can choose different sources and moving averages for Keltner Channel calculation
It can filter outliers in ATR calculation
The indicator code is in my TAExt library, so it can easily be used in custom strategies.
Trading Made Easy ATR BandsAs always, this is not financial advice and use at your own risk. Trading is risky and can cost you significant sums of money if you are not careful. Make sure you always have a proper entry and exit plan that includes defining your risk before you enter a trade.
Background:
This is my take on two relatively famous indicators that paint the colour of your candles in order to help identify trend direction and smooth out market noise. The Elder Impulse System was designed by Dr . Alexander Elder in his book Come Into My Trading Room and attempts to identify the change of trends and when these trends speed up and slow down (school.stockcharts.com). The system used a 13 period EMA and a MACD histogram, and compared each of these indicators to the previous period. In short, when both the histogram and the EMA were rising, the trend was accelerating to the upside and when both were falling, accelerating to the downside. Conversely, when the indicators were not in alignment, say the MACD falling but the EMA rising, it signaled a slowing down of momentum. The downside of this indicator is that it be can rather jumpy, focusing on a short period EMA for 50% of its calculation, leaving a trader to potentially sit on the sidelines during opportune pull backs to enter winning positions, or exit early when there is still a lot of gas left in the tank.
A similar concept has been employed by John Carter and his organization, SimplerTrading, with the 10X bars indicator. However, here they use the famous Directional Movement Index (DMI) created by J. Welles Wilder as the basis for their bars (www.simplertrading.com). John Carter states that the use of this indicator can lead to getting in earlier on more, bigger, and faster setups. The downside of this indicator is the reliance on the ADX calculations to keep you out of rangebound trades. Anyone who is familiar with the DMI system understands it has unparalleled ability to identify longer term trends, but it is also quite slow, leaving the trader to miss a good portion of the initial runup due to this ADX portion that is very slow to get moving and also slow to signal exits.
In short, both of these systems are designed with one thing in mind: keeping the trader on the right side of the move --- but both suffer from the same issue but on opposite sides of the spectrum. One is too fast and the other is too slow. Ultimately, leaving profits on the table for the trader when such a situation could be avoided.
Here I present my own take on these and have made the “Trading Made Easy ATR Bands”. I name it this because trading is much easier when you trade with the prevailing trend, and this system identifies these periods quite effectively while doing a better job of handling the speed flux of most markets. The base formula uses the DMI as its main calculation and the relationship between the DMI+ and DMI- lines, respectively, like the 10X bars. While the trader can investigate these on their own to understand these more intimately, essentially the DMI+ and DMI- lines are calculating the highs and lows respectively of each bar compared to a period in the past and smoothed with the true range, a measurement of volatility . What this ultimately presents is a picture of uptrends and downtrends, where price is making consistently more highs or more lows over a period of time. Where I have modified this relative to the 10X bars is I have ignored the ADX calculations. Further, values over 25 have been discussed as “strong” momentum, in my calculations, I have sped this up to 20 to get a trader into the move earlier. Second, I have added an additional calculation based around the 21-period exponential moving average calculated against its previous output. This then, like the Elder Impulse System, has two forms of market momentum as its calculation to smooth out noise, but has the benefit of being less jumpy, like the original 10X bar system. I have added a series of exponential moving averages following the Fibonacci sequence from 8-144 as a system of dynamic support and resistance showing the sentiment of both the shorter and longer term market participants. Last, I have added a series of Keltner Channels , from 1X-4X, that encompass the 21 period EMA as a base line. The 21 EMA is a stable in all of John Carter’s work and I do believe he is correct that the market is mostly structured around this line, since it roughly approximates one month of trading data. It is not uncommon to see price expand and contract back to this line over and over again.
Trade Signals:
Strong Bullish Momentum – The system will generate a green bar when the DMI+ line is over the DMI- line, the DMI+ line is equal or greater than 20 and the 21 EMA has increased relative to its last close.
Weak Bullish Momentum – The system will generate a blue bar in several scenarios. First, when the DMI+ line is over the DMI- line but the DMI+ line is not over 20 and the EMA is equal or less than the previous close. It will also print a blue bar if either the DMI or the EMA are not aligned, such as the DMI+ is over the DMI- but not over 20 but the EMA has risen compared to the last bar. Last, it will also print a blue bar if the DMI- is over the DMI+ but the EMA is rising.
Strong Bearish Momentum – The system will generate a red bar when the DMI- line is over the DMI+ line, the DMI- line is equal or greater than 20, and the 21 EMA has fallen relative to its last close.
Weak Bearish Momentum – The system will generate an orange bar in several scenarios. First when the DMI- line is over the DMI+ line but the DMI- line is not over 20 and the EMA is equal or greater than the last bar. It will also print an orange bar if either the DMI or the EMA are not aligned, such as the DMI- is over the DMI+ but not over 20 but the EMA has fallen. Lastly, it will also print an orange bar if the DMI+ line is over the DMI- and the EMA has fallen relative to the last bar.
Uses:
1) Like the Elder Impulse System and 10X Bar systems, these should be used as trade filters only.. It is in the trader’s best interest to trade with the trends and these bars identify these periods but may not always generate the most opportune time to enter a market. For instance, trying to short a market when the market is in a phase of Strong Bullish Momentum would not be wise, and vice versa with trying to open long positions when the market is exhibiting Strong Bearish Momentum. Use multiple forms of evidence to confirm the signals shown before entering any trade and to not take these signals on their without confluence of ideas. A viable system could use the Elder Triple Screen System (for reference, see this decent write up --- www.dailyforex.com) with the Trading Made Easy Bands as your “Tide” or longer term filter, and a further trading plan to establish an entry on a short time frame pull back.
2) Interim Trend Exhaustion – Keltner channels work as moving standard deviations from the 21 EMA . 3X multipliers will encompass 99.7% of price and 4X will encompass 99.9% of price away from the 21 EMA . During a trend it would be a good idea to lock in partial profits when price reaches these outer extrema as it is very highly probable that a retracement back to the mean is approaching. While not part of the system, and not recommended to be used by this system, a mean reversion trader could in theory look for reversals at these extrema points and trade a mean reversion strategy back to the 21EMA, but is a much riskier trade with lower probability of success. A trend trader should look to enter trades when a signal is given within the 1ATR or 2ATR zone as this is when price has not really started accelerating yet and is likely to see continued momentum in that direction.

+ Ultimate MAWhat is the "Ultimate MA" exactly, you ask? Simple. It actually takes as its influence the Rex Dog Moving Average (which I have included as an MA in some of my other indicators), an invention by xkavalis that is simply an average of different length moving averages.
It's available for free on his account, so take a look at it.
I've recently become drawn to using fibonacci sequence numbers as lookbacks for moving averages, and they work really well (I'm honestly beginning to think the number doesn't matter).
You can see where this is going. The Ultimate MA is an average of several (eight) moving averages of varying lengths (5 - 144) all of fibonacci numbers. Sounds pretty basic, right? That's not actually the case, however.
If you were to take all these numbers, add them up, then average them by eight you'd get ~46. Now, stick a 46 period moving average on the chart and compare it to this one and see what you get. They track price very differently. Still, this all sort of sounds like I'm copying the RDMA, which isn't a sin in itself but is hardly grounds for releasing a new MA into the wild.
The actual initial problem I wanted to tackle was how to take in to account for the entire range of price action in a candle in a moving average. ohlc4 sort of does this, but it's still just one line that is an average of all these prices, and I thought there might be a better way not claiming that what I came upon is, but I like it).
My solution was to plot two moving averages: one an average of price highs, and the other an average of lows, thus creating a high/low price channel. Perhaps this is not a new thing at all. I don't know. This is just an idea I had that I figured I could implement easily enough.
Originally I had just applied this to a 21 period EMA, but then the idea sort of expanded into what you see here. I kept thinking "is 21 the best?" What about faster or slower? Then I thought about the RDMA and decided on this implimentation.
Further, I take the high and low moving averages and divide them by two in order to get a basis. You can turn all this stuff on or off, though I do like the default settings.
After that I wanted to add bands to it to measure volatility. There is an RDMA version that utilizes ATR bands, but I could never find myself happy with these.
I just wanted something... else. I also, actually made my own version of xkavalis' RDMA bands with some of the extra stuff I included here, but obviously didn't feel comfortable releasing it as an indicator as I hadn't changed it enough significantly in my mind to fairly do so. I eventually settled on Bollinger Bands as an appropriate solution to apply to the situation. I really like them. It took some fiddling because I had to create a standard deviation for both the high and low MAs instead of just one, and then figure out the best combination of moving averages and standard deviations to add and subtract to get the bands right.
Then I decided I wanted to add a few different moving averages to choose from instead of just an EMA even though I think it's the "best." I didn't want to make things too complicated, so I just went with the standards--EMA, SMA, WMA, HMA-- + 1, the ALMA (which gives some adjustability with its offset and sigma).
Also, you can run more than one moving average at a time (try running an HMA with a slower one).
Oh yeah, the bands? You can set them, in a dropdown box, to be based on which ever moving average you want.
Furthermore, this is a multi-timeframe indicator, so if you want to run it on a higher time frame than the one you are trading on, it's great for that.
ALSO, I actually have the basis color setup as multi-timeframe. What this means is that if you are looking at an hourly chart, you can set the color to a 4h (or higher) chart if you want, and if the current candle is above or below the previous close of the basis on that higher timeframe you will know simply by looking at the color of it ((while still being on the hourly chart). It's just a different way of utilizing higher timeframe information, but without the indicator itself plotted as higher timeframe.
I'm nearly finished. Almost last thing is a 233 period moving average. It's plotted as an average of the SMA, EMA, and Kijun-sen.
Lastly, there are alerts for price crossing the inner border of the bands, or the 233 MA.
Below is a zoomed in look at a chart.
Much credit and gratitude to xkavalis for coming up with the idea of an average of moving averages.
Kirill ChannelThis indicator shows overbought and oversold zones. Can be used on all time frames. I personally use 15m - 30m.
How to apply ?:
- There can be many strategies for use! I use this indicator to buy an asset in the green zone and then sell it in the middle of the channel or in the red zone.
- I strongly advise against entering counter-trend positions in a growing market if you have little trading experience and understanding of price action.
How do I place orders ?:
- I place orders in a grid.
- If the price is very close to the edge, but it is difficult to reach it, then it is better to open a position on the market and place orders deep into the grid.
- If the price is at the edge of the channel for a very long time, then you need to look at a higher timeframe.
Algorithm composition:
- ALMA
- Keltner Channel
- Fibonacci Retracement
- Custom price percent offset calculations and manipulations.
Settings:
- I strongly do not recommend changing ALMA. These numbers have been specially calculated.
- It's better not to change Borders either. The current algorithm dynamically changes the width of the extreme channels depending on the price movement.
- The Keltner Channel was specially selected.
- Fibonacci Retracement can be changed. This part of the algorithm can be modified to suit your needs. At the moment, there are settings for aggressive trading.
Channel type:
- Conservative: Fibonacci Retracement settings (100 ma, 100 atr, 8 mult, 100 smooth)
- Aggressive: Fibonacci Retracement settings (25 ma, 25 atr, 3.5 mult, 100 smooth)
Сonservative channel does not allow a large number of points to enter positions, however, it is more straightforward and safer for very large movements.
I prefer aggressive settings because they allow me to make more profit on the number of trades.
Try to use both modes and choose what is preferable for you.

supertrendHere is an extensive library on different variations of supertrend.
Library "supertrend"
supertrend : Library dedicated to different variations of supertrend
supertrend_atr(length, multiplier, atrMaType, source, highSource, lowSource, waitForClose, delayed) supertrend_atr: Simple supertrend based on atr but also takes into consideration of custom MA Type, sources
Parameters:
length : : ATR Length
multiplier : : ATR Multiplier
atrMaType : : Moving Average type for ATR calculation. This can be sma, ema, hma, rma, wma, vwma, swma
source : : Default is close. Can Chose custom source
highSource : : Default is high. Can also use close price for both high and low source
lowSource : : Default is low. Can also use close price for both high and low source
waitForClose : : Considers source for direction change crossover if checked. Else, uses highSource and lowSource.
delayed : : if set to true lags supertrend atr stop based on target levels.
Returns: dir : Supertrend direction
supertrend : BuyStop if direction is 1 else SellStop
supertrend_bands(bandType, maType, length, multiplier, source, highSource, lowSource, waitForClose, useTrueRange, useAlternateSource, alternateSource, sticky) supertrend_bands: Simple supertrend based on atr but also takes into consideration of custom MA Type, sources
Parameters:
bandType : : Type of band used - can be bb, kc or dc
maType : : Moving Average type for Bands. This can be sma, ema, hma, rma, wma, vwma, swma
length : : Band Length
multiplier : : Std deviation or ATR multiplier for Bollinger Bands and Keltner Channel
source : : Default is close. Can Chose custom source
highSource : : Default is high. Can also use close price for both high and low source
lowSource : : Default is low. Can also use close price for both high and low source
waitForClose : : Considers source for direction change crossover if checked. Else, uses highSource and lowSource.
useTrueRange : : Used for Keltner channel. If set to false, then high-low is used as range instead of true range
useAlternateSource : - Custom source is used for Donchian Chanbel only if useAlternateSource is set to true
alternateSource : - Custom source for Donchian channel
sticky : : if set to true borders change only when price is beyond borders.
Returns: dir : Supertrend direction
supertrend : BuyStop if direction is 1 else SellStop
supertrend_zigzag(length, history, useAlternateSource, alternateSource, source, highSource, lowSource, waitForClose, atrlength, multiplier, atrMaType) supertrend_zigzag: Zigzag pivot based supertrend
Parameters:
length : : Zigzag Length
history : : number of historical pivots to consider
useAlternateSource : - Custom source is used for Zigzag only if useAlternateSource is set to true
alternateSource : - Custom source for Zigzag
source : : Default is close. Can Chose custom source
highSource : : Default is high. Can also use close price for both high and low source
lowSource : : Default is low. Can also use close price for both high and low source
waitForClose : : Considers source for direction change crossover if checked. Else, uses highSource and lowSource.
atrlength : : ATR Length
multiplier : : ATR Multiplier
atrMaType : : Moving Average type for ATR calculation. This can be sma, ema, hma, rma, wma, vwma, swma
Returns: dir : Supertrend direction
supertrend : BuyStop if direction is 1 else SellStop
KayeDinero TrendSetter HFX NFXThis script combines my volume and trend indicators with an added flare.
The mindset for this strategy is a trending market, where price is moving in a consistent direction with some reversals.
The most unique concept of this script is the background calculator (divergent). This is different from other scripts on the platform because of the close tie in with the relative strength index as well as the on balance volume. The divergent lets you know of overbought and oversold conditions.
Another unique take, is the use of the Keltner Channels, which provides insight on volatility.
Best Traded during Hours 3am to 12am EST (NY Time).
This method works best in trending markets.
Time Frame, 1,3,5,15,30min
Currency Pairs: All Major, Exotic, Crypto
Here's The Strategy:
Oversold and Buy: When those are present, proceed to take a buy (call) option.
Overbought and Sell: When those are present, proceed to take a sell (put) option.
Keep in mind, timeframe will depend on your time of trading in the markets.
Morning typically 2-4min
Afternoon / Evening: 3-5min
Hint:
Best Trades on reversals at top and bottom of Keltner Channels.

+ ALMA Trend DetectorHi, again. Here I have a nice moving average script designed to get you into trends and keep you in trends until the opportune moment comes to exit. And, as with any indicator, or suite of indicators, designed to get one into trends and keep him/her in a trend, they do not do so well in chop/ranging/mean reversion conditions, though I would say this one is better than most, otherwise I wouldn’t be fitting it into my trading system.
This is a huge improvement, in my opinion, over an indicator I found recently, and like quite a bit by samsmilesam, which you can find here: www.tradingview.com
In this adaptation of his script I changed a bunch of things, but kept the spirit of the indicator true.
This indicator utilizes three different length Arnaud Legoux moving averages, known for being extremely low lag, and incredibly adjustable (though I find the original authors settings excellent).
While he has buy and sell signals triggering regardless of the fast and slow ma’s position to the trending ma, I actually take the trending ma into account. Furthermore, I wouldn’t say I coded in signals indicating buying and selling, but that I coded in signs that answer the question “what kind of trend are we in?” as well as possible ideal trade exits (which couuuuuld also be taken as entries, but aren’t necessarily meant to).
So, the deets on this:
1) 5 period, 20 period, and 70 period ALMAs. Fast, slow and trend. All customizable independent of each other (unlike the sam’s). All three also change color based on their own individual trends.
2) Uptrends are identified when price is closing above the Trend ma, and both Fast and Slow ma’s are above the Trend ma, and vice versa for downtrends. There are in-between points when a trend is not identified, and this is when price closes above or below the Trend ma, but the other two ma’s have not crossed it. Background color is used to identify the trend.
3) Trade exits are based on closing price and Fast and Slow ma’s relative to the Trend ma, once again. To signal exiting an uptrend price must close below both Fast and Slow ma’s and both Fast and Slow ma’s must be above the Trend ma; and vice versa for exiting a down trend. Obviously there may be false signals, but there are fewer signals, and I think it’s a better strategy than most. I prefer to filter out as much noise as possible. There’s little worse in my opinion than an indicator that gives too many false signals, but obviously it’s impossible to remove them all. Some discretion is necessary on the part of the trader.
4) So what does this mean for trade entries? Well, you can certainly enter a trade on a signal for an exit (go long on a short exit signal) if the chart looks good for that. Or you can wait for trend confirmation with the background color, entering on a pullback to the ma’s perhaps. Or you can enter in the “no man’s land” in between trends. If you’ve exited and price continues on trending your best bet would be to wait for a pullback into the ma’s or a s/r level, or look for the next candle that closes beyond the Fast and Slow ma’s. These are just thoughts of mine.
5) Lastly, there are alert conditions set for uptrends, downtrends and both long and short exits!
Enjoy the indicator! I think with some sort of bands or channels for those times when the market is rangebound or in chop, you could really crush it with this.

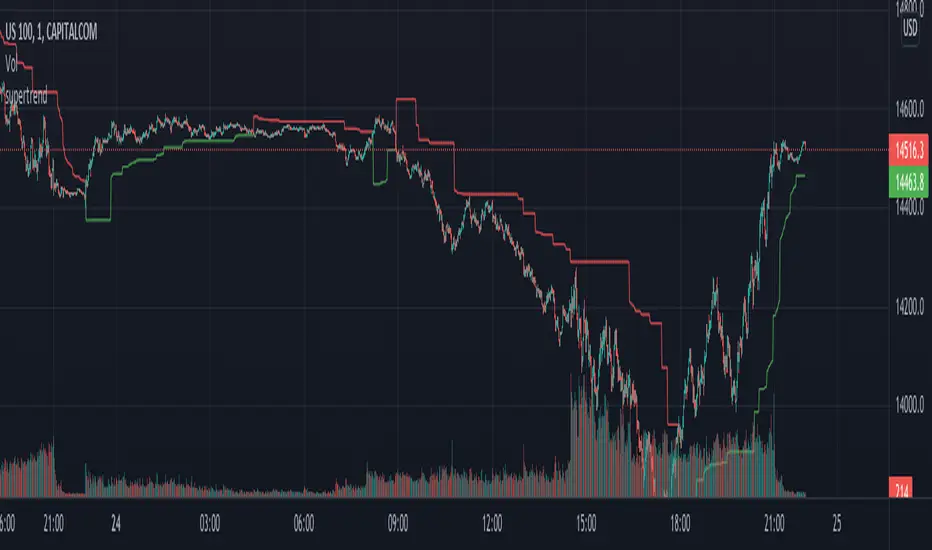
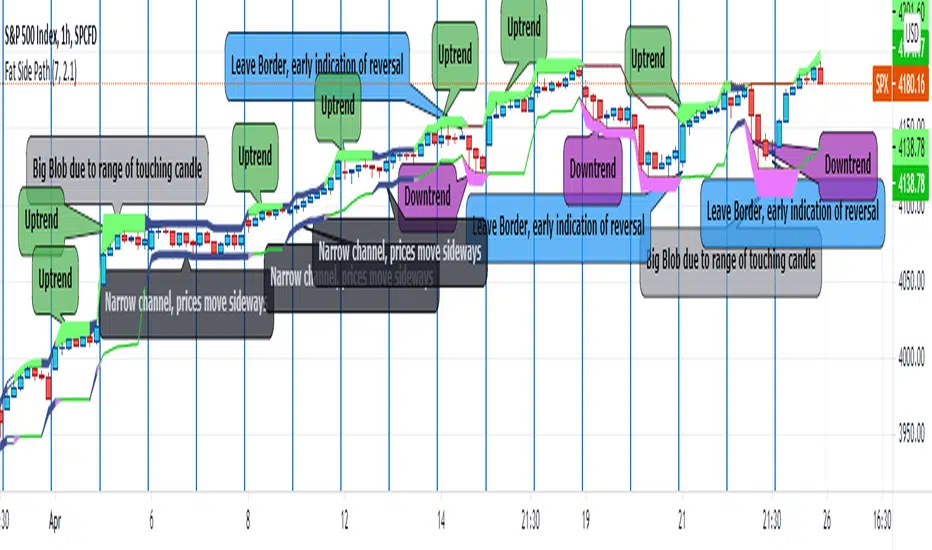
Fat Side PathI got the idea for a narrow Donchian Channel with a short lookback period which closely follows the price fluctuation in which the sides of the channel have a thickness according to the range of the last touching candle.
Any channel, be it Donchian, Keltner, Bollinger Bands or Parallel, has an upside and a downside, touching the upside is a buy signal as this may initiate an uptrend, the downside a sell signal because a down trend may come.
This gave me the idea to make only the last touched side fat, thus creating visible switching between uptrend and downtrend. However this is ‘too digital’, as in practice also periods of no trend occur in which signaling a trend would give a false signal. In a Donchian channel (and also Bollinger Bands) such periods are marked by narrowing the channel. So I gave a no trend signal to the sides when the channel is narrower than a minimum width to call a trend. I gave the thing nice colours and proper default settings.
Use of the channel in trading.
I think this thing can be useful for swing trading. In channels two typical things may happen that should be noted by the trader, these are LB, Leaving the Border, which signals a trend reversal and FTT, Failure To Traverse, i.e. the price doesn’t manage to cross the channel to the other side. This affirms the trend. FTT’s are not expected in short lookback channels like this path (Sidenote: Fibonacci levels can be regarded as predictions where FTT’s may occur). The fat side indicates direction. Because somehow trends seem to end with a notable range extension, this channel sometimes produces a “Big Blob” where the trend reverses.
I intend to use this thing together with my Keltner Fibzones channel, where the zones serve as a ‘landscape’ in which the Fat Side Path meanders providing ‘comments’ on the short term price movements.
Arah LilinThis indicator is made to see the trend of candle movement.
there are three lines namely top, middle, and bottom.
the top and bottom lines are made using the Keltner channel indicator and the middle line is made using the exponential moving average indicator.
there is a forecast point for the midline to determine the future movement of the candle.
however, it must be used with reason and other analysis to strengthen the point of prediction.
how to use: (approximately the same as the Bollinger band indicator and Keltner channel)
1. look at the direction of movement of the candle
2. Determine the direction using this indicator and your analysis techniques

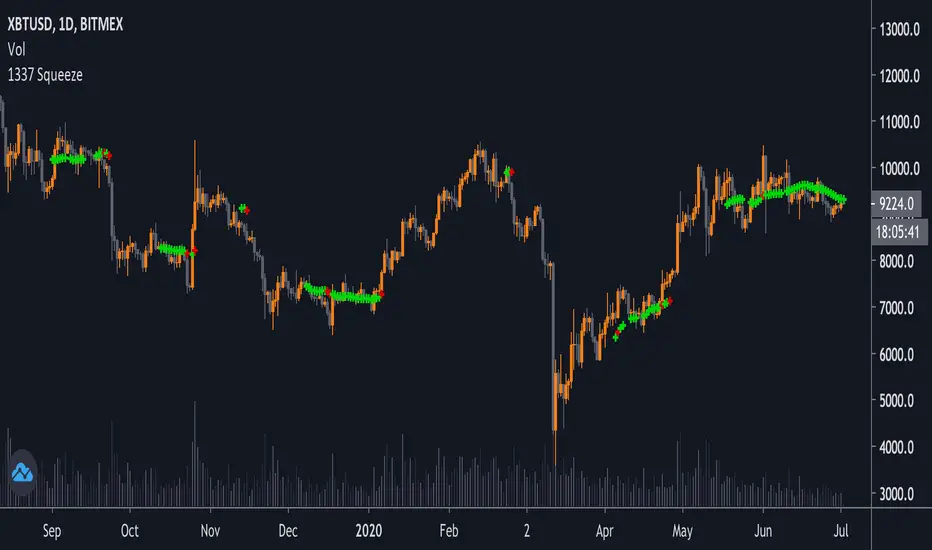
1337 SqueezeThis is a squeeze indicator plotted on the chart, with configurable values. Green crosses show when there is a squeeze (bollinger bands inside keltner channels). Red crosses show a potential release/breakout when close > bollinger bands.
You can also edit the settings of the indicator to show the bollinger bands and keltner channels (by removing the transparency).
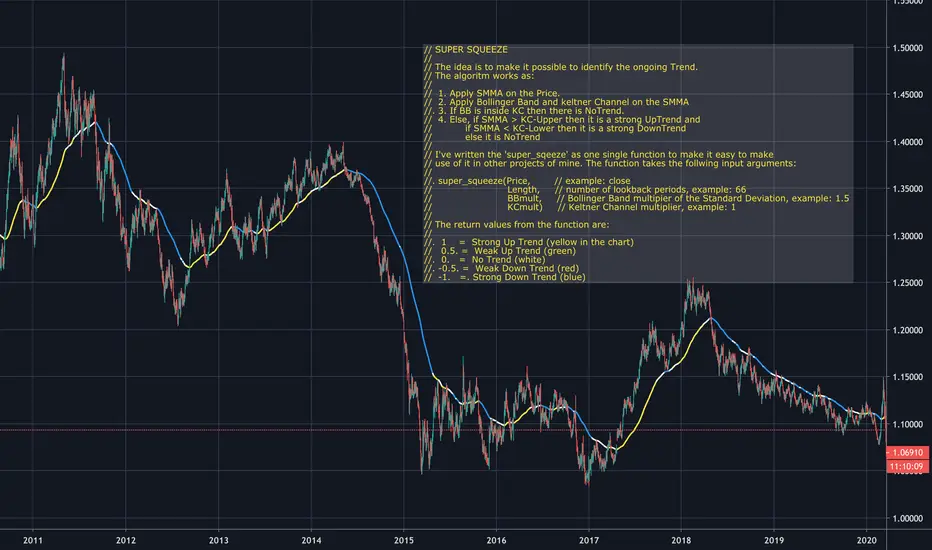
Super Squeeze// SUPER SQUEEZE
//
// The idea is to make it possible to identify the ongoing Trend.
// The algoritm works as:
//
// 1. Apply SMMA on the Price.
// 2. Apply Bollinger Band and keltner Channel on the SMMA
//. 3. If BB is inside KC then there is NoTrend.
// 4. Else, if SMMA > KC-Upper then it is a strong UpTrend and
// if SMMA < KC-Lower then it is a strong DownTrend
// else it is NoTrend
//
// I've written the 'super_sqeeze' as one single function to make it easy to make
// use of it in other projects of mine. The function takes the follwing input arguments:
//
//. super_squeeze(Price, // example: close
// Length, // number of lookback periods, example: 66
// BBmult, // Bollinger Band multipier of the Standard Deviation, example: 1.5
// KCmult) // Keltner Channel multiplier, example: 1
//
// The return values from the function are:
//
//. 1 = Strong Up Trend
// 0.5. = Weak Up Trend
//. 0. = No Trend
//. -0.5. = Weak Down Trend
// -1. =. Strong Down Trend
ka66: ATR Stop ChannelATR Stop Channel: Often used as a dynamic stop loss management tool, this indicator:
Calculates the ATR over a configurable period, default 14
Based on configurable multipliers, draws a channel of (close + atr-multiple, close - atr-multiple)
The reference point of close is also configurable to allow a different source, e.g. you can use an EMA if you wanted to make a Keltner channel.
The upper channel line can be used for short position stop management, while the bottom one is for long positions. Multipliers can also be configured separately for long vs. short, given that one common market anomaly is that short positions can often have more aggressive stops.
ATR is calculated as the Simple Moving Average of TRs, no fancy weighted averaging. The tradingview atr function uses RMA, an EMA variant used in RSI, I prefer simpler averaging. The lag can be a feature if used well. Additionally, it's easier to reason about.
Note: For a more dedicated and full-featured multi-ATR|Keltner channels however, see my: "ka66: Multi ATR Channels", which is likely better suited for price analysis and channel trading.

Super Moving Average
Plots one of several types of moving average types
Supports ATR/Kelter Channels
Supports Bollinger Bands
Velocity squeezes shown on the moving average to identify possible turning points
Supports ATR based stop for MA Trend Reversals
MA Trend reversal alert conditions
See related Moving Average Ribbon script.

TTM SQUEEZE with ALERT by NM// ######################################################################################
// This script was created because the original TTM Squeeze script
// did trigger when only one of the Bollinger Bands was
// in the Keltner channel. It now gives the option to use it as was
// or to force it to only give a signal when both BB are in the Keltner channels
//
// Furthermore an alert was added to fire when we are squeezing
// no matter which option your choose (original or strict)
//
// To create an alert, click on the alerts in the right column on your screen
// then click on the +button to add an alert.
// Select from the conditions "CTTV Squeeze" and "Once per bar close"
// Keep in mind that you set this alert for one instrument and one particular time frame
//
// If you would have any questions, contact me :
// TradingView : @Nico.Muselle
// ######################################################################################
How to start using this script ?
1. Add this script to your favorites
2. Click on the Indicator-button on the top bar of your chart
3. Click on Favorites and find CTTV TTM
Do also check out my other indicators :
Percentage change -
Power Moving Average Pro - (use Moving Averages of higher time frames on lower time frame charts) -
Power Moving Average - (use 1 moving average of a higher time frame on the current time frame) -
BitFinex Longs vs. Shorts -
Relative Strength Index Direction -
Reversal Candles -
EMADiff -
Improved Linear Regression Bull and Bear Power v02 -
Improved Linear Regression Bull and Bear Power v01 -
PS : Sorry about the messy chart - Bottom indicators show the TTM Squeeze, top one being the original posted here, bottom one being the more strict option.

DynLenLibLibrary "DynLenLib"
sum_dyn(src, len)
Parameters:
src (float)
len (int)
lag_dyn(src, len)
Parameters:
src (float)
len (int)
highest_dyn(src, len)
Parameters:
src (float)
len (int)
lowest_dyn(src, len)
Parameters:
src (float)
len (int)
var_dyn(src, len)
Parameters:
src (float)
len (int)
stdev_dyn(src, len)
Parameters:
src (float)
len (int)
hl2()
hlc3()
ohlc4()
sma_dyn(src, len)
Parameters:
src (float)
len (int)
ema_dyn(src, len)
Parameters:
src (float)
len (int)
rma_dyn(src, len)
Parameters:
src (float)
len (int)
smma_dyn(src, len)
Parameters:
src (float)
len (int)
wma_dyn(src, len)
Parameters:
src (float)
len (int)
vwma_dyn(price, vol, len)
Parameters:
price (float)
vol (float)
len (int)
hma_dyn(src, len)
Parameters:
src (float)
len (int)
dema_dyn(src, len)
Parameters:
src (float)
len (int)
tema_dyn(src, len)
Parameters:
src (float)
len (int)
kama_dyn(src, erLen, fastLen, slowLen)
Parameters:
src (float)
erLen (int)
fastLen (int)
slowLen (int)
mcginley_dyn(src, len)
Parameters:
src (float)
len (int)
median_price()
true_range()
atr_dyn(len)
Parameters:
len (int)
bbands_dyn(src, len, mult)
Parameters:
src (float)
len (int)
mult (float)
bb_percent_b(src, len, mult)
Parameters:
src (float)
len (int)
mult (float)
bb_bandwidth(src, len, mult)
Parameters:
src (float)
len (int)
mult (float)
keltner_dyn(src, lenEMA, lenATR, multATR)
Parameters:
src (float)
lenEMA (int)
lenATR (int)
multATR (float)
donchian_dyn(len)
Parameters:
len (int)
choppiness_index(len)
Parameters:
len (int)
vol_stop(lenATR, mult)
Parameters:
lenATR (int)
mult (float)
roc_dyn(src, len)
Parameters:
src (float)
len (int)
rsi_dyn(src, len)
Parameters:
src (float)
len (int)
stoch_dyn(kLen, dLen, smoothK)
Parameters:
kLen (int)
dLen (int)
smoothK (int)
stoch_rsi_dyn(rsiLen, stochLen, kSmooth, dLen)
Parameters:
rsiLen (int)
stochLen (int)
kSmooth (int)
dLen (int)
cci_dyn(src, len)
Parameters:
src (float)
len (int)
cmo_dyn(src, len)
Parameters:
src (float)
len (int)
trix_dyn(len)
Parameters:
len (int)
tsi_dyn(shortLen, longLen)
Parameters:
shortLen (int)
longLen (int)
ultimate_osc(len1, len2, len3)
Parameters:
len1 (int)
len2 (int)
len3 (int)
dpo_dyn(src, len)
Parameters:
src (float)
len (int)
willr_dyn(len)
Parameters:
len (int)
macd_dyn(src, fastLen, slowLen, sigLen)
Parameters:
src (float)
fastLen (int)
slowLen (int)
sigLen (int)
ppo_dyn(src, fastLen, slowLen, sigLen)
Parameters:
src (float)
fastLen (int)
slowLen (int)
sigLen (int)
aroon_dyn(len)
Parameters:
len (int)
dmi_adx_dyn(diLen, adxLen)
Parameters:
diLen (int)
adxLen (int)
vortex_dyn(len)
Parameters:
len (int)
coppock_dyn(rocLen1, rocLen2, wmaLen)
Parameters:
rocLen1 (int)
rocLen2 (int)
wmaLen (int)
rvi_dyn(len)
Parameters:
len (int)
price_osc_dyn(src, fastLen, slowLen)
Parameters:
src (float)
fastLen (int)
slowLen (int)
rci_dyn(src, len)
Parameters:
src (float)
len (int)
obv()
pvt()
cmf_dyn(len)
Parameters:
len (int)
adl()
chaikin_osc_dyn(fastLen, slowLen)
Parameters:
fastLen (int)
slowLen (int)
mfi_dyn(len)
Parameters:
len (int)
volume_osc_dyn(fastLen, slowLen)
Parameters:
fastLen (int)
slowLen (int)
up_down_volume()
cvd()
supertrend_dyn(atrLen, mult)
Parameters:
atrLen (int)
mult (float)
envelopes_dyn(src, len, pct)
Parameters:
src (float)
len (int)
pct (float)
linreg_line_slope(src, len)
Parameters:
src (float)
len (int)
lsma_dyn(src, len)
Parameters:
src (float)
len (int)
corrcoef_dyn(a, b, len)
Parameters:
a (float)
b (float)
len (int)
psar(step, maxStep)
Parameters:
step (float)
maxStep (float)
pivots_standard()
williams_alligator(src, jawLen, teethLen, lipsLen)
Parameters:
src (float)
jawLen (int)
teethLen (int)
lipsLen (int)
twap_dyn(src, len)
Parameters:
src (float)
len (int)
vwap_anchored(price, volume, reset)
Parameters:
price (float)
volume (float)
reset (bool)
performance_pct(len)
Parameters:
len (int)

Perp Imbalance Zones • Pro (clean)USD Premium (perp vs spot) → (Perp − Spot) / Spot.
Imbalance (z-score of that premium) → how extreme the current premium is relative to its own history over lenPrem bars.
Hysteresis state machine → flips to a SHORT bias when perp-long pressure is extreme; flips to LONG bias when perp-short pressure is extreme. It exits only after the imbalance cools (prevents whipsaw).
Price stretch filter (±σ) → optional Bollinger check so signals only fire when price is already stretched.
HTF confirmation (optional) → require higher-timeframe imbalance to agree with the current-TF bias.
Gradient visuals → line + background tint deepen as |z| grows (more extreme pressure).
What you see on the pane
A single line (z):
Above 0 = perp richer than spot (perp longs pressing).
Below 0 = perp cheaper than spot (perp shorts pressing).
Guides: dotted levels at ±enterZ (entry) and ±exitZ (cool-off/exit).
Background tint:
Red when state = SHORT bias (perp longs heavy).
Blue when state = LONG bias (perp shorts heavy).
Tint intensity scales with |z| (via hotZ).
Labels (optional): prints when bias flips.
Alerts (optional): “Enter SHORT/LONG bias” and “Exit bias”.
How to use it (playbook)
Attach & set symbols
Put the script on your chart.
Set Spot symbol and Perp symbol to the venue you trade (e.g., BINANCE:BTCUSDT + BINANCE:BTCUSDTPERP).
Read the bias
SHORT bias (red background): perp longs over-extended. Look for short entries if price is at resistance, σ-stretched, or your PA system agrees.
LONG bias (blue background): perp shorts over-extended. Look for long entries at support/σ-stretched down.
Entries
Use the bias flip as a context/confirm. Combine with your structure trigger (OB/level sweep, rejection wick, micro-break in market structure, etc.).
If useSigma=true, only trade when price is already ≥ upper band (shorts) or ≤ lower band (longs).
Exits
Bias auto-exits when |z| falls below exitZ.
You can also take profits at your levels or when the line fades back toward 0 while price mean-reverts to the middle band.
Tuning (what each knob does)
enterZ / exitZ (signal strictness + hysteresis)
Higher enterZ → fewer, cleaner signals (e.g., 1.8–2.2).
exitZ should be lower than enterZ (e.g., 0.6–1.0) to prevent flicker.
lenPrem (context window for z)
Larger (50–100) = steadier baseline, fewer signals.
Smaller (20–30) = more reactive, more signals.
smoothLen (EMA on z)
2–3 = snappier; 5–7 = smoother/laggier but cleaner.
useSigma, bbLen, bbK (price-stretch filter)
On filters chop. Try bbLen=100, bbK=1.0–1.5.
Off if you want more frequent signals or you already gate with your own σ/Keltner.
useHTF, htfTF, htfZmin (trend/confirmation)
Turn on to require higher-TF imbalance agreement (e.g., trading 1H → confirm with 4H htfTF=240, htfZmin≈0.6–1.0).
hotZ (visual intensity)
Lower (2.0–2.5) heats up faster; higher (4.0) is more subtle.
Ready-made presets
Conservative swing (fewer, higher-conviction):
enterZ=2.0, exitZ=1.0, lenPrem=60–80, smoothLen=5, useSigma=true, bbK=1.5, useHTF=true (240/0.8).
Balanced intraday (default feel):
enterZ=1.6–1.8, exitZ=0.8–1.0, lenPrem=50, smoothLen=3–4, useSigma=true, bbK=1.0–1.25, useHTF=false/true depending on trendiness.
Aggressive scalping (more signals):
enterZ=1.2–1.4, exitZ=0.6–0.8, lenPrem=20–30, smoothLen=2–3, useSigma=false, useHTF=false.
Practical tips
Don’t trade the line in isolation. Use it to time trades into your levels: VWAP bands, Monday high/low, prior POC/VAH/VAL, order blocks, etc.
Perp-led reversals often snap—be ready to scale out quickly back to mid-bands.
Venue matters. Keep spot & perp from the same exchange family to avoid cross-venue quirks.
Alerts: enable after you’ve tuned thresholds for your timeframe so you only get high-quality pings.
