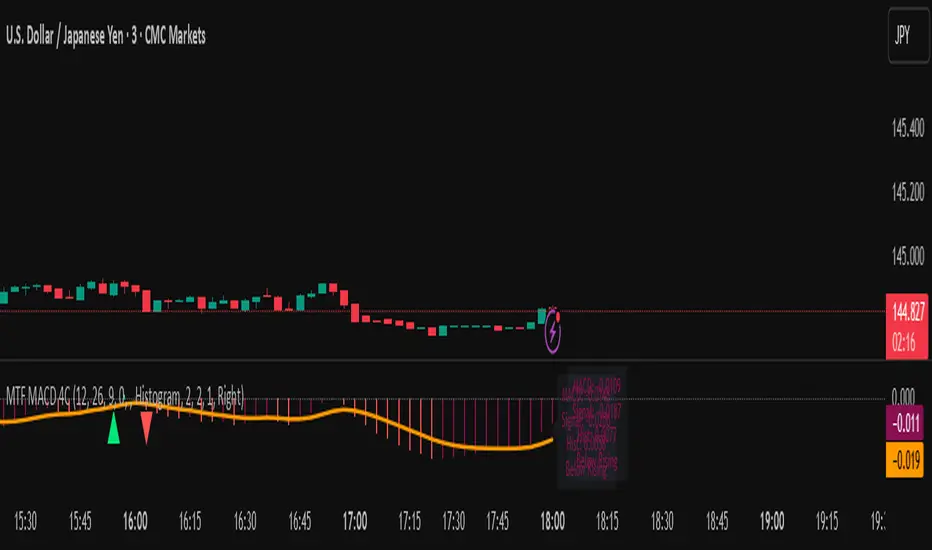
MTF MACD 4-Color Momentum System🎯 Overview
The MTF MACD 4-Color Momentum System is an advanced MACD indicator that provides crystal-clear momentum visualization through an innovative 4-color state system. Unlike traditional MACD indicators that only show positive/negative values, this indicator identifies four distinct market states to help traders make more informed decisions.
📊 Key Features
1. Four-State Color System:
🟢 Lime: Above zero + Rising (Strong Bullish Momentum)
🟢 Dark Green: Above zero + Falling (Weakening Bullish Momentum)
🔴 Red: Below zero + Falling (Strong Bearish Momentum)
🔴 Maroon: Below zero + Rising (Weakening Bearish Momentum)
2. Multi-Timeframe Analysis:
View higher timeframe MACD on lower timeframe charts
Confirm trends across multiple timeframes
Reduce false signals with multi-timeframe confluence
3. Flexible Display Options:
Three visualization styles: Histogram, Columns, or Line
Toggle individual color states on/off
Customizable colors and line widths
4. Advanced Features:
Optional histogram smoothing to reduce noise
Zero-cross alerts with visual markers
Color state change alerts
Real-time value display
Customizable signal line overlay
💡 How to Use
1. Momentum Identification:
Lime bars indicate strong upward momentum - ideal for long entries
Dark green suggests momentum is slowing - consider taking profits
Red bars show strong downward momentum - ideal for short entries
Maroon indicates potential reversal brewing - prepare for direction change
2. Zero Line Crosses:
Blue triangles mark bullish crosses above zero
Pink triangles mark bearish crosses below zero
Use these as confirmation signals with other indicators
3. Multi-Timeframe Confirmation:
Set to higher timeframe (e.g., 4H on 15m chart)
Look for alignment between timeframes before entering trades
Avoid trades against higher timeframe momentum
⚙️ Settings Guide
MACD Parameters:
Fast EMA: 12 (default) - Adjust for more/less sensitivity
Slow EMA: 26 (default) - Standard MACD setting
Signal: 9 (default) - Smoothing period
Display Customization:
Choose between Histogram, Columns, or Line display
Enable/disable specific color states
Adjust visual properties to match your chart theme
Alerts:
Zero cross alerts for trend changes
Color state alerts for momentum shifts
📈 Trading Strategies
1. Momentum Continuation:
Enter longs when MACD turns lime (above zero + rising)
Enter shorts when MACD turns red (below zero + falling)
Exit when color shifts to "weakening" state
2. Reversal Trading:
Watch for maroon in downtrends (potential bottom)
Watch for dark green in uptrends (potential top)
Confirm with price action and support/resistance
3. Multi-Timeframe Confluence:
Use daily MACD on 1H chart for trend direction
Enter on lower timeframe signals in direction of higher timeframe
Avoid counter-trend trades when higher timeframe shows strong momentum
🎓 Pro Tips
Combine with volume indicators for confirmation
Use with support/resistance levels for better entries
Enable smoothing in choppy markets to reduce false signals
Pay attention to divergences between price and MACD
⚠️ Risk Disclaimer
This indicator is for educational purposes only. Always use proper risk management and combine with other analysis methods. Past performance does not guarantee future results.
Cerca negli script per "MACD背离"
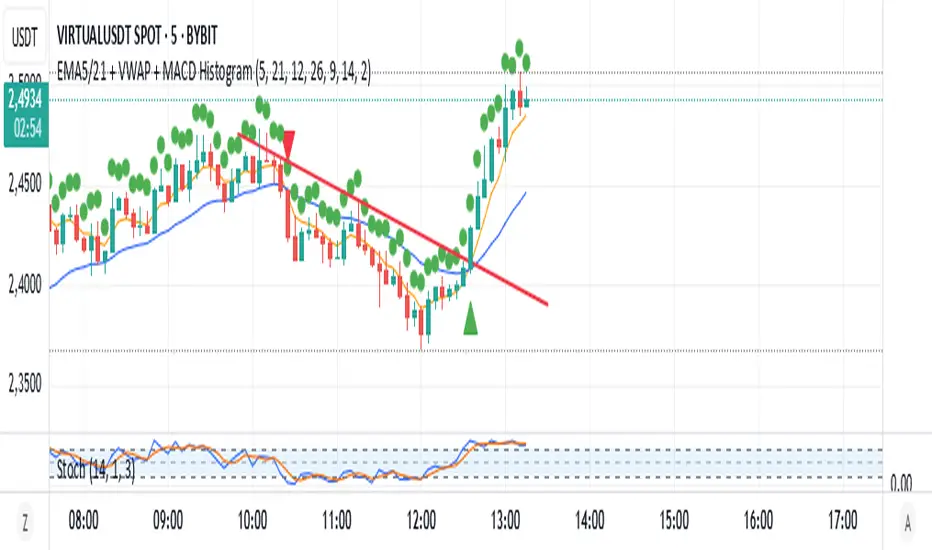
EMA5/21 + VWAP + MACD HistogramScript Summary: EMA + VWAP + MACD + RSI Strategy
Objective: Combine multiple technical indicators to identify market entry and exit opportunities, aiming to increase signal accuracy.
Indicators Used:
EMAs (Exponential Moving Averages): Periods of 5 (short-term) and 21 (long-term) to identify trend crossovers.
VWAP (Volume Weighted Average Price): Serves as a reference to determine if the price is in a fair value zone.
MACD (Moving Average Convergence Divergence): Standard settings of 12, 26, and 9 to detect momentum changes.
RSI (Relative Strength Index): Period of 14 to identify overbought or oversold conditions.
Entry Rules:
Buy (Long): 5-period EMA crosses above the 21-period EMA, price is above VWAP, MACD crosses above the signal line, and RSI is above 40.
Sell (Short): 5-period EMA crosses below the 21-period EMA, price is below VWAP, MACD crosses below the signal line, and RSI is below 60.
Exit Rules:
For long positions: When the 5-period EMA crosses below the 21-period EMA or MACD crosses below the signal line.
For short positions: When the 5-period EMA crosses above the 21-period EMA or MACD crosses above the signal line.
Visual Alerts:
Buy and sell signals are highlighted on the chart with green (buy) and red (sell) arrows below or above the corresponding candles.
Indicator Plotting:
The 5 and 21-period EMAs, as well as the VWAP, are plotted on the chart to facilitate the visualization of market conditions.
This script is a versatile tool for traders seeking to combine multiple technical indicators into a single strategy. It can be used across various timeframes and assets, allowing adjustments according to the trader's profile and market characteristics.
Juliano Einhardt Ulguim, Brazil, 05/27/2025.
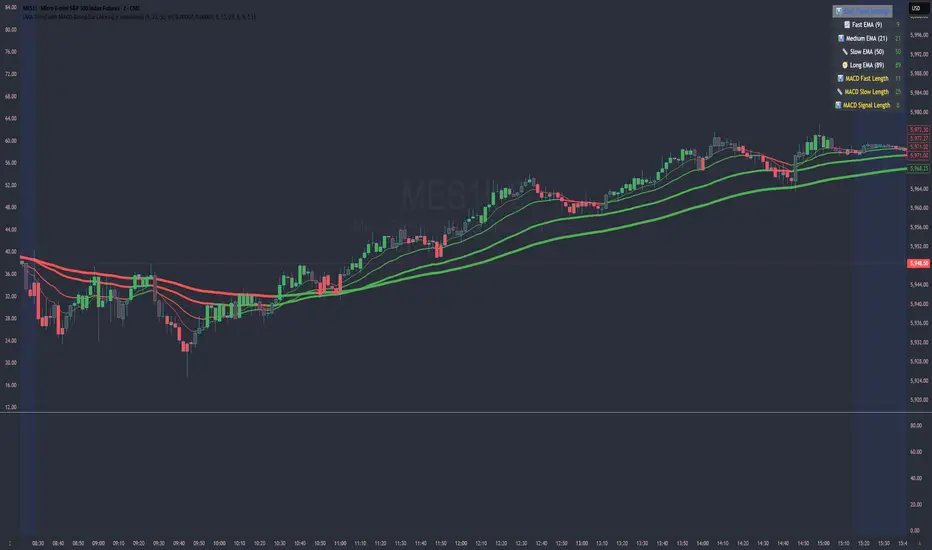
EMA Trend with MACD-Based Bar Coloring (Customized)This indicator blends trend-following EMAs with MACD-based momentum signals to provide a visually intuitive view of market conditions. It's designed for traders who value clean, color-coded charts and want to quickly assess both trend direction and overbought/oversold momentum.
🔍 Key Features:
Multi-EMA Trend Visualization:
Includes four Exponential Moving Averages (EMAs):
Fast (9)
Medium (21)
Slow (50)
Long (89)
Each EMA is dynamically color-coded based on its slope—green for bullish, red for bearish, and gray for neutral—to help identify the trend strength and alignment at a glance.
MACD-Based Bar Coloring:
Candlesticks are colored based on MACD's relationship to its Bollinger Bands:
Green bars signal strong bullish momentum (MACD > Upper Band)
Red bars signal strong bearish momentum (MACD < Lower Band)
Gray bars reflect neutral conditions
Compact Visual Dashboard:
A clean, top-right table displays your current EMA and MACD settings, helping you track parameter configurations without opening the settings menu.
✅ Best Used For:
Identifying trend alignment across short- to medium-term timeframes
Filtering entries based on trend strength and MACD overextension
Enhancing discretion-based or rule-based strategies with visual confirmation
WaveFunction MACD (TechnoBlooms)WaveFunction MACD — The Next Generation of Market Momentum
WaveFunction MACD is an advanced hybrid momentum indicator that merges:
• The classical MACD crossover logic (based on moving averages)
• Wave physics (modeled through phase energy and cosine functions)
• Hilbert Transform theory from signal processing
• The concept of a wavefunction from quantum mechanics, where price action is seen as a probabilistic energy wave—not just a trend.
✨ Key Features of WaveFunction MACD
• Wave Energy Logic : Instead of using just price and MA differences, this indicator computes phase-corrected momentum using the cosine of the wave phase angle — revealing the true energy behind market moves.
• Phase-Based Trend Detection : It reads cycle phases using Hilbert Transform-like logic, allowing you to spot momentum before it becomes visible in price.
• Ultra-Smooth Flow : The main line and histogram are built to follow price flow smoothly — eliminating much of the noise found in traditional MACD indicators.
• Signal Amplification via Energy Histogram : The histogram doesn’t just show momentum changes — it shows the intensity of wave energy, allowing you to confirm the strength of the trend.
• Physics-Driven Structure : The algorithm is rooted in real-world wave mechanics, bringing a scientific edge to trading — ideal for traders who believe in natural models like cycles and harmonics.
• Trend Confirmation & Early Reversals : It can confirm strong trends and also catch subtle shifts that often precede big reversals — giving you both reliability and anticipation.
• Ready for Fusion : Designed to work seamlessly with liquidity zones, price action, order blocks, and structure trading — a perfect fit for modern trading systems.
🧪 The Science Behind It
This tool blends:
• Hilbert Transform: Measures the phase of a waveform (price cycle) to detect turning points
• Cosine Phase Energy: Calculates true wave energy using the cosine of the phase angle, revealing the strength behind price movements
• Quantum Modeling: Views price like a wavefunction, offering predictive insight based on phase dynamics

Liquid Pulse Liquid Pulse by Dskyz (DAFE) Trading Systems
Liquid Pulse is a trading algo built by Dskyz (DAFE) Trading Systems for futures markets like NQ1!, designed to snag high-probability trades with tight risk control. it fuses a confluence system—VWAP, MACD, ADX, volume, and liquidity sweeps—with a trade scoring setup, daily limits, and VIX pauses to dodge wild volatility. visuals include simple signals, VWAP bands, and a dashboard with stats.
Core Components for Liquid Pulse
Volume Sensitivity (volumeSensitivity) controls how much volume spikes matter for entries. options: 'Low', 'Medium', 'High' default: 'High' (catches small spikes, good for active markets) tweak it: 'Low' for calm markets, 'High' for chaos.
MACD Speed (macdSpeed) sets the MACD’s pace for momentum. options: 'Fast', 'Medium', 'Slow' default: 'Medium' (solid balance) tweak it: 'Fast' for scalping, 'Slow' for swings.
Daily Trade Limit (dailyTradeLimit) caps trades per day to keep risk in check. range: 1 to 30 default: 20 tweak it: 5-10 for safety, 20-30 for action.
Number of Contracts (numContracts) sets position size. range: 1 to 20 default: 4 tweak it: up for big accounts, down for small.
VIX Pause Level (vixPauseLevel) stops trading if VIX gets too hot. range: 10 to 80 default: 39.0 tweak it: 30 to avoid volatility, 50 to ride it.
Min Confluence Conditions (minConditions) sets how many signals must align. range: 1 to 5 default: 2 tweak it: 3-4 for strict, 1-2 for more trades.
Min Trade Score (Longs/Shorts) (minTradeScoreLongs/minTradeScoreShorts) filters trade quality. longs range: 0 to 100 default: 73 shorts range: 0 to 100 default: 75 tweak it: 80-90 for quality, 60-70 for volume.
Liquidity Sweep Strength (sweepStrength) gauges breakouts. range: 0.1 to 1.0 default: 0.5 tweak it: 0.7-1.0 for strong moves, 0.3-0.5 for small.
ADX Trend Threshold (adxTrendThreshold) confirms trends. range: 10 to 100 default: 41 tweak it: 40-50 for trends, 30-35 for weak ones.
ADX Chop Threshold (adxChopThreshold) avoids chop. range: 5 to 50 default: 20 tweak it: 15-20 to dodge chop, 25-30 to loosen.
VWAP Timeframe (vwapTimeframe) sets VWAP period. options: '15', '30', '60', '240', 'D' default: '60' (1-hour) tweak it: 60 for day, 240 for swing, D for long.
Take Profit Ticks (Longs/Shorts) (takeProfitTicksLongs/takeProfitTicksShorts) sets profit targets. longs range: 5 to 100 default: 25.0 shorts range: 5 to 100 default: 20.0 tweak it: 30-50 for trends, 10-20 for chop.
Max Profit Ticks (maxProfitTicks) caps max gain. range: 10 to 200 default: 60.0 tweak it: 80-100 for big moves, 40-60 for tight.
Min Profit Ticks to Trail (minProfitTicksTrail) triggers trailing. range: 1 to 50 default: 7.0 tweak it: 10-15 for big gains, 5-7 for quick locks.
Trailing Stop Ticks (trailTicks) sets trail distance. range: 1 to 50 default: 5.0 tweak it: 8-10 for room, 3-5 for fast locks.
Trailing Offset Ticks (trailOffsetTicks) sets trail offset. range: 1 to 20 default: 2.0 tweak it: 1-2 for tight, 5-10 for loose.
ATR Period (atrPeriod) measures volatility. range: 5 to 50 default: 9 tweak it: 14-20 for smooth, 5-9 for reactive.
Hardcoded Settings volLookback: 30 ('Low'), 20 ('Medium'), 11 ('High') volThreshold: 1.5 ('Low'), 1.8 ('Medium'), 2 ('High') swingLen: 5
Execution Logic Overview trades trigger when confluence conditions align, entering long or short with set position sizes. exits use dynamic take-profits, trailing stops after a profit threshold, hard stops via ATR, and a time stop after 100 bars.
Features Multi-Signal Confluence: needs VWAP, MACD, volume, sweeps, and ADX to line up.
Risk Control: ATR-based stops (capped 15 ticks), take-profits (scaled by volatility), and trails.
Market Filters: VIX pause, ADX trend/chop checks, volatility gates. Dashboard: shows scores, VIX, ADX, P/L, win %, streak.
Visuals Simple signals (green up triangles for longs, red down for shorts) and VWAP bands with glow. info table (bottom right) with MACD momentum. dashboard (top right) with stats.
Chart and Backtest:
NQ1! futures, 5-minute chart. works best in trending, volatile conditions. tweak inputs for other markets—test thoroughly.
Backtesting: NQ1! Frame: Jan 19, 2025, 09:00 — May 02, 2025, 16:00 Slippage: 3 Commission: $4.60
Fee Typical Range (per side, per contract)
CME Exchange $1.14 – $1.20
Clearing $0.10 – $0.30
NFA Regulatory $0.02
Firm/Broker Commis. $0.25 – $0.80 (retail prop)
TOTAL $1.60 – $2.30 per side
Round Turn: (enter+exit) = $3.20 – $4.60 per contract
Disclaimer this is for education only. past results don’t predict future wins. trading’s risky—only use money you can lose. backtest and validate before going live. (expect moderators to nitpick some random chart symbol rule—i’ll fix and repost if they pull it.)
About the Author Dskyz (DAFE) Trading Systems crafts killer trading algos. Liquid Pulse is pure research and grit, built for smart, bold trading. Use it with discipline. Use it with clarity. Trade smarter. I’ll keep dropping badass strategies ‘til i build a brand or someone signs me up.
2025 Created by Dskyz, powered by DAFE Trading Systems. Trade smart, trade bold.

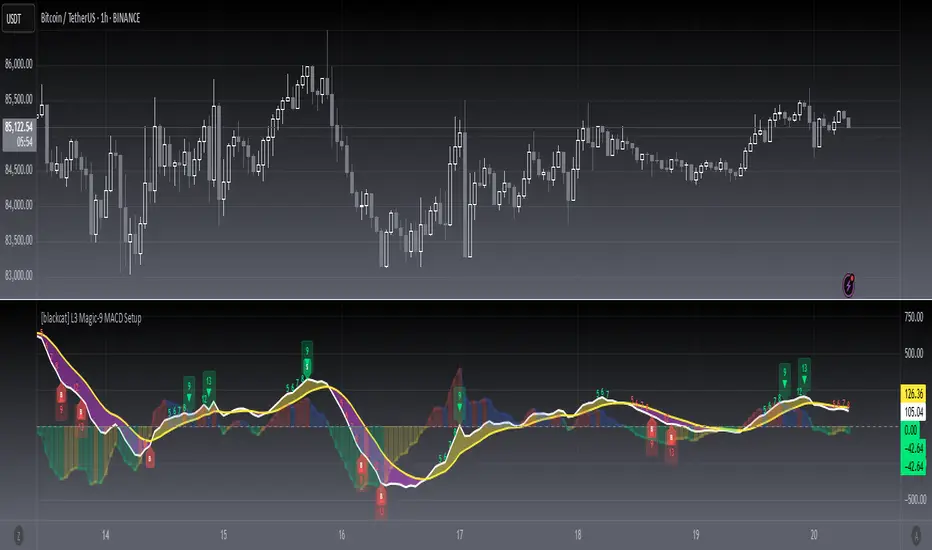
[blackcat] L3 Magic-9 MACD SetupOVERVIEW
The L3 Magic-9 MACD Setup indicator is meticulously crafted to assist traders in identifying precise buy and sell signals through an enhanced Moving Average Convergence Divergence (MACD) methodology. This advanced tool integrates the Magic-9 Sequential technique to refine signal accuracy by filtering out market noise. By providing clear visual cues via labeled charts and real-time alerts, it empowers users to make informed trading decisions swiftly and confidently 📈✅.
FEATURES
Customizable MACD Parameters:
Fast Length: Adjustable parameter to control the sensitivity of the fast moving average.
Slow Length: Configurable setting for the slow moving average to balance responsiveness and stability.
Signal Length: Modifiable value to determine the smoothing factor applied to the MACD line.
Dynamic Plot Visuals:
MACD Line: Representing the difference between short-term and long-term EMAs.
Signal Line: A smoothed version of the MACD line used to generate crossover signals.
Histogram: Illustrating the distance between the MACD and Signal lines, highlighting momentum changes.
All elements feature adjustable colors and styles for personalized visualization preferences 🎨.
Advanced Filtering Mechanism:
Utilizes the Magic-9 Sequential method to analyze consecutive price movements, enhancing signal reliability.
Counts sequential occurrences above or below initial values to detect trends more accurately 🔍.
Sequential Labels:
Displays numerical labels (e.g., '5', '6', etc.) at key points where sequential conditions are met, offering insights into trend strength.
Highlights significant reversals with special labels like '9' and '13' for critical decision-making moments 🏷️.
Buy/Sell Signals:
Generates clear 'B' (buy) and 'S' (sell) labels based on predefined conditions derived from sequential analysis.
Provides actionable trade suggestions directly on the chart for easy interpretation.
Alert System:
Supports customizable alerts to notify users instantly when buy/sell conditions are triggered.
Ensures timely responses to market movements without constant monitoring 🔔.
HOW TO USE
Add Indicator to Chart:
Access the TradingView platform and navigate to the indicators section.
Select ' L3 Magic-9 MACD Setup' from the list and add it to your desired chart.
Configure Settings:
Open the settings panel to adjust MACD parameters such as Fast Length, Slow Length, and Signal Length according to your trading strategy.
Modify plot colors and styles to suit your visual preferences for better readability.
Analyze Chart Labels:
Monitor the chart for sequentially numbered labels indicating trend strength and potential reversal points.
Pay close attention to special labels like '9' and '13' for crucial trading signals.
Combine with Other Tools:
Use additional technical indicators or fundamental analysis to confirm signals generated by the L3 Magic-9 MACD Setup.
Enhance decision-making accuracy by cross-verifying multiple data sources.
LIMITATIONS
Market Conditions Sensitivity:
The indicator may produce fewer reliable signals during periods of low volatility or range-bound markets.
Traders should be cautious of false positives in highly choppy environments 🌪️.
Dependency on Historical Data:
Accurate performance requires sufficient historical price data; insufficient data may lead to inaccurate calculations.
Regular updates and backtesting are essential to maintain effectiveness over time.
Single Indicator Risk:
Relying solely on MACD-based signals can miss broader market context; combining with other analytical tools is recommended.
Always validate signals through multiple lenses to mitigate risks associated with single-indicator strategies.
NOTES
Data Sufficiency:
Ensure your chart has enough historical data loaded to support robust MACD computations.
Periodically review and update data inputs to reflect current market dynamics.
Testing and Validation:
Conduct thorough testing on demo accounts before deploying the indicator in live trading scenarios.
Backtest across various market cycles to assess its resilience under different conditions.
Parameter Optimization:
Experiment with different parameter settings tailored to specific asset classes or trading styles.
Fine-tune the lookback period and other configurable options to align with personal trading objectives.
[blackcat] L3 Magic-9 Sequential MACDOVERVIEW
The L3 Magic-9 Sequential MACD indicator is an advanced tool designed to enhance the traditional Moving Average Convergence Divergence (MACD) by incorporating sequential patterns. This script calculates various MACD components and applies custom logic to identify potential buy and sell signals based on specific sequential conditions 📊💹.
FEATURES
Calculates MACD Line, Signal Line, and enhanced histogram.
Plots colored histograms to visualize differences between MACD line and signal line:
Positive histogram bars indicate bullish momentum.
Negative histogram bars indicate bearish momentum.
Identifies sequential patterns in the MACD line for generating buy ('Buy') and sell ('Sell') signals 🏷️.
Adds numerical labels (e.g., '5', '6', '7', etc.) to mark specific sequential conditions.
Supports customizable colors and styles for plotted elements ⚙️.
Generates alerts for identified sequential patterns 🔔.
HOW TO USE
Add the indicator to your TradingView chart by selecting it from the indicators list.
Adjust the input parameters for Fast Length, Slow Length, and Signal Length.
Monitor the chart for labeled buy/sell signals and numerical markers indicating sequential patterns.
Set up alerts based on the generated signals to receive notifications when conditions are met 📲.
Use the indicator alongside other technical analysis tools for better decision-making.
LIMITATIONS
The effectiveness of sequential patterns may vary depending on market conditions.
False signals can occur in highly volatile or ranging markets 🌪️.
Users should always confirm signals with other forms of analysis before entering trades.
NOTES
Ensure that you have sufficient historical data available for accurate MACD calculations.
Test the indicator thoroughly on demo accounts before applying it to live trading 🔍.
Customize the appearance of the plotted elements as needed to suit your chart layout.

EMA 9/21/50 + VWAP + MACD + RSI Pro [v6]Overview:
A powerful multi-indicator tool combining Exponential Moving Averages (EMA 9, 21, 50), Volume-Weighted Average Price (VWAP), Moving Average Convergence Divergence (MACD), and Relative Strength Index (RSI) into a single, easy-to-read system. Designed for traders who want a clean, all-in-one dashboard for trend analysis, momentum confirmation, and overbought/oversold conditions.
Key Features:
1. Triple EMA System (9, 21, 50)
Identifies short-term and medium-term trends.
Bullish Signal: EMA 9 > EMA 21 > EMA 50 (Green Highlight)
Bearish Signal: EMA 9 < EMA 21 < EMA 50 (Red Highlight)
Helps confirm trend direction and potential reversals.
2. VWAP (Volume-Weighted Average Price)
Tracks intraday fair value price based on volume.
Bullish: Price above VWAP (Green)
Bearish: Price below VWAP (Red)
3. MACD (Standard 12, 26, 9 Settings)
Shows momentum shifts.
Bullish: MACD line > Signal line (Green)
Bearish: MACD line < Signal line (Red)
Histogram confirms strength of momentum.
4. RSI (14-Period Default)
Identifies overbought (>70) and oversold (<30) conditions.
Red: Overbought (Potential Reversal)
Green: Oversold (Potential Bounce)
5. Signal Dashboard (Top-Right Table)
Real-time summary of all indicators in one place.
Color-coded for quick interpretation (Green = Bullish, Red = Bearish).
How to Use This Indicator?
✅ Trend Confirmation:
Trade in the direction of EMA alignment (9 > 21 > 50 for uptrends).
Use VWAP as dynamic support/resistance.
✅ Momentum Entries:
Look for MACD crossovers while RSI is not extreme.
Avoid buying when RSI > 70 or selling when RSI < 30 (unless strong trend).
✅ Mean Reversion:
Fade extreme RSI readings (overbought/oversold) when price is at key levels.
Who Is This For?
✔ Swing Traders – EMA + MACD combo for trend-following.
✔ Day Traders – VWAP + EMA for intraday bias.
✔ RSI Traders – Clear overbought/oversold signals.
Settings Customization:
Adjust EMA lengths, RSI periods, and MACD settings as needed.
Toggle VWAP visibility on/off.
Why Use This Script?
📌 All-in-One: No need for multiple indicators cluttering your chart.
📌 Visual Clarity: Color-coded signals for quick decision-making.
📌 Flexible: Works on any timeframe (1M, 5M, 1H, Daily, etc.).
Install now and enhance your trading strategy with a professional-grade multi-indicator system!
Not a financial advice. Use at your own discretion and always apply risk management

Normalized MACD with RSI & Stoch RSI + SignalsNormalized MACD with RSI & Stoch RSI Indicator
Overview:
This indicator combines three popular momentum indicators (MACD, RSI, and Stochastic RSI) into a single cohesive, normalized view, making it easier for traders to interpret market momentum and potential buy/sell signals. It specifically addresses an important issue—the different scale ranges of indicators—by normalizing MACD values to match the 0–100 scale of RSI and Stochastic RSI.
Here’s a clear and concise description of your updated Pine Script indicator:
⸻
Normalized MACD with RSI & Stoch RSI Indicator
Overview:
This indicator combines three popular momentum indicators (MACD, RSI, and Stochastic RSI) into a single cohesive, normalized view, making it easier for traders to interpret market momentum and potential buy/sell signals. It specifically addresses an important issue—the different scale ranges of indicators—by normalizing MACD values to match the 0–100 scale of RSI and Stochastic RSI.
⸻
Key Components:
① MACD (Normalized):
• The Moving Average Convergence Divergence (MACD) originally has an unlimited numerical range.
• Normalization Method:
• Uses a custom tanh(x) function implemented directly in Pine Script:
\tanh(x) = \frac{e^{x}-e^{-x}}{e^{x}+e^{-x}}
• MACD values are scaled using this method to a range of 0–100, with the neutral line at exactly 50.
• Interpretation:
• Values above 50 indicate bullish momentum.
• Values below 50 indicate bearish momentum.
② RSI (Relative Strength Index):
• Measures market momentum on a 0–100 scale.
• Traditional RSI interpretation:
• Overbought conditions: RSI > 70–80.
• Oversold conditions: RSI < 30–20.
③ Stochastic RSI:
• Combines RSI and Stochastic Oscillator to give short-term, highly sensitive signals.
• Helps identify immediate market extremes:
• Above 80 → Short-term overbought.
• Below 20 → Short-term oversold.
⸻
How the Indicator Works:
• Visualization:
• All three indicators (Normalized MACD, RSI, Stochastic RSI) share the same 0–100 scale.
• Clear visual lines and reference levels:
• Midline at 50 indicates neutral momentum.
• Dashed lines at 20 and 80 clearly mark oversold/overbought zones.
• Trading Signals (Recommended approach):
• Bullish Signal (Potential Buy):
• Normalized MACD crosses above 50.
• RSI below or approaching oversold zone (below 30–20).
• Stochastic RSI below 20, indicating short-term oversold conditions.
• Bearish Signal (Potential Sell):
• Normalized MACD crosses below 50.
• RSI above or approaching overbought zone (above 70–80).
• Stochastic RSI above 80, indicating short-term overbought conditions.
⸻
Why Use This Indicator?
• Harmonized Signals:
Normalization of MACD significantly improves clarity and comparability with RSI and Stochastic RSI, providing a unified momentum picture.
• Intuitive Analysis:
Traders can rapidly and intuitively identify momentum shifts without needing multiple indicator windows.
• Improved Decision-Making:
Clear visual references and signals help reduce subjective interpretation, potentially improving trading outcomes.
⸻
Suggested Usage:
• Combine with traditional support

Supertrend + MACD with Advanced FiltersDetailed Guide
1. Indicator Overview
Purpose:
This enhanced indicator combines Supertrend and MACD to signal potential trend changes. In addition, it now includes several extra filters for more reliable signals:
Multi-Timeframe (MTF) Confirmation: Checks a higher timeframe’s trend.
ADX (Momentum) Filter: Ensures the market is trending strongly.
Dynamic Factor Adjustment: Adapts the Supertrend sensitivity to current volatility.
Volume Filter: Verifies that current volume is above average.
Each filter can be enabled or disabled according to your preference.
How It Works:
The Supertrend calculates dynamic support/resistance levels based on ATR and an adjustable factor, while MACD identifies momentum shifts via its crossovers. The additional filters then confirm whether the conditions meet your criteria for a trend change. If all enabled filters align, the indicator plots a shape and triggers an alert.
2. Supertrend Component with Dynamic Factor
Base Factor & ATR Period:
The Supertrend uses these inputs to compute its dynamic bands.
Dynamic Factor Toggle:
When enabled, the factor is adjusted by comparing the current ATR to its simple moving average. This makes the indicator adapt to higher or lower volatility conditions, helping to reduce false signals.
3. MACD Component
Parameters:
Standard MACD settings (Fast MA, Slow MA, Signal Smoothing) determine the responsiveness of the MACD line. Crossovers between the MACD line and its signal line indicate potential trend reversals.
4. Multi-Timeframe (MTF) Filter
Function:
If enabled, the indicator uses a higher timeframe’s simple moving average (SMA) to confirm the prevailing trend.
Bullish Confirmation: The current close is above the higher timeframe SMA.
Bearish Confirmation: The current close is below the higher timeframe SMA.
5. ADX Filter (Momentum)
Custom Calculation:
Since the built-in ta.adx function may not be available, a custom ADX is calculated. This involves:
Determining positive and negative directional movements (DMs).
Smoothing these values to obtain +DI and -DI.
Calculating the DX and then smoothing it to yield the ADX.
Threshold:
Only signals where the ADX exceeds the set threshold (default 20) are considered valid, ensuring that the market is trending strongly enough.
6. Volume Filter
Function:
Checks if the current volume exceeds the average volume (SMA) multiplied by a specified factor. This helps confirm that a price move is supported by sufficient trading activity.
7. Combined Signal Logic & Alerts
Final Signal:
A bullish signal is generated when:
MACD shows a bullish crossover,
Supertrend indicates an uptrend,
And all enabled filters (MTF, ADX, volume) confirm the signal.
The bearish signal is generated similarly in the opposite direction.
Alerts:
Alert conditions are set so that TradingView can notify you via pop-up, email, or SMS when these combined conditions are met.
8. User Adjustments
Toggle Filters:
Use the on/off switches for MTF, ADX, and Volume filters as needed.
Parameter Tuning:
Adjust the ATR period, base factor, higher timeframe settings, ADX period/threshold, and volume multiplier to match your trading style and market conditions.
Backtesting:
Always backtest your settings to ensure that they perform well with your strategy.
RSI, Volume, MACD, EMA ComboRSI + Volume + MACD + EMA Trading System
This script combines four powerful indicators—Relative Strength Index (RSI), Volume, Moving Average Convergence Divergence (MACD), and Exponential Moving Average (EMA)—to create a comprehensive trading strategy for better trend confirmation and trade entries.
How It Works
RSI (Relative Strength Index)
Helps identify overbought and oversold conditions.
Used to confirm momentum strength before taking a trade.
Volume
Confirms the strength of price movements.
Avoids false signals by ensuring there is sufficient trading activity.
MACD (Moving Average Convergence Divergence)
Confirms trend direction and momentum shifts.
Provides buy/sell signals through MACD line crossovers.
EMA (Exponential Moving Average)
Acts as a dynamic support and resistance level.
Helps filter out trades that go against the overall trend.
Trading Logic
Buy Signal:
RSI is above 50 (bullish momentum).
MACD shows a bullish crossover.
The price is above the EMA (trend confirmation).
Volume is increasing (strong participation).
Sell Signal:
RSI is below 50 (bearish momentum).
MACD shows a bearish crossover.
The price is below the EMA (downtrend confirmation).
Volume is increasing (intense selling pressure).
Backtesting & Risk Management
The strategy is optimized for scalping on the 1-minute timeframe (adjustable for other timeframes).
Default settings use realistic commission and slippage to simulate actual trading conditions.
A stop-loss and take-profit system is integrated to manage risk effectively.
This script is designed to help traders filter out false signals, improve trend confirmation, and increase trade accuracy by combining multiple indicators in a structured way.

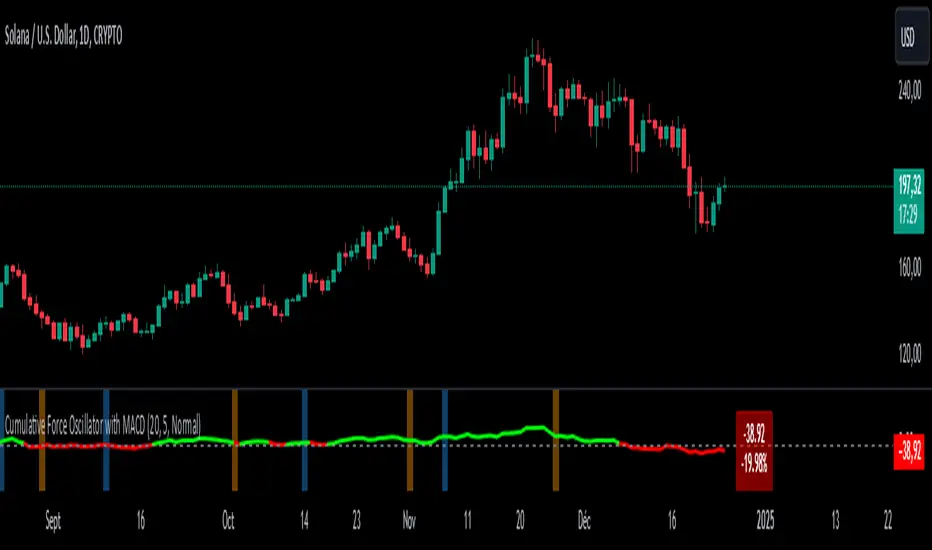
Cumulative Force Oscillator with MACDCumulative Force Oscillator with MACD
The Cumulative Force Oscillator with MACD is an advanced technical indicator designed to provide traders with a unique perspective on market momentum and trend strength. By combining the power of cumulative candle force analysis with MACD crossover signals, this indicator offers a multifaceted approach to market analysis.
Key Features
1. Cumulative Force Calculation**: Measures the net force of price movements over a specified number of candles.
2. MACD Integration**: Incorporates MACD crossover signals for additional trend confirmation.
3. Visual Cues**: Utilizes color-coded oscillator lines and background zones for easy interpretation.
4. **Dynamic Labeling**: Displays real-time force values and percentage changes.
How It Works
Cumulative Force Calculation
The indicator calculates the "force" of each candle by subtracting the open price from the close price. It then sums this force over a user-defined number of candles to create a cumulative force value. This value oscillates above and below zero, indicating bullish or bearish pressure respectively.
MACD Crossover Detection
The indicator uses the standard MACD (12, 26, 9) to detect bullish and bearish crossovers. These crossovers are visually represented by colored background zones, providing an additional layer of trend confirmation.
Visual Representation
- The main oscillator line is plotted in green when above zero (bullish) and red when below zero (bearish).
- Background colors change based on MACD crossovers: light blue for bullish crossovers and light orange for bearish crossovers.
- A dynamic label displays the current cumulative force value and its percentage change from the previous period.
Interpretation
1. Oscillator Line : When the line is above zero, it indicates net bullish pressure; below zero suggests net bearish pressure.
2. Oscillator Momentum : The steepness and direction of the oscillator line indicate the strength and direction of the current market force.
3. MACD Crossovers : Blue background zones suggest potential bullish trends, while orange zones indicate potential bearish trends.
4. Divergences : Look for divergences between the oscillator and price action for potential trend reversal signals.
Customization
Users can customize several aspects of the indicator :
- Number of candles for force calculation
- Label offset and text size
- Color schemes (through code modification)
Conclusion
The Cumulative Force Oscillator with MACD is a versatile tool that combines momentum analysis with trend confirmation signals. By providing a visual representation of cumulative market force alongside MACD crossovers, it offers traders a comprehensive view of market dynamics. This indicator can be particularly useful for identifying potential trend reversals, confirming existing trends, and gauging overall market strength.
Multi-Feature IndicatorThe Multi-Feature Indicator combines three popular technical analysis tools — RSI, Moving Averages (MA), and MACD — into a single indicator to provide unified buy and sell signals. This script is designed for traders who want to filter out noise and focus on signals confirmed by multiple criteria.
Features:
RSI (Relative Strength Index):
Measures momentum and identifies overbought (70) and oversold (30) conditions.
A signal is triggered when RSI crosses these thresholds.
Moving Averages (MA):
Uses a short-term moving average (default: 9 periods) and a long-term moving average (default: 21 periods).
Buy signals occur when the short-term MA crosses above the long-term MA, indicating an uptrend.
Sell signals occur when the short-term MA crosses below the long-term MA, indicating a downtrend.
MACD (Moving Average Convergence Divergence):
A trend-following momentum indicator that shows the relationship between two moving averages of an asset's price.
Signals are based on the crossover of the MACD line and its signal line.
Unified Buy and Sell Signals:
Buy Signal: Triggered when:
RSI crosses above 30 (leaving oversold territory).
Short-term MA crosses above the long-term MA.
MACD line crosses above the signal line.
Sell Signal: Triggered when:
RSI crosses below 70 (leaving overbought territory).
Short-term MA crosses below the long-term MA.
MACD line crosses below the signal line.
Visualization:
The indicator plots the short-term and long-term moving averages on the price chart.
Green "BUY" labels appear below price bars when all buy conditions are met.
Red "SELL" labels appear above price bars when all sell conditions are met.
Parameters:
RSI Length: Default is 14. This controls the sensitivity of the RSI.
Short MA Length: Default is 9. This determines the short-term trend.
Long MA Length: Default is 21. This determines the long-term trend.
Use Case:
The Multi-Feature Indicator is ideal for traders seeking higher confirmation before entering or exiting trades. By combining momentum (RSI), trend (MA), and momentum shifts (MACD), it reduces false signals and enhances decision-making.
How to Use:
Apply the indicator to your chart in TradingView.
Look for "BUY" or "SELL" signals, which appear when all conditions align.
Use this tool in conjunction with other analysis techniques for best results.
Note:
The default settings are suitable for many assets, but you may need to adjust them for different timeframes or market conditions.
This indicator is meant to assist in trading decisions and should not be used as the sole basis for trading.

[blackcat] L2 Enhanced MACD Trend█ OVERVIEW
The Enhanced MACD Trend script combines traditional Moving Average Convergence Divergence (MACD) analysis with On-Balance Volume (OBV) insights to provide traders with a comprehensive understanding of market trends. By examining both price momentum and volume fluctuations, this tool aids in identifying potential upward or downward market transitions.
█ LOGICAL FRAMEWORK
Initially, the script prompts users to configure fundamental parameters such as the speed of moving averages. It subsequently utilizes a specialized auxiliary function named calculate_macd_obv_signals to perform intricate computations. This function calculates the discrepancy between two distinct types of moving averages (captured via MACD analysis), evaluates the direction of capital inflows and outflows within securities (using OBV), and applies smoothing techniques to mitigate undue influence from minor fluctuations. Ultimately, visual representations of these calculations are rendered on an additional chart pane for enhanced interpretability.
█ CUSTOM FUNCTIONS
Function: calculate_macd_obv_signals
• Purpose: Determines critical aspects associated with MACD and OBV.
• Parameters:
• fastLength (int): Dictates the responsiveness of the shorter Exponential Moving Average (EMA) to price variations.
• slowLength (int): Specifies the reactivity of the longer EMA.
• signalSmoothing (int): Defines the degree of smoothness applied to the divergence between EMAs.
• Functionality:
• macd_diff: Illustrates whether price increases have accelerated relative to previous levels or decelerated, providing insight into existing momentum.
• macd_signal_line: Smoothens macd_diff values, serving akin to a trailing indicator for macd_diff.
• macd_histogram: Visually accentuates disparities between macd_diff and macd_signal_line employing color-coded bars, facilitating identification of significant divergences.
• obv_signal: Represents a refined variant of short-term OBV concentrating solely on periods characterized by elevated buying interest, aiding in reduction of extraneous signals.
• moving_average_short: Analyzes recent closing prices across several sessions to corroborate burgeoning bullish or bearish tendencies.
• Returns: An array encompassing .
█ KEY POINTS AND TECHNIQUES
Advanced Features: Employs sophisticated functions including ta.ema() and ta.sma(), enabling accurate calculation of EMAs and SMAs respectively, thus enhancing precision in trend detection.
Optimization Techniques: Incorporates customizable inputs (input.int) permitting strategic adjustments alongside scrutiny of escalating or declining volumes to accurately gauge genuine sentiment shifts while discounting insignificant anomalies.
Best Practices: Maintains separation between algorithmic processes and graphical outputs, preserving organizational clarity; hence simplifying debugging efforts and future enhancements.
Unique Approaches: Integrates multifaceted assessments simultaneously – amalgamating candlestick formations and volumetric activities – offering a holistic perspective instead of reliance on singular indicators. Consequently, delivers astute recommendations grounded in diverse analytical underpinnings rather than speculative forecasts.
█ EXTENDED KNOWLEDGE AND APPLICATIONS
Potential Modifications:
1 — Implement automated alert mechanisms signaling crossover events pinpointing optimal buy/sell junctures to fine-tune timing preemptively minimizing losses proactively.
2 — Enable user customization of sensitivity criteria governing trigger intensity thereby eliminating trivial aberrations and emphasizing substantial patterns exclusively.
Application Scenarios:
Beneficial for high-frequency trading aiming to capitalize on fleeting price movements swiftly. Suitable for dynamic environments necessitating rapid responses due to frequent market volatility demanding prompt reactions. Perfect for individuals engaging in regular transactions seeking unparalleled accuracy navigating fluctuating circumstances ensuring consistent profitability amidst disturbances maintaining steady yields irrespective of upheavals.
Related Concepts:
Contemplate interactions among oscillators (such as MACD) and volume metrics detecting instances wherein they oppose each other (indicative of divergences) or concur (signaling crossovers). Profound comprehension of these interrelationships substantially refines trading strategies integrating broader economic factors, seasonal influences guiding overarching plans resulting in heightened predictive capabilities elevating trading effectiveness leveraging cumulative information transforming unprocessed statistics into actionable intelligence empowering informed decisions advancing confidently toward objectives effortlessly scaling achievements seamlessly realizing aspirations effortlessly.

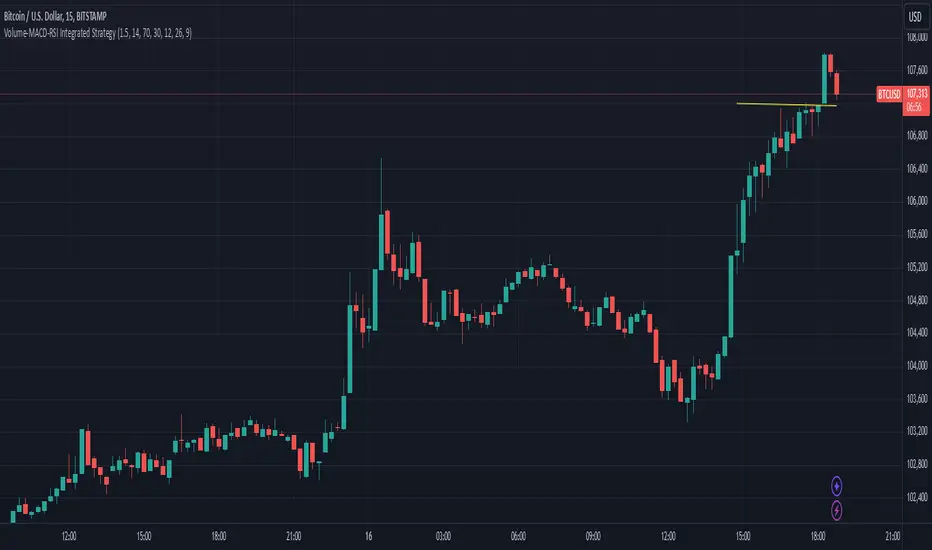
Volume-MACD-RSI Integrated StrategyDescription:
This script integrates three well-known technical analysis tools—Volume, MACD, and RSI—into a single signal meant to help traders identify potential turning points under strong market conditions.
Concept Overview:
Volume Filter: We compare the current bar’s volume to a 20-period volume average and require it to exceed a specified multiplier. This ensures that signals occur only during periods of heightened market participation. The logic is that moves on low volume are less reliable, so we wait for increased activity to confirm potential trend changes.
MACD Momentum Shift:
We incorporate MACD crossovers to determine when momentum is changing direction. MACD is a popular momentum indicator that identifies shifts in trend by comparing short-term and long-term EMAs. A bullish crossover (MACD line crossing above the signal line) may suggest upward momentum is building, while a bearish crossunder can indicate momentum turning downward.
RSI Market Condition Check:
RSI helps us identify overbought or oversold conditions. By requiring that RSI be oversold on buy signals and overbought on sell signals, we attempt to pinpoint entries where price could be at an extreme. The idea is to position entries or exits at junctures where price may be due for a reversal.
How the Script Works Together:
Volume Confirmation: No signals fire unless there’s strong volume. This reduces false positives.
MACD Momentum Check: Once volume confirms market interest, MACD crossover events serve as a trigger to initiate consideration of a trade signal.
RSI Condition: Finally, RSI determines whether the market is at an extreme. This final layer helps ensure we only act on signals that have both momentum shift and a price at an extreme level, potentially increasing the reliability of signals.
Intended Use:
This script can help highlight potential reversal points or trend shifts during active market periods.
Traders can use these signals as a starting point for deeper analysis. For instance, a “BUY” arrow may prompt a trader to investigate the market context, confirm with other methods, or look for patterns that further support a long entry.
The script is best used on markets with reliable volume data, such as stocks or futures, and can be experimented with across different timeframes. Adjusting the RSI thresholds, MACD parameters, and volume multiplier can help tailor it to specific instruments or trading styles.
Chart Setup:
When adding this script to your chart, it should be the only indicator present, so you can clearly see the red “BUY” arrows and green “SELL” arrows at the candle closes where signals occur.
The chart should be kept clean and uncluttered for clarity. No other indicators are necessary since the logic is already integrated into this single script.
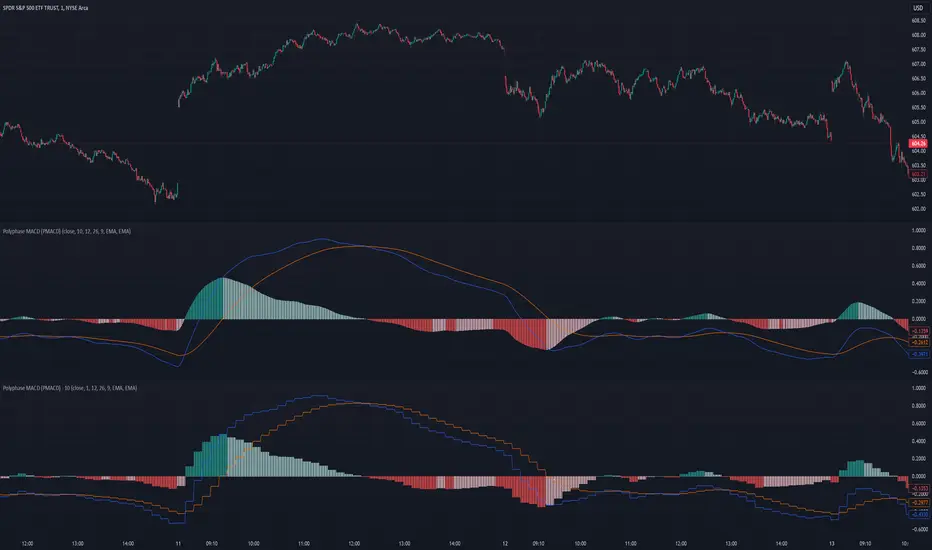
Polyphase MACD (PMACD)The Polyphase MACD (PMACD) uses polyphase decimation to create a continuous estimate of higher timeframe MACD behavior. The number of phases represents the timeframe multiplier - for example, 3 phases approximates a 3x higher timeframe.
Traditional higher timeframe MACD indicators update only when each higher timeframe bar completes, creating stepped signals that can miss intermediate price action. The PMACD addresses this by maintaining multiple phase-shifted MACD calculations and combining them with appropriate anti-aliasing filters. This approach eliminates the discrete jumps typically seen in higher timeframe indicators, though the resulting signal may sometimes deviate from the true higher timeframe values due to its estimative nature.
The indicator processes price data through parallel phase calculations, each analyzing a different time-offset subset of the data. These phases are filtered and combined to prevent aliasing artifacts that occur in simple timeframe conversions. The result is a smooth, continuous signal that begins providing meaningful values immediately, without requiring a warm-up period of higher timeframe bars.
The PMACD maintains the standard MACD components - the MACD line (fast MA - slow MA), signal line, and histogram - while providing a more continuous view of higher timeframe momentum. Users can select between EMA and SMA calculations for both the oscillator and signal components, with all calculations benefiting from the same polyphase processing technique.