DiNapoli MACD & Stoch [LazyBear] --- Updated: May 19 2015 ----
Applicable only If you are setting up alerts:
I noticed I have switched the plot names. Histo shd be the MACD and DMACD shd be the Signal.
Replace lines 16 & 17 with these to get the correct names. NOTE that no functionality is affected, just the names.
plot(r, style=columns, color=r>0?green:red, transp=80, title="Dinapoli MACD")
plot(s, color=teal, linewidth=2, title="Trigger")
--- Original Description ---
These two indicators are from one of my favorite books - DiNapoli's Levels. These are custom MACD and Stoch used by him. There are more indicators - Detrended Osc, DisplacedMA - that he uses, will publish them all later.
The settings of normal MACD/Stoch can be tuned to obtain these DiNapoli indicators, or if you are lazy (like me!) just use these :)
DiNapoli Preferred Stoch source: pastebin.com
More info:
www.amazon.com
List of my public indicators: bit.ly
List of my app-store indicators: blog.tradingview.com
Cerca negli script per "MACD"

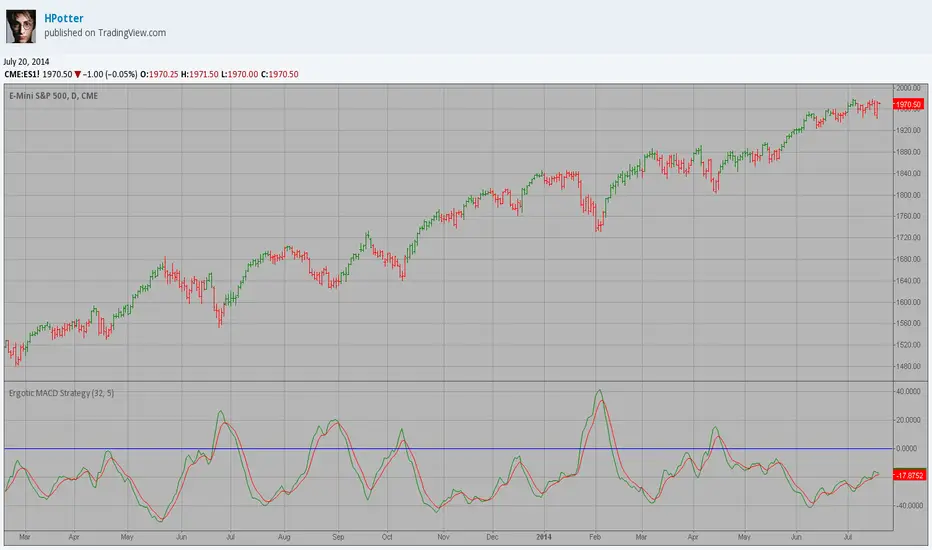
Ergotic MACD Strategy This is one of the techniques described by William Blau in his book
"Momentum, Direction and Divergence" (1995). If you like to learn more,
we advise you to read this book. His book focuses on three key aspects
of trading: momentum, direction and divergence. Blau, who was an electrical
engineer before becoming a trader, thoroughly examines the relationship
between price and momentum in step-by-step examples. From this grounding,
he then looks at the deficiencies in other oscillators and introduces some
innovative techniques, including a fresh twist on Stochastics. On directional
issues, he analyzes the intricacies of ADX and offers a unique approach to help
define trending and non-trending periods.
Blau`s indicator is like usual MACD, but it plots opposite of meaningof
stndard MACD indicator.
Ergotic MACD This is one of the techniques described by William Blau in his book
"Momentum, Direction and Divergence" (1995). If you like to learn more,
we advise you to read this book. His book focuses on three key aspects
of trading: momentum, direction and divergence. Blau, who was an electrical
engineer before becoming a trader, thoroughly examines the relationship
between price and momentum in step-by-step examples. From this grounding,
he then looks at the deficiencies in other oscillators and introduces some
innovative techniques, including a fresh twist on Stochastics. On directional
issues, he analyzes the intricacies of ADX and offers a unique approach to help
define trending and non-trending periods.
Blau`s indicator is like usual MACD, but it plots opposite of meaningof
stndard MACD indicator.

Indicators: Volume-Weighted MACD Histogram & Sentiment Zone OscVolume-Weighted MACD Histogram
-------------------------------------------------------------------------------------
Volume-Weighted MACD Histogram, first discussed by Buff Dormeier, is a modified version of MACD study. It calculates volume-averaged Close price for finding the histogram.
More info:
www.moneyshow.com
Sentiment Zone Oscillator
-------------------------------------------------------------------------------------
Sentiment Zone Oscillator, developed by Walid Khalil, is a complementing oscillator to VZO and PZO.
To quote Walid:
>> The sentiment zone oscillator (SZO) is a leading contrary oscillator that measures the extreme emotions of a single market or share.
>> It measures and defines both extremes, bullishness (overoptimism) and bearishness (overpessimism), that could lead to a change
>> in sentiment, eventually changing the trend of the time frame under study. The SZO was devised on the belief that after several waves
>> of rising prices, investors begin to get bullish on the stock with increasing confidence since the price has been rising for some time.
>> The SZO measures that bullishness/bearishness and marks overbought/oversold levels.
SZO has its own oversold/overbought bands. Also, when SZO goes above 7, it indicates extreme optimism. When the SZO goes below -7, it indicates extreme pessimism.
More info: www.traders.com
How to import / use custom indicators from this chart?
-------------------------------------------------------------------------------------
PDF: drive.google.com

MACD Buy E Sell EditavelMacd personalizavel com sell para cruzamento de venda e buy para cruzamento de compra


MACD + EMA200 MTF - WEBHOOK FIXEDHi guys, works best with USDCHF
Default settings fit for me, you can tweak how much you want.
With default settings works well for 15min and 1min time-frame, for other time-frames, you need to tweak.

CMF, RSI, CCI, MACD, OBV, Fisher, Stoch RSI, ADX (+DI/-DI)Eight normalized indicators are used in conjunction with the CMF, CCI, MACD, and Stoch RSI indicators. You can track buy and sell decisions by tracking swings. The zero line is for reversal tracking at -20, +20, +50, and +80. You can use any of the nine indicators individually or in combination.

MACD 4H Cross Above Zero AlertMACD 4H Cross the signal line to screen for stocks across a wide demo list

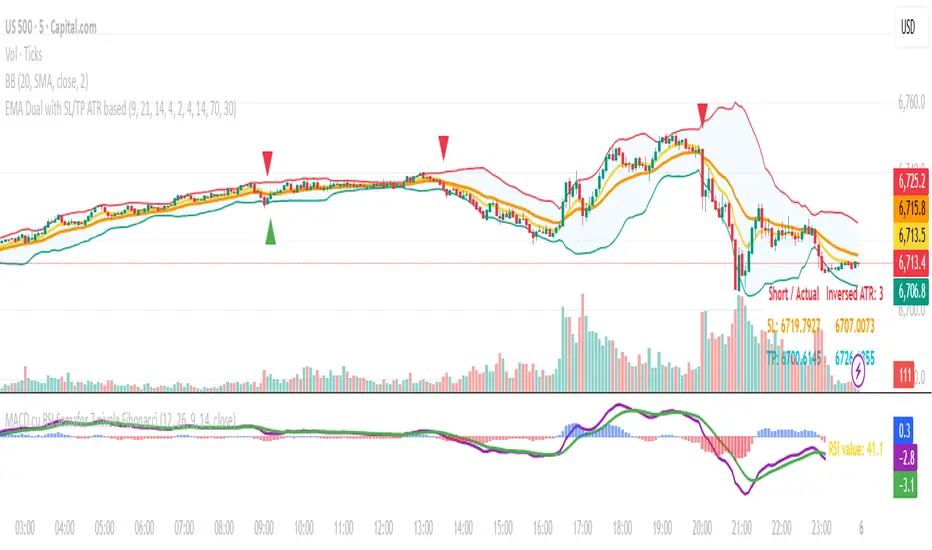
MACD cu RSI 7 Fibonacci color levelsMACD with RSI info
The RSI is display as value with changing color as Fibonacci levels.
MACD with RSI color 7 Fibonacci levelsMACD that contain RSI info
The color of RSI is change accordingly with Fibonacci levels, from red till green

HULL MACDThis MACD modification uses a fast HULL MA instead of the regular one. Also includes 2 horizontal lines. When using it on a daily timeframe the lower borders should be used for guidance to know when the market has gone too far away from the average price and thus a reversal might happen.
On smaller timeframes the dotted lines can be used for this purpose.

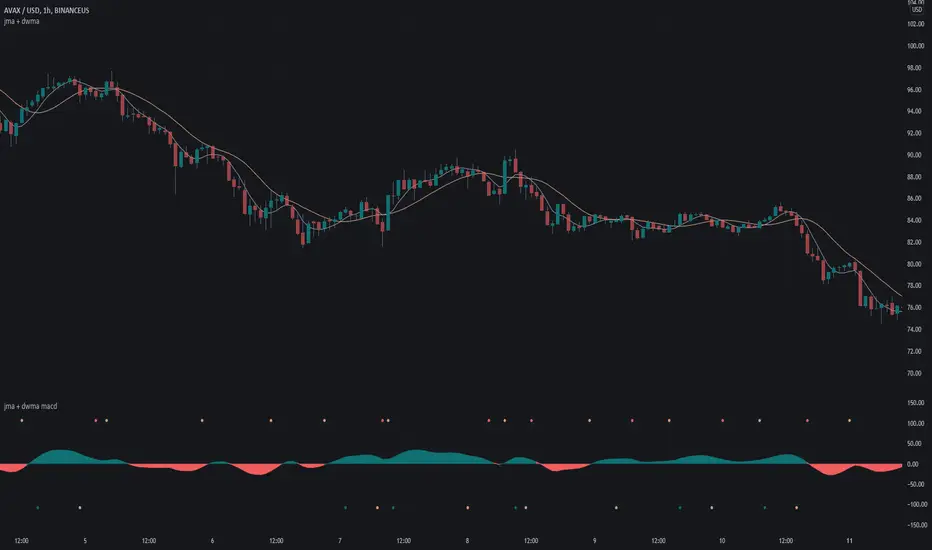
jma + dwma macdThis MACD system was originally conceptualized by Jurik Research and made public to the world on their website .
The indicator consists of the faster Jurik Moving Average ( JMA ) and the slower Double Weighted Moving Average (DWMA). A long signal (green dot at the bottom) is shown when the JMA line crosses above the DWMA line (indicating a possible reversal in trend). A short signal (red dot at the top) is shown when the JMA line crosses below the DWMA line. Take profit signals (tan dot at the top/bottom) are shown when the JMA line reverses directions. Alerts for signals are included in this indicator.
The default settings are not optimized for any timeframe.
For an overlay version of this script, please see the following:
Credit to @everget for the re-creation of the Jurik Moving Average in pinescript.
MACD+RSI by NiksMACD and RSI combined in one indicator. This is to allow you to add more than 3 indicators in free version of Trading view

Full Crypto Swing Strategy ALMA Cross with MACDThis is a full crypto swing strategy designed.
From my testing it looks like it perform the best on timeframes 4h +.
The below example has been adapted to BNB/USDT, using the entire period since 2017 until present day, with a comission of 0.03% ( which is the comission for the futures on binance).
Its components are :
ALMA Fast
ALMA Slow
MACD Histogram
Rules for entry
For long, we have a crossover of the fast alma with the slow one and the histogram is ascending.
For short, we have a crossunder of the fast alma with the slow one and the histogram is descending.
Rules for exit
We exit based on a risk management system for TP and SL, or when we receive an opposite condition than the initial one.
Regarding risk management
0.05 = 5% movement
2 = 200% movement
0.001 = 0.1% movement
If you have any questions, let me know !


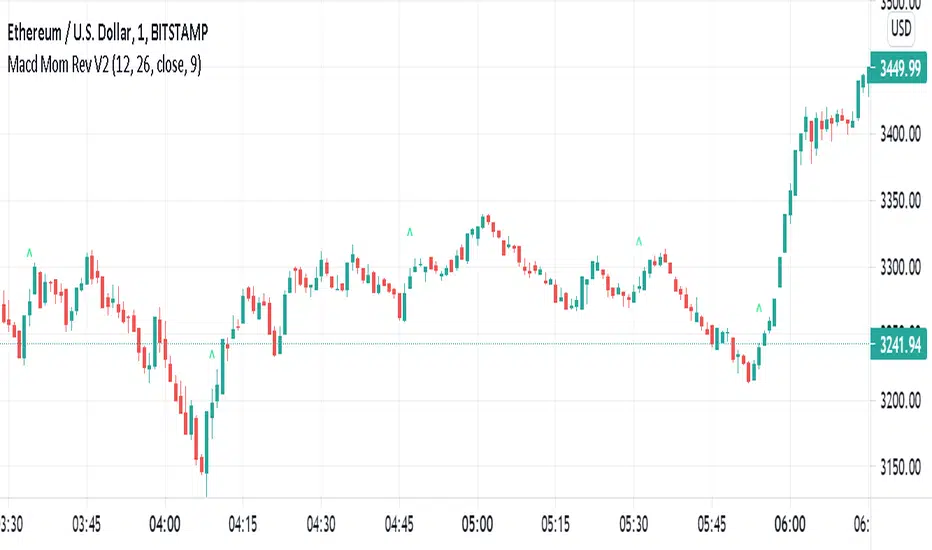
Simple Macd Momentum Reversal IndicatorThis Simple indicator uses the MACD history to check trend reversals. It primarily check if the histogram has moved up from a downtrend above a certain margin. If it has, it places a green B on the chart. If you were to use/improve this indicator, please use it with other indicators to confirm your position. This is NOT an indicator that can be well used alone.
macZLSMAMacd that shows instantaneous trend using ZLSMA. This crossover has the ability to reveal trend directions before it happens.

GSO + RSI + MACD + MFI + Bollinger BandsThis script uses a Gann Swing Oscillator , RSI , MACD , MFI and Bollinger Bands to generate long and short signals for cryptocurrencies on the 5 minute chart.
The Gann Swing Oscillator was inspired by HPotter's GSO.
This script is for educational purposes only. This script is NOT to be used as financial advice. I will not accept liability for any losses which may occur as a result of using this script.

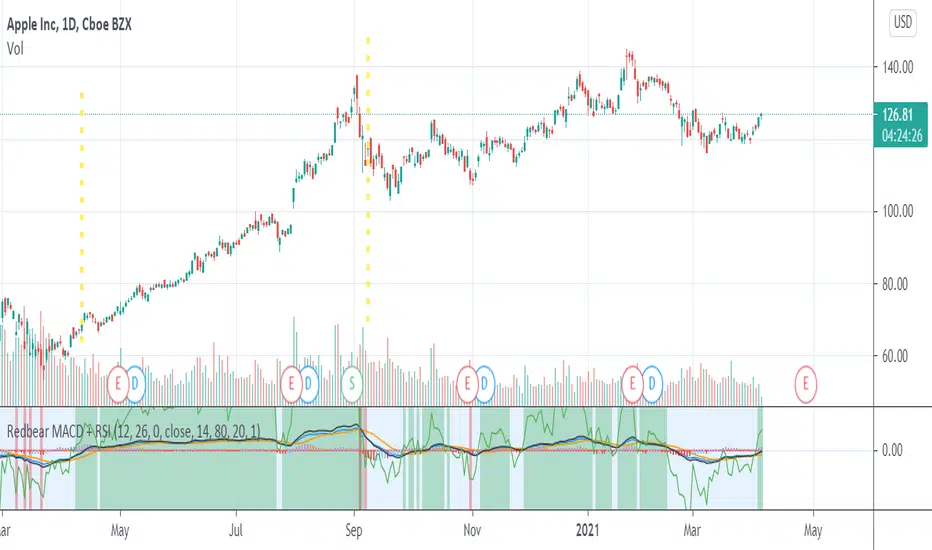
Redbear MACD + RSIHello . I make script that combine MACD and RSI
Green area is BUY SELL signal when rsi >45
you can custom parameter .
Log MACDThis is just a MACD indicator using the log of the closing price rather than the normal closing price. Useful for exponentially growing stocks and cryptocurrency.


RSI of MACD Strategy [Long only]This strategy uses the RSI on MACD indicator.
BUY
====
When RSI indicator crossing over 30 or 35 line and price above slow ema
Note: when the position already taken, you may reenter on the purple candle
Partial Exit
==========
Partial profit taking option is available in settings. If this is selected , 1/3 position exited when RSI indicator crossing down 80 line
Close
=====
When RSI indicator crossing below 15
Stop Loss
=========
I havent used hard stop loss in this strategy. Reason is , when price going down , indicator may go up ... so just wanted to ride along with indicator ...
Stop loss mentioned in the settings is used in calculation of how many units can be be purchased based on risk level
Tested with SPY and QQQ ETFs on hourly chart
Warning
=========
For the eductional purposes only ...
This is not a financial advise. please do your own research before taking any trading decission
