Gold/Silver RatioOverview
This indicator displays the Gold/Silver Ratio by dividing the price of gold (XAUUSD) by the price of silver (XAGUSD) on the same timeframe. It is a widely used tool in macroeconomic and precious metals analysis, helping traders and investors evaluate the relative value of gold compared to silver.
📈 What it does
Plots the ratio between gold and silver prices as a line on the chart.
Displays two key horizontal levels:
Overbought level at 90 (dashed red line).
Oversold level at 70 (dashed green line).
Highlights the chart background to show extreme conditions:
Red shading when the ratio exceeds 90 (gold is likely overvalued relative to silver).
Green shading when the ratio drops below 70 (silver is likely overvalued relative to gold).
🧠 How to Use
When the ratio exceeds 90, it suggests that gold may be overbought or silver may be undervalued. Historically, these have been good times to consider shifting exposure from gold to silver.
When the ratio falls below 70, it may indicate silver is overbought or gold is undervalued.
This tool is best used in conjunction with technical analysis, macroeconomic trends, or RSI/Bollinger Bands applied to the ratio.
⚙️ Inputs
This version of the script uses OANDA's XAUUSD and XAGUSD pairs for spot gold and silver prices. You may edit the request.security() calls to change data sources (e.g., FXCM, FOREXCOM, or CFD tickers from your broker).
✅ Best For:
Macro traders
Commodity investors
Ratio and spread traders
Long-term portfolio reallocators
Cerca negli script per "META股价历史数据"

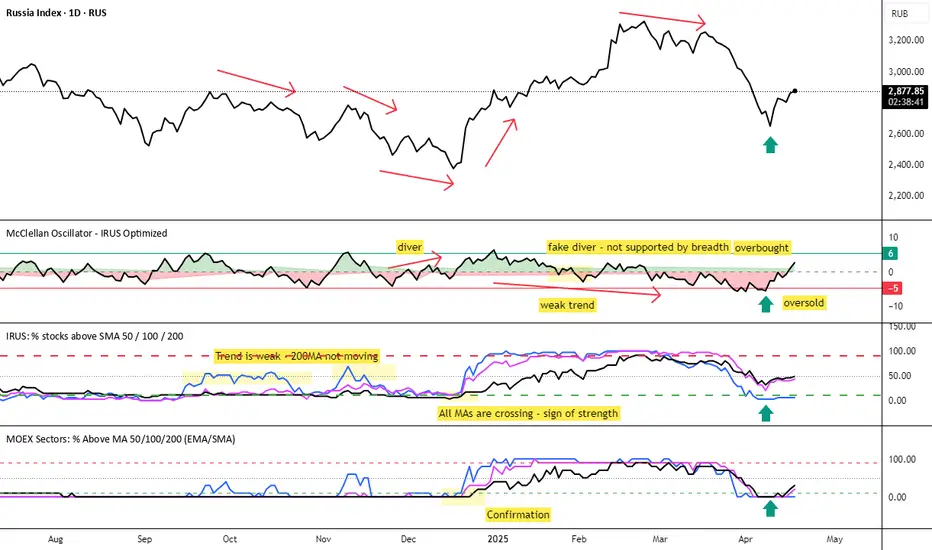
MOEX Sectors: % Above MA 50/100/200 (EMA/SMA)🧠 Name:
MOEX Sectors: % Above MA 50/100/200 (EMA/SMA)
📋 Description (for TradingView “Description” tab):
This indicator shows the percentage of Moscow Exchange sectoral indices trading above the selected moving average (SMA or EMA) with periods of 50, 100, or 200.
It uses 10 official MOEX sector indices:
MOEXOG (Oil & Gas)
MOEXCH (Chemicals)
MOEXMM (Metals & Mining)
MOEXTN (Transport)
MOEXCN (Consumer)
MOEXFN (Financials)
MOEXTL (Telecom)
MOEXEU (Utilities)
MOEXIT (IT)
MOEXRE (Real Estate)
The indicator plots up to 3 lines representing the % of sectors trading above MA 50, 100, and/or 200. The MA type is user-selectable: EMA (default) or SMA.
Horizontal reference levels (90, 50, 10) help interpret market conditions:
🔼 >90% — Overbought zone, potential market exhaustion
⚖️ ~50% — Neutral state
🔽 <10% — Oversold zone, possible rebound
📈 How to Use in Strategy:
✅ 1. Trend Filter
If >50% of sectors are above MA 200 → market in long-term uptrend
If <50% → avoid long bias, bearish regime likely
✅ 2. Bottom Detection
When <10% of sectors are above MA 200, the market is heavily oversold — often a bottoming signal
✅ 3. Trend Confirmation
If the main index is rising and % of sectors above MA is growing, the trend is supported by breadth
If the index rises while breadth declines → bearish divergence
✅ 4. Contrarian Setups
>90% of sectors above MA 50 → market may be overheated, watch for pullback
<20% above MA 50 → potential local bottom
⚙️ Tips:
Overlay this indicator on the IMOEX index chart to detect narrow leadership
Combine with other breadth metrics or RSI on the index
Use the EMA/SMA toggle to fine-tune sensitivity
Economic Crises by @zeusbottradingEconomic Crises Indicator by @zeusbottrading
Description and Use Case
Overview
The Economic Crises Highlight Indicator is designed to visually mark major economic crises on a TradingView chart by shading these periods in red. It provides a historical context for financial analysis by indicating when major recessions occurred, helping traders and analysts assess the performance of assets before, during, and after these crises.
What This Indicator Shows
This indicator highlights the following major economic crises (from 1953 to 2020), which significantly impacted global markets:
• 1953 Korean War Recession
• 1957 Monetary Tightening Recession
• 1960 Investment Decline Recession
• 1969 Employment Crisis
• 1973 Oil Crisis
• 1980 Inflation Crisis
• 1981 Fed Monetary Policy Recession
• 1990 Oil Crisis and Gulf War Recession
• 2001 Dot-Com Bubble Crash
• 2008 Global Financial Crisis (Great Recession)
• 2020 COVID-19 Recession
Each of these periods is shaded in red with 80% transparency, allowing you to clearly see the impact of economic downturns on various financial assets.
How This Indicator is Useful
This indicator is particularly valuable for:
✅ Comparative Performance Analysis – It allows traders and investors to compare how different assets (e.g., Gold, Silver, S&P 500, Bitcoin) performed before, during, and after major economic crises.
✅ Identifying Market Trends – Helps recognize recurring patterns in asset price movements during times of financial distress.
✅ Risk Management & Strategy Development – Understanding how markets reacted in the past can assist in making better-informed investment decisions for future downturns.
✅ Gold, Silver & Bitcoin as Safe Havens – Comparing precious metals and cryptocurrencies against traditional stocks (e.g., SPY) to analyze their performance as hedges during economic turmoil.
How to Use It in Your Analysis
By overlaying this indicator on your Gold, Silver, SPY, and Bitcoin chart (for example), you can quickly spot historical market reactions and use that insight to predict possible behaviors in future downturns.
⸻
How to Apply This in TradingView?
1. Click on Use on chart under the image.
2. Overlay it with Gold ( OANDA:XAUUSD ), Silver ( OANDA:XAGUSD ), SPY ( AMEX:SPY ), and Bitcoin ( COINBASE:BTCUSD ) for comparative analysis.
⸻
Conclusion
This indicator serves as a powerful historical reference for traders analyzing asset performance during economic downturns. By studying past crises, you can develop a data-driven investment strategy and improve your market insights. 🚀📈
Let me know if you need any modifications or enhancements!

Shavarie's MCV IndicatorShavarie's MCV Indicator (MACD + CCI + Volume Delta) is a custom-built trend-following and volume-based indicator that helps traders confirm market direction with high accuracy. It combines the MACD (Moving Average Convergence Divergence), CCI (Commodity Channel Index), and Volume Delta, ensuring that all three indicators align before making a trading decision. The goal is to filter out false signals and provide high-probability trade setups.
History & Development
Shavarie's MCV Indicator was developed by Shavarie Gordon, an experienced swing trader, to improve trend confirmation on Gold (XAUUSD) and other markets. After testing various indicators, Shavarie discovered that MACD, CCI, and Volume Delta together provide the best combination of trend strength, momentum, and real-time volume flow. This indicator was designed to eliminate lagging signals, improve win rates, and enhance market timing for both swing and scalping strategies.
How It Works & Calculations
MACD (Moving Average Convergence Divergence)
Measures momentum and trend strength using the difference between a 12-period EMA and a 26-period EMA.
The MACD line and Signal line crossover confirms buy/sell signals.
A rising MACD histogram confirms bullish strength, while a falling histogram confirms bearish strength.
CCI (Commodity Channel Index)
Measures how far the price is from its statistical average.
Above +100 → Overbought (strong trend continuation or reversal).
Below -100 → Oversold (strong trend continuation or reversal).
When CCI aligns with MACD, it confirms momentum strength.
Volume Delta
Measures the difference between buying and selling volume in real time.
A positive delta means more aggressive buying (bullish).
A negative delta means more aggressive selling (bearish).
Helps confirm MACD and CCI trends by showing real volume strength.
Key Takeaways & Features
✅ No false signals: All three indicators must align before entering a trade.
✅ Trend confirmation: Ensures momentum and volume agree before trading.
✅ Works on multiple timeframes: Designed for swing trading on the daily and scalping on 45 min + 5 min.
✅ Great for Gold & Metals: Optimized for XAUUSD, XAUJPY, XAU/AUD, and possibly Palladium (XPDUSD).
✅ Custom-built by a professional trader: Developed by Shavarie Gordon after extensive testing.
Summary
Shavarie’s MCV Indicator is a powerful and reliable trading tool that combines momentum, trend, and volume analysis. By ensuring that MACD, CCI, and Volume Delta align, it eliminates false signals and increases trade accuracy. Whether used for swing trading or scalping, this indicator helps traders enter high-probability trades with confidence.

Volatility IndicatorThe volatility indicator presented here is based on multiple volatility indices that reflect the market’s expectation of future price fluctuations across different asset classes, including equities, commodities, and currencies. These indices serve as valuable tools for traders and analysts seeking to anticipate potential market movements, as volatility is a key factor influencing asset prices and market dynamics (Bollerslev, 1986).
Volatility, defined as the magnitude of price changes, is often regarded as a measure of market uncertainty or risk. Financial markets exhibit periods of heightened volatility that may precede significant price movements, whether upward or downward (Christoffersen, 1998). The indicator presented in this script tracks several key volatility indices, including the VIX (S&P 500), GVZ (Gold), OVX (Crude Oil), and others, to help identify periods of increased uncertainty that could signal potential market turning points.
Volatility Indices and Their Relevance
Volatility indices like the VIX are considered “fear gauges” as they reflect the market’s expectation of future volatility derived from the pricing of options. A rising VIX typically signals increasing investor uncertainty and fear, which often precedes market corrections or significant price movements. In contrast, a falling VIX may suggest complacency or confidence in continued market stability (Whaley, 2000).
The other volatility indices incorporated in the indicator script, such as the GVZ (Gold Volatility Index) and OVX (Oil Volatility Index), capture the market’s perception of volatility in specific asset classes. For instance, GVZ reflects market expectations for volatility in the gold market, which can be influenced by factors such as geopolitical instability, inflation expectations, and changes in investor sentiment toward safe-haven assets. Similarly, OVX tracks the implied volatility of crude oil options, which is a crucial factor for predicting price movements in energy markets, often driven by geopolitical events, OPEC decisions, and supply-demand imbalances (Pindyck, 2004).
Using the Indicator to Identify Market Movements
The volatility indicator alerts traders when specific volatility indices exceed a defined threshold, which may signal a change in market sentiment or an upcoming price movement. These thresholds, set by the user, are typically based on historical levels of volatility that have preceded significant market changes. When a volatility index exceeds this threshold, it suggests that market participants expect greater uncertainty, which often correlates with increased price volatility and the possibility of a trend reversal.
For example, if the VIX exceeds a pre-determined level (e.g., 30), it could indicate that investors are anticipating heightened volatility in the equity markets, potentially signaling a downturn or correction in the broader market. On the other hand, if the OVX rises significantly, it could point to an upcoming sharp movement in crude oil prices, driven by changing market expectations about supply, demand, or geopolitical risks (Geman, 2005).
Practical Application
To effectively use this volatility indicator in market analysis, traders should monitor the alert signals generated when any of the volatility indices surpass their thresholds. This can be used to identify periods of market uncertainty or potential market turning points across different sectors, including equities, commodities, and currencies. The indicator can help traders prepare for increased price movements, adjust their risk management strategies, or even take advantage of anticipated price swings through options trading or volatility-based strategies (Black & Scholes, 1973).
Traders may also use this indicator in conjunction with other technical analysis tools to validate the potential for significant market movements. For example, if the VIX exceeds its threshold and the market is simultaneously approaching a critical technical support or resistance level, the trader might consider entering a position that capitalizes on the anticipated price breakout or reversal.
Conclusion
This volatility indicator is a robust tool for identifying market conditions that are conducive to significant price movements. By tracking the behavior of key volatility indices, traders can gain insights into the market’s expectations of future price fluctuations, enabling them to make more informed decisions regarding market entries and exits. Understanding and monitoring volatility can be particularly valuable during times of heightened uncertainty, as changes in volatility often precede substantial shifts in market direction (French et al., 1987).
References
• Bollerslev, T. (1986). Generalized Autoregressive Conditional Heteroskedasticity. Journal of Econometrics, 31(3), 307-327.
• Christoffersen, P. F. (1998). Evaluating Interval Forecasts. International Economic Review, 39(4), 841-862.
• Whaley, R. E. (2000). Derivatives on Market Volatility. Journal of Derivatives, 7(4), 71-82.
• Pindyck, R. S. (2004). Volatility and the Pricing of Commodity Derivatives. Journal of Futures Markets, 24(11), 973-987.
• Geman, H. (2005). Commodities and Commodity Derivatives: Modeling and Pricing for Agriculturals, Metals and Energy. John Wiley & Sons.
• Black, F., & Scholes, M. (1973). The Pricing of Options and Corporate Liabilities. Journal of Political Economy, 81(3), 637-654.
• French, K. R., Schwert, G. W., & Stambaugh, R. F. (1987). Expected Stock Returns and Volatility. Journal of Financial Economics, 19(1), 3-29.

4AM-5AM BRT HighlighterThe 4AM-5AM BRT Highlighter is a simple yet effective tool designed to visually mark your preferred trading time on the chart. It highlights the period between 4:00 AM and 5:00 AM Brazilian Time (BRT/UTC-3) by default, helping you stay focused and aware of your prime trading window.
Key Features:
Clear Visual Highlight: Colors the background of your chart during the chosen timeframe, making it easy to see when your trading session starts and ends.
Customizable Colors: Easily adjust the highlight color and transparency to suit your visual preferences.
Accurate Time Conversion: Automatically accounts for Brazilian Time (BRT), ensuring the highlight appears correctly no matter your chart’s default timezone.
Whether you're trading currencies, metals, indexes, or cryptocurrencies, this indicator helps you maintain focus during your dedicated trading hour by clearly marking your active period on the chart.

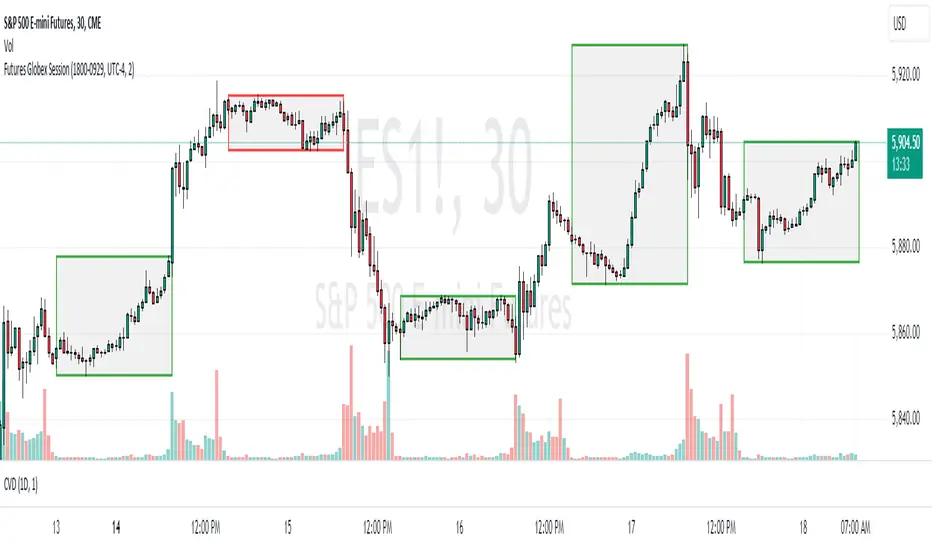
Futures Globex Session(s)This indicator draws a box around the Globex Session for the various Futures markets. The box height defines the highs and lows of that session, and the width defines the timeframe of that session. The boxes are outlined green if price rose during that period, and red if price fell during that period. The default Globex Session is set for the Equity Index Futures and is set in the UTC-4 time zone (Eastern Time). In the settings you can adjust the session time and time zone of your Globex Session to reflect the trading times of that market. Below are the session times for various Futures markets set in time zone UTC-4.
Equity Indexes: 18:00 - 9:30
(ES, NQ, YM, RTY)
Treasuries: 18:00 - 8:20
(ZN, ZB)
Metals: 18:00 - 8:20
(GC)
Energies: 18:00 - 9:00
(CL, NG)
Agricultures: 20:00 - 9:30
(ZS, ZW)
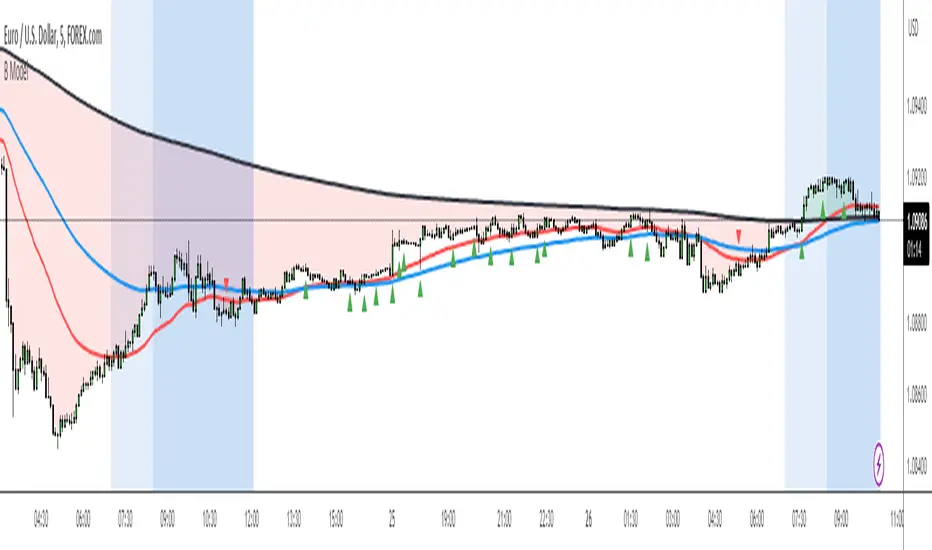
FX Index Curve Oscillator (FICO)We can approximate the TVC:DXY with simple multiplication, rather than using geometric weighted averages; the values will be different, but the charts will look almost the same. Because we can make a "good enough" version of DXY, we can also extend this concept to the other major currencies:
AUD - Yellow
CAD - Red
CHF - Orange
EUR - Purple
GBP - Green
JPY - White
NZD - Lime green
USD - Blue
This indicator works by constructing an "index" for each currency, performing a lookback to figure out the rate of change, and then smoothing the values. These values are fed through an oscillator to normalize them between -1.00 and +1.00, before finally being smoothed again. Interestingly, using HMA to smooth them the second time will cause the values to leak past 1.00, which we can also use as a signal.
If you want to change the values, I find that the biggest difference comes from the lookback and oscillator settings; the MA/smoothing is probably good enough. The default settings are for doing forex trades on the daily chart. Other timeframes are possible, but I could not find any settings that work. It might also be possible to use a similar approach on other assets (crypto, metals, indexes, etc) but I have not tried yet.
In my own testing, what I found to be a good approach is to look for a currency to be above +1 and another to be below -1, and then look for color changes; ideally this will happen on the same bar/candle.
You can also consider two line crosses, breaking above or below 1, etc as other entry signals. I find that price will either move immediately, or take a candle or two to retrace and then start moving.
Happy trading!
Unfortunately, the indicator pane can get quite crowded; if you're testing for a single currency pair, you may want to disable some of the plotted lines:

Engulfing Pattern BUY and SELL SystemThis indicator is based on multiple parameters such as the Open, High, Low, and Close of candles. We add confluences such as SMMA crossovers, engulfing candles, and the number of pips that it has moved from it.
The main parameter is the DFS (Distance from SMMA). This will adjust the number of signals you'll get. This parameter is calculated based on the Open price of the signal bar and the 50 SMMA price. If the difference between these two values is greater than the input value, it will not be considered a signal.
The buy/sell signal consists of the following conditions:
1. Engulfing Candle based on conditions
2. SMMA crossover (21 and 50 periods)
3. For BUYS, the RSI value is greater than 49. For SELLS, the RSI value is less than 51.
4. Open price of the signal bar is less/greater than the 50 SMMA for SELLS/BUYS respectively.
5. DFS value is less than or equal to the input value
We recommend backtesting this on FX Pairs, and metals such as Gold. It is not well suited for Crypto or Indices.
XAUXXXThis simple script is meant to get around the limitations some data providers have, in terms of the length of historical data they choose to provide traders. Inspired by OANDA's XAUCAD pair only having data as far back as 2005, whereas XAUUSD has data back to to the 19th century.
By taking the OHLC data from XAUUSD and multiplying it by the price of USD in a desired currency you are able to see further back in time, the limitation now being the length of FX data available instead of the price of Precious metal / currency pair. As shown in the chart you can now see the price of Gold in CAD as far back as the late 1960s, a nearly half century of data uncovered for all to see!

Correlation AnalysisAs the name suggests, this indicator is a market correlation analysis tool.
It contains two main features:
- The Curve: represents the historic correlation coefficient between the current chart and the “Reference Market” input from the settings menu. It aims to give more depth to the current correlation values found in the second feature.
- The Screener: this second feature displays all correlation coefficient values between the (max) 20 markets inputs. You can use it to create several screeners for several market types (crypto, forex, metals, etc.) or even replicate your current portfolio of investments and gauge the correlation of its components.
Aside from these two previous features, you can visually plot the variation rate from one bar to another along with the covariance coefficient (both used in the correlation calculation). Finally, a simple “signal” moving average can be applied to the correlation coefficient .
I might add alerts to this script or even turn it into a strategy to do some backtesting. Do not hesitate to contact me or comment below if this is something you would be interested in or if you have any suggestions for improvement.
Enjoy!!

AJ's Position Size Calculator for Forex and StocksThis position size/ stop loss and take profit calculator is designed to make entering positions more efficient. In the settings enter your account size and currency. Stop loss and profit levels can be calculated from the ATR or manually. To manually choose stop and profit price, choose manual from the SL or TP Value Type, then enter your price in the boxes below. Lot size or shares will be calculated and displayed on the table to the right of the chart. Position size calculation takes into account any currency exchange rates between your account currency and the quoted currency of the selected ticker. For forex lot sizes the exchange rate for the quoted currency relative to account currency is also built in to get an accurate position size. Enter your brokers leverage and your used margin will be displayed as well. The position size calculator is currently only configured for stocks and forex, I will try to add updates, in the future to other tickers like crypto , precious metals and crude oil CFD's. profit target and stop loss calculator should work for all symbols. I can't guarantee that the output of this calculator is correct. Use at your own risk!

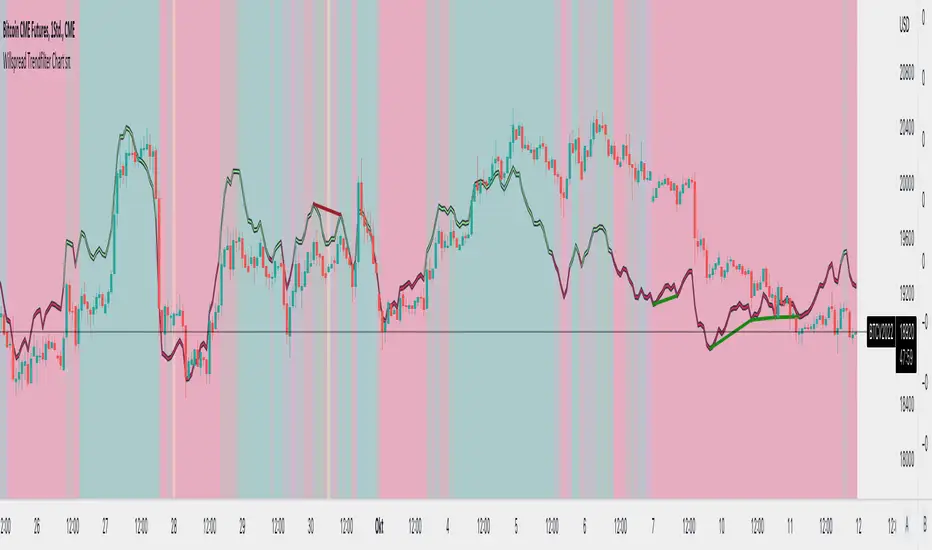
Willspread Chart + POIV & ADVolumen TrendColor sπThe Indicator is a combination of different types of measurements to the Price Action.
1. Spread: The Spread is set to measure your Symbol to another chosen Market like Dollar as Contra . But you can switch also between different markets.
2. Accumulation/Distribution with True Range of High or Low including OpenInterest. This only works with Futures .
--Energies, Metals, Bonds, Softs, Currencies, Livestock, live cattle , feeder cattle, lean hogs , index--
Open Interest for:
ZW, ZC, ZS, ZM, ZL, ZO, ZR, CL, RB, HO, NG, GC, SI, HG, PA, PL, ZN, ZB, ZT, ZF, CC, CT, KC, SB, JO, LB, AUDUSD, GBPUSD, USDCAD, EURUSD, USDJPY, USDCHF, USDMXN, NZDUSD, USDRUB, DX, BTC, ETH, LE, GF, HE, NQ, NDX, ES, SPX, RTY, VIX,
3. Accumulation/Distribution with True Range of High or Low including Volume .
4. The color shows if the Market has positive or negative (Willspread, Volume or Open Interest)
5. The Indicator also shows Divergences to Price and Willspread Movements.
If you want to have more information just give me a message.
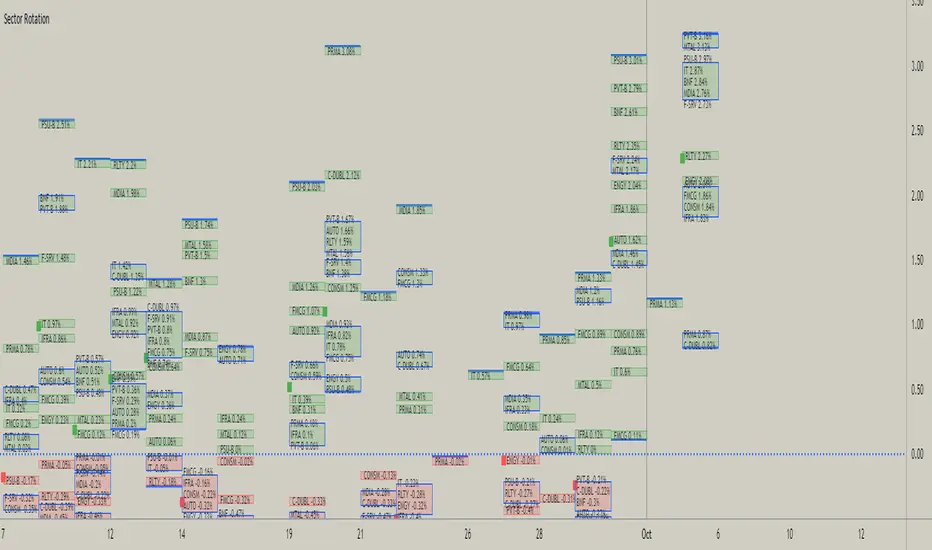
Sector RotationThis script is attempt to create and observe the real-time and historical performance of the all major sectors of Indian Market in one screen.
for Data Presentation I used Short sector names so that I can manage to get space and efficient presentable data.
Short Names and Actual Sector Names
BNF : CNX-BANKNIFTY
IT : CNX-IT
PRMA : CNX - PHARMA
FMCG : CNX-FMCG
AUTO : CNX-AUTO
MTAL : CNX-METAL
MDIA : CNX-MEDIA
RLTY : CNX-REALTY
IFRA : CNX-INFRA
ENGY : CNX-ENERGY
PSU-B : CNX-PSU-BANK
PVT-B : NIFTY-PVT-BANK
F-SRV : CNX-FINANCE
CONSM : CNX-CONSUMPTION
C-DUBL : NIFTY_CONSR_DURBL
You can use this script in 30-min, Daily, Weekly and Monthly Time Frames.
The green Square denotes the current Symbol Performance.
The Blue Border boxes are created when one sector intersects other sector.
In this Update following features are added
Now users have control over sectors, what are all the sectors you wanted to plot you can select from the input menu.
Currently user can highlight any one sector in different border color so that user can easily spot and track particular sector.
This thicker blue line denotes lowest and highest point of the current timeframe.
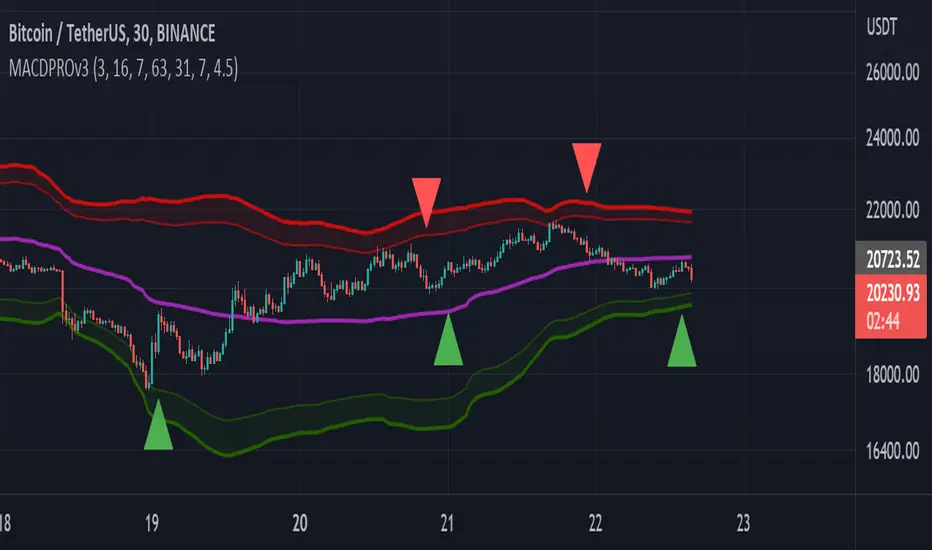
MACDPROThis MACDPRO indicator is based on MACD, RSI, ADX, BB and it has LONG/SHORT alerts for signals
In script settings you can specify:
1) Dispertion value, 3 by default.
2) Noise filter smooth factor, 16 by default.
3) Enable/Disable RSIPROv5 TrendIndicator algorythm
4) Setting RSI Overbought and Oversold values
5) Enable/Disable stop loss and take profit filter for indicator
6) Enable/Disable BB
Best fits for 30-60 min timeframe. Also good for 15min scalping strategy. Fits for any crypto coins, forex, metals, oil and bonds.
This is very powerfull script and will be private soon
Crude Oil: Backwardation Vs ContangoCrude Oil, CL
Plots Futures Curve: Futures contract prices over the next 3.5 years; to easily visualize Backwardation Vs Contango(carrying charge) markets.
Carrying charge (contract prices increasing into the future) = normal, representing the costs of carrying/storage of a commodity. When this is flipped to Backwardation(As the above; contract prices decreasing into the future): it's a bullish sign: Buyers want this commodity, and they want it NOW.
Note: indicator does not map to time axis in the same way as price; it simply plots the progression of contract months out into the future; left to right; so timeframe DOESN'T MATTER for this plot
TO UPDATE (every year or so): in REQUEST CONTRACTS section, delete old contracts (top) and add new ones (bottom). Then in PLOTTING section, Delete old contract labels (bottom); add new contract labels (top); adjust the X in 'bar_index-(X+_historical)' numbers accordingly
This is one of several similar Futures Curve indicators: Meats | Metals | Grains | VIX | Crude Oil
If you want to build from this; to work on other commodities; be aware that Tradingview limits the number of contract calls to 40 (hence the multiple indicators)
Tips:
-Right click and reset chart if you can't see the plot; or if you have trouble with the scaling.
-Right click and add to new scale if you prefer this not to overlay directly on price. Or move to new pane below.
-If this takes too long to load (due to so many security calls); comment out the more distant future half of the contracts; and their respective labels. Or comment out every other contract and every other label if you prefer.
--Added historical input: input days back in time; to see the historical shape of the Futures curve via selecting 'days back' snapshot
updated 20th June 2022
© twingall

VIX: Backwardation Vs ContangoVIX: Backwardation Vs Contango
Quickly visualize Contango vs Backwardation in the S&P 500 Volatility Index by plotting the prices of the futures contracts over the next 9 months
Note: indicator does not map to time axis in the same way as price; it simply plots the progression of contract months out into the future; left to right; so timeframe DOESN'T MATTER for this plot
TO UPDATE(every few months recommended): in REQUEST CONTRACTS section, delete old contracts (top) and add new ones (bottom). Then in PLOTTING section, Delete old contract labels (bottom); add new contract labels (top); adjust the X in 'bar_index-(X+_historical)' numbers accordingly
This is one of several similar indicators: Meats | Metals | Grains | VIX
Tips:
-Right click and reset chart if you can't see the plot; or if you have trouble with the scaling.
-Right click and pin to Scale A to plot on the same scale as price
--Added historical input: input days back in time; to see the historical shape of the Futures curve via selecting 'days back' snapshot
updated 15th June 2022
© twingall

Grains:Backwardation/ContangoGRAINS: Wheat , Soybeans , Corn (ZW, ZS, ZC )
Quickly visualize carrying charge market vs backwardized market by comparing the price of the next 2 years of futures contracts.
Carrying charge (contract prices increasing into the future) = normal, representing the costs of carrying/storage of a commodity. When this is flipped to Backwardation (contract prices decreasing into the future): its a bullish sign: Buyers want this commodity, and they want it NOW.
The above chart shows a nice example of backwardation.
Note: indicator does not map to time axis in the same way as price; it simply plots the progression of contract months out into the future; left to right; so timeframe DOESN'T MATTER for this plot
There's likely some more efficient way to write this; e.g. when plotting for Wheat (ZW); 15 of the security requests are redundant; but they are still made; and can make this slower to load
TO UPDATE(once a year will do): in REQUEST CONTRACTS section, delete old contracts (top) and add new ones (bottom). Then in PLOTTING section, Delete old contract labels (bottom); add new contract labels (top); adjust the X in 'bar_index-(X+_historical)' numbers accordingly
This is one of three similar indicators: Meats | Metals | Grains
-If you want to build from this; to work on other commodities ; be aware that Tradingview limits the number of contract calls to 40 (hence the 3 seperate indicators)
Tips:
-Right click and reset chart if you can't see the plot; or if you have trouble with the scaling.
-Right click and add to new scale if you prefer this not to overlay directly on price. Or move to new pane below.
--Added historical input: input days back in time; to see the historical shape of the Futures curve via selecting 'days back' snapshot
updated 15th June 2022
© twingall

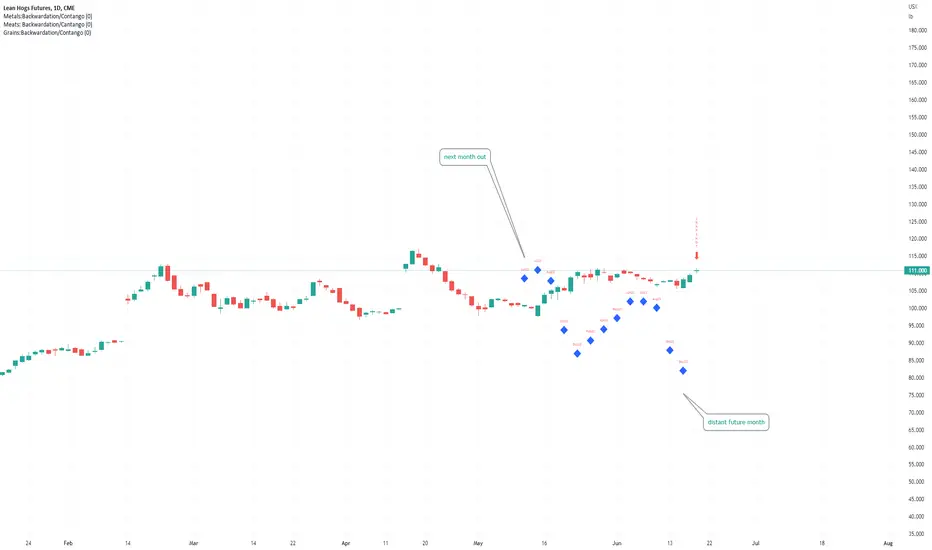
Meats: Backwardation/CantangoMEATS: Live Cattle , Feeder Cattle, Lean Hogs (LE, GF , HE)
Quickly visualize carrying charge market vs backwardized market by comparing the price of the next 2 years of futures contracts.
Carrying charge (contract prices increasing into the future) = normal, representing the costs of carrying/storage of a commodity. When this is flipped to Backwardation (contract prices decreasing into the future): its a bullish sign: Buyers want this commodity, and they want it NOW.
Note: indicator does NOT map to time axis in the same way as price; it simply plots the progression of contract months out into the future; left to right; so timeframe DOESN'T MATTER for this plot
There's likely some more efficient way to write this; e.g. when plotting for Live Cattle (LE); 8 of the security requests are redundant; but they are still made; and can make this slower to load
TO UPDATE(once a year will do): in REQUEST CONTRACTS section, delete old contracts (top) and add new ones (bottom). Then in PLOTTING section, Delete old contract labels (bottom); add new contract labels (top); adjust the X in 'bar_index-(X+_historical)' numbers accordingly
This is one of three similar indicators: Meats | Metals | Grains
-If you want to build from this; to work on other commodities ; be aware that Tradingview limits the number of contract calls to 40 (hence the 3 seperate indicators)
Tips:
-Right click and reset chart if you can't see the plot; or if you have trouble with the scaling.
-Right click and add to new scale if you prefer this not to overlay directly on price. Or move to new pane below.
--Added historical input: input days back in time; to see the historical shape of the Futures curve via selecting 'days back' snapshot
updated 15th June 2022
© twingall
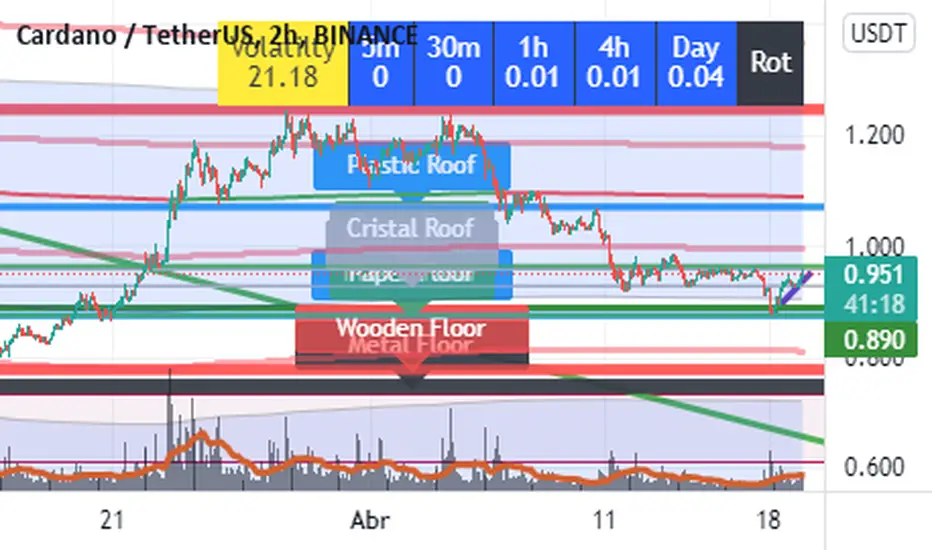
Roof and Floors From Actieve InversionesImagine a Funny and visual way to understand Highest Highs and Lowest Lows. That's the way this indicator was conceived.
The way it Works:
The indicator plots lines in highest highs or lowest lows from a period of "Bars", you only have to set the number of Bars you wanna use and the indicator Makes all the stuff.
This is a Long term Indicator, so it can Show useful Floors or Roofs from higher Timeframes:
Cristal = Five Min Bars
Paper = thirty Min Bars
Plastic = 1 Hour Bars
Wood = 4 hours Bars
Metal = Daily Bars
But wait... There is something better than that...
If The Floor or Roof Brokes, the indicator will plot a dashed line and a label ¨Broken Roof or Floor¨ u can use it to set a Limit Order or Stop Order, and wait for the pullback.
Do you want some useful Advice ? Check the junctions from Floor or Roofs that are overlayed in some level.
Have Fun and good trading!!!
Commitment of Traders: Disaggregated Metrics█ OVERVIEW
This indicator displays the Commitment of Traders (COT) Disaggregated data for futures markets.
█ CONCEPTS
Commitment of Traders (COT) data is tallied by the Commodity Futures Trading Commission (CFTC) , a US federal agency that oversees the trading of derivative markets such as futures in the US. It is weekly data that provides traders with information about open interest for an asset. The CFTC oversees derivative markets traded on different exchanges, so COT data is available for assets that can be traded on CBOT, CME, NYMEX, COMEX, and ICEUS.
A detailed description of the COT report can be found on the CFTC's website .
COT data is separated into three notable reports: Legacy, Disaggregated, and Financial. This indicator presents data from the Disaggregated report. The disaggregated reports are broken down by agriculture, petroleum and products, natural gas and products, electricity and metals and other physical contracts. The Disaggregated reports break down the reportable open interest positions into four classifications: Producer/Merchant/Processor/User, Swap Dealers, Managed Money, and Other Reportables.
Our other COT indicators are:
• Commitment of Traders: Legacy Metrics
• Commitment of Traders: Financial Metrics
• Commitment of Traders: Total
█ HOW TO USE IT
Load the indicator on an active chart (see here if you don't know how).
By default, the indicator uses the chart's symbol to derive the COT data it displays. You can also specify a CFTC code in the "CFTC code" field of the script's inputs to display COT data from a symbol different than the chart's.
The rest of this section documents the script's input fields.
Metric
Each metric represents a different column of the Commitment of Traders report. Details are available in the explanatory notes on the CFTC's website .
Here is a summary of the metrics:
• "Open Interest" is the total of all futures and/or option contracts entered into and not yet offset by a transaction, by delivery, by exercise, etc.
The aggregate of all long open interest is equal to the aggregate of all short open interest.
• "Traders Total" is the quantity of all unique reportable traders, regardless of the trading direction.
• "Traders Producer Merchant" is the number of traders classified as a "producer/merchant/processor/user" reported holding any position with the specified direction.
A "producer/merchant/processor/user" is an entity that predominantly engages in the production, processing, packing or handling of a physical commodity and
uses the futures markets to manage or hedge risks associated with those activities.
• "Traders Swap" is the number of traders classified as "swap dealers" reported holding any position with the specified direction.
A "swap dealer" is an entity that deals primarily in swaps for a commodity and uses the futures markets to manage or hedge the risk associated with those swaps transactions.
The swap dealer’s counterparties may be speculative traders, like hedge funds, or traditional commercial clients that are managing risk arising from their dealings in the physical commodity.
• "Traders Managed Money" is the number of traders classified as "money managers" reported holding any position with the specified direction.
A "money manager" is a registered trader that is engaged in managing and conducting organized futures trading on behalf of clients.
• "Traders Other Reportable" is the number of reportable traders that are not placed in any of the three categories specified above.
• "Traders Total Reportable" is the number of traders reported holding any position with the specified direction.
To determine the total number of reportable traders in a market, a trader is counted only once whether or not the trader appears in more than one category.
As a result, the sum of the numbers of traders in each separate category typically exceeds the total number of reportable traders.
• "Producer Merchant/Swap/Managed Money/Total Reportable/Other Reportable Positions" is all positions held by the traders of the specified category.
• "Nonreportable Positions" is the long and short open interest derived by subtracting the total long and short reportable positions from the total open interest.
Accordingly, the number of traders involved and the classification of each trader are unknown.
• "Concentration Gross/Net LE 4/8 TDR" is the percentage of open interest held by 4/8 of the largest traders (entities), by Gross/Net positions, without regard to how they are classified.
The Net position ratios are computed after offsetting each trader’s equal long and short positions.
A reportable trader with relatively large, balanced long and short positions in a single market,
therefore, may be among the four and eight largest traders in both the gross long and gross short categories,
but will probably not be included among the four and eight largest traders on a net basis.
Direction
Each metric is available for a particular set of directions. Valid directions for each metric are specified with its name in the "Metric" field's dropdown menu.
Type
Possible values are: All, Old, Other. When commodities have a well-defined marketing season or crop year (e.g. Wheat or Lean Hogs futures), this determines how the data is aggregated. Detailed explanation can be found in the "Old and Other Futures" section of the CTFC Explanatory Notes linked above. The "Major Markets for Which the COT Data Is Shown by Crop Year" table in the Explanatory Notes specifies the commodities that this distinction applies to; selecting "Old" for any of the commodities not in that list will return the same data as in "All", while selecting "Other" will return 0.
Futures/Options
Specifies the type of Commitment of Traders data to display: data concerning only Futures, only Options, or both.
CTFC Code
Instead of letting the script generate the CFTC COT code from the chart and the "COT Selection Mode" input when this field is empty, you can specify an unrelated CFTC COT code here, e.g., 001602 for wheat futures.
Look first. Then leap.

Combo Backtest 123 Reversal & Smart Money Index (SMI) This is combo strategies for get a cumulative signal.
First strategy
This System was created from the Book "How I Tripled My Money In The
Futures Market" by Ulf Jensen, Page 183. This is reverse type of strategies.
The strategy buys at market, if close price is higher than the previous close
during 2 days and the meaning of 9-days Stochastic Slow Oscillator is lower than 50.
The strategy sells at market, if close price is lower than the previous close price
during 2 days and the meaning of 9-days Stochastic Fast Oscillator is higher than 50.
Second strategy
Smart money index (SMI) or smart money flow index is a technical analysis indicator demonstrating investors sentiment.
The index was invented and popularized by money manager Don Hays. The indicator is based on intra-day price patterns.
The main idea is that the majority of traders (emotional, news-driven) overreact at the beginning of the trading day
because of the overnight news and economic data. There is also a lot of buying on market orders and short covering at the opening.
Smart, experienced investors start trading closer to the end of the day having the opportunity to evaluate market performance.
Therefore, the basic strategy is to bet against the morning price trend and bet with the evening price trend. The SMI may be calculated
for many markets and market indices (S&P 500, DJIA, etc.)
The SMI sends no clear signal whether the market is bullish or bearish. There are also no fixed absolute or relative readings signaling
about the trend. Traders need to look at the SMI dynamics relative to that of the market. If, for example, SMI rises sharply when the
market falls, this fact would mean that smart money is buying, and the market is to revert to an uptrend soon. The opposite situation
is also true. A rapidly falling SMI during a bullish market means that smart money is selling and that market is to revert to a downtrend
soon. The SMI is, therefore, a trend-based indicator.
Some analysts use the smart money index to claim that precious metals such as gold will continually maintain value in the future.
WARNING:
- For purpose educate only
- This script to change bars colors.

Financial Astrology Sun SpeedSun speed from geocentric view represents the apparent daily move (in degrees) of the Sun through the Zodiac wheel, we know well that is the Earth which is moving and this Sun dance through the tropical Zodiac is just apparent. The maximum speed 1.02 degrees per day is reached at the perihelion (closest to Sun) which occurs in January at the zodiac sign of Capricorn, the minimum speed is 0.97 at aphelion (further to Sun) and occurs at July at the sign of Cancer. The speed is inversely correlated to the Sun declination so at the maximum value in North declination we get the minimum value in speed and viceversa.
Is interesting to note that at the speed maxima, minima or exact average (that coincide with the start of the different Earth seasons) we can identify some of the most relevant top and bottoms in BTCUSD. Is said that "gold" metal is ruled by the Sun so would be great to analyse if there is a relevant correlation of top and bottoms in GLD market with in speed extreme value, I will leave this as homework to some of the amazing astro traders that do research with Trading View charts.
Note: The Sun speed indicator is based on an ephemeris array that covers years 2010 to 2030, prior or after this years the speed is not available, this daily ephemeris are based on UTC time so in order to align properly with the price bars times you should set UTC as your chart timezone.
