Price SextantThe provided Pine Script™ code is for a technical analysis indicator called "Price Sextant." This indicator helps visualize the price position relative to its linear regression and standard deviation levels. Here's a brief description:
Price Sextant Indicator:
Purpose:
The Price Sextant indicator aims to show the current price's deviation from the linear regression line by dividing the price chart into different zones or sextants.
Components:
Linear Regression: The script calculates a linear regression line based on the closing prices over a specified length (default is 50 bars).
Standard Deviation Sections: It then computes standard deviation levels from the linear regression, creating upper and lower sections around the regression line.
Scoring: Each section is assigned a numerical score, and labels with corresponding scores are displayed on the chart.
Arrow and Midline: An arrow is drawn to indicate the current price's position in relation to the regression line and standard deviation bands. It changes color based in what section it is:
orange section shows a ranging price, below orange section -1 arrow turns red and show down trend and if arrow above +1 section it turns green and show strong up trend of price.
A midline is plotted to mark the position of the linear regression line.
Sextant Description:
In navigation, a sextant is an instrument used to measure the angle between two visible objects.
In the context of this indicator, the term "Sextant" is likely used metaphorically to describe the division of the price chart into six sections or zones based on the linear regression and standard deviation bands.
This indicator can help traders identify potential overbought or oversold conditions, as well as assess the strength and direction of the trend.
Please note that the effectiveness of the indicator depends on various factors, and it's advisable to use it in conjunction with other analysis tools for a comprehensive trading strategy.
Cerca negli script per "META股票怎么样"

COT MCIThe COT MCI script is a market indicator based on the data from the Commitment of Traders Reports.
Integration of COT Report Data:
The script sources COT data from futures contracts, including:
Treasury Bonds (ZB), Dollar Index (DX), 10-Year Treasury Notes (ZN)
Commodities like Soybeans (ZS), Soy Meal (ZM), Soy Oil (ZL), Corn (ZC), Wheat (ZW), Kansas City Wheat (KE), Pork (HE), Cattle (LE)
Precious Metals such as Gold (GC), Silver (SI), Palladium (PA), Platinum (PL)
Industrial Metals like Copper (HG), Aluminum (AUP), Steel (HRC)
Energy Products like Crude Oil (CL), Heating Oil (HO), Gasoline (RB), Natural Gas (NG), Brent Crude (BB)
Currencies such as AUD (6A), GBP (6B), CAD (6C), EUR (6E), JPY (6J), CHF (6S), NZD (6N), BRL (6L), MXN (6M), RUB (6R), ZAR (6Z)
Others: Sugar (SB), Coffee (KC), Cocoa (CC), Cotton (CT), Ethanol (EH), Rice (ZR), Oats (ZO), Whey (DC), Orange Juice (OJ), Lumber (LBS), Livestock (GF), E-mini S&P 500 (ES), E-mini Russell 2000 (RTY), E-mini Dow Jones (YM), E-mini NASDAQ-100 (NQ), VIX Futures (VX), S&P 500 (SP), DJIA (DJIA)
Cryptocurrencies such as Bitcoin (BTC) and Ethereum (ETH)
Functions and Logic of the Script:
COT Calculation: Determines the net positions for commercial actors and large speculators. Also Available are short and long positions of commercials or large speculators.
Position Change Analysis: Analyzes the percentage changes in net positions and open interest data over a period of 6 weeks (Weekly Chart).
Average Value Calculation: Determines short-term and long-term trend averages.
Trend Analysis: Buy and sell signals (represented in colors) are based on linear regressions and average calculations.
Usage and Application Examples:
Ideal for traders looking for a detailed analysis of market dynamics and position changes in the futures market. Suitable for decision-making in transaction timing and assessing market sentiment.
Usage Notes:
Users should be familiar with the interpretation of COT data and basic concepts of futures trading. Particularly suitable for medium to long-term trading strategies.

TradingView.To Strategy Template (with Dyanmic Alerts)Hello traders,
If you're tired of manual trading and looking for a solid strategy template to pair with your indicators, look no further.
This Pine Script v5 strategy template is engineered for maximum customization and risk management.
Best part?
This Pine Script v5 template facilitates the dynamic construction of TradingView.TO alerts, sparing users the time and effort of mastering the TradingView.TO syntax and manually create alert commands.
This powerful tool gives much power to those who don't know how to code in Pinescript and want to automate their indicators' signals via TradingView.TO bot.
IMPORTANT NOTES
TradingView.TO is a trading bot software that forwards TradingView alerts to your brokers (examples: Binance, Oanda, Coinbase, Bybit, Metatrader 4/5, ...) for automating trading.
Many traders don't know how to create TradingView.TO dynamically-compatible alerts using the data from their TradingView scripts.
Traders using trading bots want their alerts to reflect the stop-loss/take-profit/trailing-stop/stop-loss to break options from your script and then create the orders accordingly.
This script showcases how to create TradingView.TO alerts dynamically.
TRADINGVIEW ALERTS
1) You'll have to create one alert per asset X timeframe = 1 chart.
Example: 1 alert for BTC/USDT on the 5 minutes chart, 1 alert for BTC/USDT on the 15-minute chart (assuming you want your bot to trade the BTC/USDT on the 5 and 15-minute timeframes)
2) Select the Order fills and alert() function calls condition
3) For each alert, the alert message is pre-configured with the text below
{{strategy.order.alert_message}}
Please leave it as it is.
It's a TradingView native variable that will fetch the alert text messages built by the script.
4) TradingView.TO uses webhook technology - setting a webhook URL from the alerts notifications tab is required.
KEY FEATURES
I) Modular Indicator Connection
* plug your existing indicator into the template.
* Only two lines of code are needed for full compatibility.
Step 1: Create your connector
Adapt your indicator with only 2 lines of code and then connect it to this strategy template.
To do so:
1) Find in your indicator where the conditions print the long/buy and short/sell signals.
2) Create an additional plot as below
I'm giving an example with a Two moving averages cross.
Please replicate the same methodology for your indicator, whether a MACD , ZigZag, Pivots , higher-highs, lower-lows or whatever indicator with clear buy and sell conditions.
//@version=5
indicator("Supertrend", overlay = true, timeframe = "", timeframe_gaps = true)
atrPeriod = input.int(10, "ATR Length", minval = 1)
factor = input.float(3.0, "Factor", minval = 0.01, step = 0.01)
= ta.supertrend(factor, atrPeriod)
supertrend := barstate.isfirst ? na : supertrend
bodyMiddle = plot(barstate.isfirst ? na : (open + close) / 2, display = display.none)
upTrend = plot(direction < 0 ? supertrend : na, "Up Trend", color = color.green, style = plot.style_linebr)
downTrend = plot(direction < 0 ? na : supertrend, "Down Trend", color = color.red, style = plot.style_linebr)
fill(bodyMiddle, upTrend, color.new(color.green, 90), fillgaps = false)
fill(bodyMiddle, downTrend, color.new(color.red, 90), fillgaps = false)
buy = ta.crossunder(direction, 0)
sell = ta.crossunder(direction, 0)
//////// CONNECTOR SECTION ////////
Signal = buy ? 1 : sell ? -1 : 0
plot(Signal, title = "Signal", display = display.data_window)
//////// CONNECTOR SECTION ////////
Important Notes
🔥 The Strategy Template expects the value to be exactly 1 for the bullish signal and -1 for the bearish signal
Now, you can connect your indicator to the Strategy Template using the method below or that one.
Step 2: Connect the connector
1) Add your updated indicator to a TradingView chart
2) Add the Strategy Template as well to the SAME chart
3) Open the Strategy Template settings, and in the Data Source field, select your 🔌Connector🔌 (which comes from your indicator)
Note it doesn’t have to be named 🔌Connector🔌 - you can name it as you want - however, I recommend an explicit name you can easily remember.
From then, you should start seeing the signals and plenty of other stuff on your chart.
🔥 Note that whenever you update your indicator values, the strategy statistics and visuals on your chart will update in real-time
II) BOT Risk Management:
- Max Drawdown:
Mode: Select whether the max drawdown is calculated in percentage (%) or USD.
Value: If the max drawdown reaches this specified value, set a value to halt the bot.
- Max Consecutive Days:
Use Max Consecutive Days BOT Halt: Enable/Disable halting the bot if the max consecutive losing days value is reached.
- Max Consecutive Days: Set the maximum number of consecutive losing days allowed before halting the bot.
- Max Losing Streak:
Use Max Losing Streak: Enable/Disable a feature to prevent the bot from taking too many losses in a row.
- Max Losing Streak Length: Set the maximum length of a losing streak allowed.
Margin Call:
- Use Margin Call: Enable/Disable a feature to exit when a specified percentage away from a margin call to prevent it.
Margin Call (%): Set the percentage value to trigger this feature.
- Close BOT Total Loss:
Use Close BOT Total Loss: Enable/Disable a feature to close all trades and halt the bot if the total loss is reached.
- Total Loss ($): Set the total loss value in USD to trigger this feature.
Intraday BOT Risk Management:
- Intraday Losses:
Use Intraday Losses BOT Halt: Enable/Disable halting the bot on reaching specified intraday losses.
Mode: Select whether the intraday loss is calculated in percentage (%) or USD.
- Max Intraday Losses (%): Set the value for maximum intraday losses.
Limit Intraday Trades:
- Use Limit Intraday Trades: Enable/Disable a feature to limit the number of intraday trades.
- Max Intraday Trades: Set the maximum number of intraday trades allowed.
Restart Intraday EA:
III) Order Types and Position Sizing
- Choose between market or limit orders.
- Set your position size directly in the template.
Please use the position size from the “Inputs” and not the “Properties” tab.
I know it's redundant. - the template needs this value from the "Inputs" tab to build the alerts, and the Backtester needs it from the "Properties" tab.
IV) Advanced Take-Profit and Stop-Loss Options
- Choose to set your SL/TP in either USD or percentages.
- Option for multiple take-profit levels and trailing stop losses.
- Move your stop loss to break even +/- offset in USD for “risk-free” trades.
V) Miscellaneous:
Retry order openings if they fail.
Order Types:
Select and specify order type and price settings.
Position Size:
Define the type and size of positions.
Leverage:
Leverage settings, including margin type and hedge mode.
Session:
Limit trades to specific sessions.
Dates:
Limit trades to a specific date range.
Trades Direction:
Direction: Specify the market direction for opening positions.
VI) Logger
The TradingView.TO commands are logged in the TradingView logger.
You'll find more information about it in this TradingView blog post .
WHY YOU MIGHT NEED THIS TEMPLATE
1) Transform your indicator into a TradingView.TO trading bot more easily than before
Connect your indicator to the template
Create your alerts
Set your EA settings
2) Save Time
Auto-generated alert messages for TradingView.TO.
I tested them all and checked with the support team what could/couldn’t be done.
3) Be in Control
Manage your trading risks with advanced features.
4) Customizable
Fits various trading styles and asset classes.
REQUIREMENTS
* Make sure you have your TradingView.TO account
* If there is any issue with the template, ask me in the comments section - I’ll answer quickly.
BACKTEST RESULTS FROM THIS POST
1) I connected this strategy template to a dummy Supertrend script.
I could have selected any other indicator or concept for this script post.
I wanted to share an example of how you can quickly upgrade your strategy, making it compatible with TradingView.TO.
2) The backtest results aren't relevant for this educational script publication.
I used realistic backtesting data but didn't look too much into optimizing the results, as this isn't the point of why I'm publishing this script.
This strategy is a template to be connected to any indicator - the sky is the limit. :)
3) This template is made to take 1 trade per direction at any given time.
Pyramiding is set to 1 on TradingView.
The strategy default settings are:
* Initial Capital: 100000 USD
* Position Size: 1%
* Commission Percent: 0.075%
* Slippage: 1 tick
* No margin/leverage used

[blackcat] L1 Volatility Quality Index (VQI)The Volatility Quality Index (VQI) is an indicator used to measure the quality of market volatility. Volatility refers to the extent of price changes in the market. VQI helps traders assess market stability and risk levels by analyzing price volatility. This introduction may be a bit abstract, so let me help you understand it with a comparative metaphor if you're not immersed in various technical indicators.
Imagine you are playing a jump rope game, and you notice that sometimes the rope moves fast and other times it moves slowly. This is volatility, which describes the speed of the rope. VQI is like an instrument specifically designed to measure rope speed. It observes the movement of the rope and provides a numerical value indicating how fast or slow it is moving. This value can help you determine both the stability of the rope and your difficulty level in jumping over it. With this information, you know when to start jumping and when to wait while skipping rope.
In trading, VQI works similarly. It observes market price volatility and provides a numerical value indicating market stability and risk levels for traders. If VQI has a high value, it means there is significant market volatility with relatively higher risks involved. Conversely, if VQI has a low value, it indicates lower market volatility with relatively lower risks involved as well. The calculation involves dividing the range by values obtained from calculating Average True Range (ATR) multiplied by a factor/multiple.
The purpose of VQI is to assist traders in evaluating the quality of market volatility so they can develop better trading strategies accordingly.
Therefore, VQI helps traders understand the quality of market volatility for better strategy formulation and risk management—just like adjusting your jumping style based on rope speed during jump-rope games; traders can adjust their trading decisions based on VQI values.
The calculation of VQI indicator depends on given period length and multiple factors: Period length is used to calculate Average True Range (ATR), while the multiple factor adjusts the range of volatility. By dividing the range by values and multiplying it with a multiple, VQI numerical value can be obtained.
VQI indicator is typically presented in the form of a histogram on price charts. Higher VQI values indicate better quality of market volatility, while lower values suggest poorer quality of volatility. Traders can use VQI values to assess the strength and reliability of market volatility, enabling them to make wiser trading decisions.
It should be noted that VQI is just an auxiliary indicator; traders should consider other technical indicators and market conditions comprehensively when making decisions. Additionally, parameter settings for VQI can also be adjusted and optimized based on individual trading preferences and market characteristics.

CE - 42MACRO Fixed Income and Macro This is Part 2 of 2 from the 42MACRO Recreation Series
However, there will be a bonus Indicator coming soon!
The CE - 42MACRO Fixed Income and Macro Table is a next level Macroeconomic and market analysis indicator.
It aims to provide a probabilistic insight into the market realized GRID Macro regimes,
track a multiplex of important Assets, Indices, Bonds and ETF's to derive extra market insights by showing the most important aggregates and their performance over multiple timeframes... and what that might mean for the whole market direction.
For traders and especially investors, the unique functionalities will be of high value.
Quick guide on how to use it:
docs.google.com
WARNING
By the nature of the macro regimes, the outcomes are more accurate over longer Chart Timeframes (Week to Months).
However, it is also a valuable tool to form an advanced,
market realized, short to medium term bias.
NOTE
This Indicator is intended to be used alongside the 1nd part "CE - 42MACRO Equity Factor"
for a more wholistic approach and higher accuracy.
Methodology:
The Equity Factor Table tracks specifically chosen Assets to identify their performance and add the combined performances together to visualize 42MACRO's GRID Equity Model.
For this it uses the below Assets:
Convertibles ( AMEX:CWB )
Leveraged Loans ( AMEX:BKLN )
High Yield Credit ( AMEX:HYG )
Preferreds ( NASDAQ:PFF )
Emerging Market US$ Bonds ( NASDAQ:EMB )
Long Bond ( NASDAQ:TLT )
5-10yr Treasurys ( NASDAQ:IEF )
5-10yr TIPS ( AMEX:TIP )
0-5yr TIPS ( AMEX:STIP )
EM Local Currency Bonds ( AMEX:EMLC )
BDCs ( AMEX:BIZD )
Barclays Agg ( AMEX:AGG )
Investment Grade Credit ( AMEX:LQD )
MBS ( NASDAQ:MBB )
1-3yr Treasurys ( NASDAQ:SHY )
Bitcoin ( AMEX:BITO )
Industrial Metals ( AMEX:DBB )
Commodities ( AMEX:DBC )
Gold ( AMEX:GLD )
Equity Volatility ( AMEX:VIXM )
Interest Rate Volatility ( AMEX:PFIX )
Energy ( AMEX:USO )
Precious Metals ( AMEX:DBP )
Agriculture ( AMEX:DBA )
US Dollar ( AMEX:UUP )
Inverse US Dollar ( AMEX:UDN )
Functionalities:
Fixed Income and Macro Table
Shows relative market Asset performance
Comes with different Calculation options like RoC,
Sharpe ratio, Sortino ratio, Omega ratio and Normalization
Allows for advanced market (health) performance
Provides the calculated, realized GRID market regimes
Informs about "Risk ON" and "Risk OFF" market states
Visuals - for your best experience only use one (+ BarColoring) at a time:
You can visualize all important metrics:
- GRID regimes of the currently chosen calculation type
- Risk On/Risk Off with background colouring and additional +1/-1 values
- a smoother GRID model
- a smoother Risk On/ Risk Off metric
- Barcoloring for enabled metric of the above
If you have more suggestions, please write me
Fixed Income and Macro:
The visualisation of the relative performance of the different assets provides valuable information about the current market environment and the actual market performance.
It furthermore makes it possible to obtain a deeper understanding of how the interconnected market works and makes it simple to identify the actual market direction,
thus also providing all the information to derive overall market health, market strength or weakness.
Utility:
The Fixed Income and Macro Table is divided in 4 Columns which are the GRID regimes:
Economic Growth:
Goldilocks
Reflation
Economic Contraction:
Inflation
Deflation
Top 5 Fixed Income/ Macro Factors:
Are the values green for a specific Column?
If so then the market reflects the corresponding GRID behavior.
Bottom 5 Fixed Income/ Macro Factors:
Are the values red for a specific Column?
If so then the market reflects the corresponding GRID behavior.
So if we have Goldilocks as current regime we would see green values in the Top 5 Goldilocks Cells and red values in the Bottom 5 Goldilocks Cells.
You will find that Reflation will look similar, as it is also a sign of Economic Growth.
Same is the case for the two Contraction regimes.
******
This Indicator again is based to a majority on 42MACRO's models.
I only brought them into TV and added things on top of it.
If you have questions or need a more in-depth guide DM me.
GM

ATR GOD Strategy by TradeSmart (PineConnector-compatible)This is a highly-customizable trading strategy made by TradeSmart, focusing mainly on ATR-based indicators and filters. The strategy is mainly intended for trading forex , and has been optimized using the Deep Backtest feature on the 2018.01.01 - 2023.06.01 interval on the EUR/USD (FXCM) 15M chart, with a Slippage value of 3, and a Commission set to 0.00004 USD per contract. The strategy is also made compatible with PineConnector , to provide an easy option to automate the strategy using a connection to MetaTrader. See tooltips for details on how to set up the bot, and check out our website for a detailed guide with images on how to automate the strategy.
The strategy was implemented using the following logic:
Entry strategy:
A total of 4 Supertrend values can be used to determine the entry logic. There is option to set up all 4 Supertrend parameters individually, as well as their potential to be used as an entry signal/or a trend filter. Long/Short entry signals will be determined based on the selected potential Supertrend entry signals, and filtered based on them being in an uptrend/downtrend (also available for setup). Please use the provided tooltips for each setup to see every detail.
Exit strategy:
4 different types of Stop Losses are available: ATR-based/Candle Low/High Based/Percentage Based/Pip Based. Additionally, Force exiting can also be applied, where there is option to set up 4 custom sessions, and exits will happen after the session has closed.
Parameters of every indicator used in the strategy can be tuned in the strategy settings as follows:
Plot settings:
Plot Signals: true by default, Show all Long and Short signals on the signal candle
Plot SL/TP lines: false by default, Checking this option will result in the TP and SL lines to be plotted on the chart.
Supertrend 1-4:
All the parameters of the Supertrends can be set up here, as well as their individual role in the entry logic.
Exit Strategy:
ATR Based Stop Loss: true by default
ATR Length (of the SL): 100 by default
ATR Smoothing (of the SL): RMA/SMMA by default
Candle Low/High Based Stop Loss: false by default, recent lowest or highest point (depending on long/short position) will be used to calculate stop loss value. Set 'Base Risk Multiplier' to 1 if you would like to use the calculated value as is. Setting it to a different value will count as an additional multiplier.
Candle Lookback (of the SL): 50 by default
Percentage Based Stop Loss: false by default, Set the stop loss to current price - % of current price (long) or price + % of current price (short).
Percentage (of the SL): 0.3 by default
Pip Based Stop Loss: Set the stop loss to current price - x pips (long) or price + x pips (short). Set 'Base Risk Multiplier' to 1 if you would like to use the calculated value as is. Setting it to a different value will count as an additional multiplier.
Pip (of the SL): 10 by default
Base Risk Multiplier: 4.5 by default, the stop loss will be placed at this risk level (meaning in case of ATR SL that the ATR value will be multiplied by this factor and the SL will be placed that value away from the entry level)
Risk to Reward Ratio: 1.5 by default, the take profit level will be placed such as this Risk/Reward ratio is met
Force Exiting:
4 total Force exit on custom session close options: none applied by default. If enabled, trades will close automatically after the set session is closed (on next candle's open).
Base Setups:
Allow Long Entries: true by default
Allow Short Entries: true by default
Order Size: 10 by default
Order Type: Capital Percentage by default, allows adjustment on how the position size is calculated: Cash: only the set cash amount will be used for each trade Contract(s): the adjusted number of contracts will be used for each trade Capital Percentage: a % of the current available capital will be used for each trade
ATR Limiter:
Use ATR Limiter: true by default, Only enter into any position (long/short) if ATR value is higher than the Low Boundary and lower than the High Boundary.
ATR Limiter Length: 50 by default
ATR Limiter Smoothing: RMA/SMMA by default
High Boundary: 1000 by default
Low Boundary: 0.0003 by default
MA based calculation: ATR value under MA by default, If not Unspecified, an MA is calculated with the ATR value as source. Only enter into position (long/short) if ATR value is higher/lower than the MA.
MA Type: RMA/SMMA by default
MA Length: 400 by default
Waddah Attar Filter:
Explosion/Deadzone relation: Not specified by default, Explosion over Deadzone: trades will only happen if the explosion line is over the deadzone line; Explosion under Deadzone: trades will only happen if the explosion line is under the deadzone line; Not specified: the opening of trades will not be based on the relation between the explosion and deadzone lines.
Limit trades based on trends: Not specified by default, Strong Trends: only enter long if the WA bar is colored green (there is an uptrend and the current bar is higher then the previous); only enter short if the WA bar is colored red (there is a downtrend and the current bar is higher then the previous); Soft Trends: only enter long if the WA bar is colored lime (there is an uptrend and the current bar is lower then the previous); only enter short if the WA bar is colored orange (there is a downtrend and the current bar is lower then the previous); All Trends: only enter long if the WA bar is colored green or lime (there is an uptrend); only enter short if the WA bar is colored red or orange (there is a downtrend); Not specified: the color of the WA bar (trend) is not relevant when considering entries.
WA bar value: Not specified by default, Over Explosion and Deadzone: only enter trades when the WA bar value is over the Explosion and Deadzone lines; Not specified: the relation between the explosion/deadzone lines to the value of the WA bar will not be used to filter opening trades.
Sensitivity: 150 by default
Fast MA Type: SMA by default
Fast MA Length: 10 by default
Slow MA Type: SMA
Slow MA Length: 20 by default
Channel MA Type: EMA by default
BB Channel Length: 20 by default
BB Stdev Multiplier: 2 by default
Trend Filter:
Use long trend filter 1: false by default, Only enter long if price is above Long MA.
Show long trend filter 1: false by default, Plot the selected MA on the chart.
TF1 - MA Type: EMA by default
TF1 - MA Length: 120 by default
TF1 - MA Source: close by default
Use short trend filter 1: false by default, Only enter long if price is above Long MA.
Show short trend filter 1: false by default, Plot the selected MA on the chart.
TF2 - MA Type: EMA by default
TF2 - MA Length: 120 by default
TF2 - MA Source: close by default
Volume Filter:
Only enter trades where volume is higher then the volume-based MA: true by default, a set type of MA will be calculated with the volume as source, and set length
MA Type: RMA/SMMA by default
MA Length: 200 by default
Date Range Limiter:
Limit Between Dates: false by default
Start Date: Jan 01 2023 00:00:00 by default
End Date: Jun 24 2023 00:00:00 by default
Session Limiter:
Show session plots: false by default, show market sessions on chart: Sidney (red), Tokyo (orange), London (yellow), New York (green)
Use session limiter: false by default, if enabled, trades will only happen in the ticked sessions below.
Sidney session: false by default, session between: 15:00 - 00:00 (EST)
Tokyo session: false by default, session between: 19:00 - 04:00 (EST)
London session: false by default, session between: 03:00 - 11:00 (EST)
New York session: false by default, session between: 08:00 - 17:00 (EST)
Trading Time:
Limit Trading Time: true by default, tick this together with the options below to enable limiting based on day and time
Valid Trading Days Global: 123567 by default, if the Limit Trading Time is on, trades will only happen on days that are present in this field. If any of the not global Valid Trading Days is used, this field will be neglected. Values represent days: Sunday (1), Monday (2), ..., Friday (6), Saturday(7) To trade on all days use: 123457
(1) Valid Trading Days: false, 123456 by default, values represent days: Sunday (1), Monday (2), ..., Friday (6), Saturday(7) The script will trade on days that are present in this field. Please make sure that this field and also (1) Valid Trading Hours Between is checked
(1) Valid Trading Hours Between: false, 1800-2000 by default, hours between which the trades can happen. The time is always in the exchange's timezone
All other options are also disabled by default
PineConnector Automation:
Use PineConnector Automation: false by default, In order for the connection to MetaTrader to work, you will need do perform prerequisite steps, you can follow our full guide at our website, or refer to the official PineConnector Documentation. To set up PineConnector Automation on the TradingView side, you will need to do the following:
1. Fill out the License ID field with your PineConnector License ID;
2. Fill out the Risk (trading volume) with the desired volume to be traded in each trade (the meaning of this value depends on the EA settings in Metatrader. Follow the detailed guide for additional information);
3. After filling out the fields, you need to enable the 'Use PineConnector Automation' option (check the box in the strategy settings);
4. Check if the chart has updated and you can see the appropriate order comments on your chart;
5. Create an alert with the strategy selected as Condition, and the Message as {{strategy.order.comment}} (should be there by default);
6. Enable the Webhook URL in the Notifications section, set it as the official PineConnector webhook address and enjoy your connection with MetaTrader.
License ID: 60123456789 by default
Risk (trading volume): 1 by default
NOTE! Fine-tuning/re-optimization is highly recommended when using other asset/timeframe combinations.

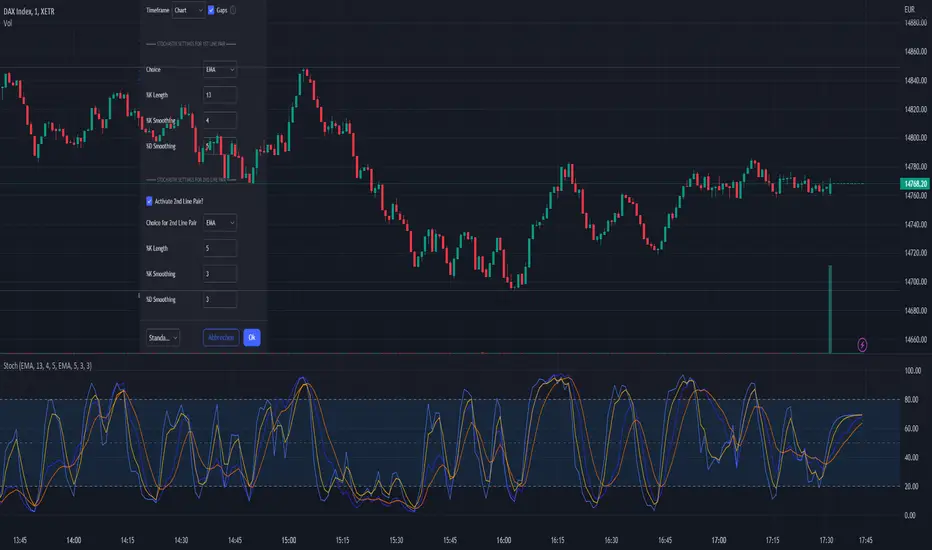
Stochastic EMA, SMA, VWMA + DivergenceEvery MetaTrader User knows the function to switch the stochastic calculation from simple to exponential.
So i took the original Stochastic code from TV and enhanced it for the SMA, EMA, and VWMA smoothing. If you are using a longer K Smoothing interval you will recognize a notable difference between SMA and EMA.
Standard Stochastic Calculation that is well kown
Option to switch smoothing calculation
Choice between Simple Moving Average, Exponential Moving Average, Volume Weighted Moving Average
If you have more wishes regarding the smoothing, just leave a comment i can add a lot more...
On my to-do list is also the divergence lines known from the "divergence indicator" (RSI).
I hope this helps to get better entries ;-)
Have fun!
Recession Warning Traffic LightThis is an indicator that uses 6 different metrics to determine the combined probability of a recession and compares the high probability warning periods against actual historical periods of recession.
GREEN tells us that the referenced recession indicators are not exhibiting any warning. Observe the long stretches of “all-green” in between recessionary periods in the chart above.
RED will show a full-on warning level for that particular recession indicator, signaling that monitoring of this sector is clearly showing a problem – which has in the past, reliably exhibited itself as a forewarning of recessions.
Adding green and red together can help determine a combined probability of recession.
IMPORTANT: Your chart should be on 1d and set to SPX , DJI ,or NDQ indices
Precious metals: This indicator calculates the relative prices of Gold & rhodium. Gold is a flight-to-quality asset. Rhodium is the rarest of precious industrial metals and prices spike when the economy is heating up. In front of a recession, the upper relative movement of rhodium precedes gold.
Stock markets: This indicator compares closing prices to growth rate curves of the SPX. This indication is the noisiest but tells us very well when the recession has ended. Stock market indices, which respond to “smart money” moving out of markets when the other indicators begin to warn of recession, or when markets become overheated and rise to historically unsustainable levels.
Yield curve: This indicator compares the 3m & 10y treasuries and detects yield curve inversions. Interest rates are controlled by the Federal Reserve and by the purchasers in the Federal Treasury auction markets, which together create the treasury yield curve. This inversion is the most reliable recession indicator. These happen during a flight to quality.
Federal Reserve: This indicator measures GDP and detects contraction which is technically a recession. This is usually one of the last indicators to enter a Warning state, and it could be 6 months delayed simply confirming what may have already been projected.
Money Supply. This indicator measures the M2 money supply, which typically grows about 1% per calendar quarter. When this shrinks, it's tapping the brakes on the economy. This can also lead to yield curve inversion. This is also a measure of inflation and its effects on the aggregate money supply (liquid capital) available for short-term economic activity, or which can be directed into the purchase of long-term, less liquid assets.
Leading Economic factors: There is a whole basket of leading economic indicators that, as collections, reflect overall growth or contraction of economic activity. These indicators include measures of level and growth in productivity, employment, housing, consumer confidence, industrial purchasing confidence, and much more. These indicators may or may not be detached from the broader economy, and often provide up to 6 months of foresight. For more information please visit www.conference-board.org
Actual Recession: Central Bank indicators are published by the Federal Reserve and reflect their own analysis of national and regional economic health, as well as their calculations of the likelihood of a recession. The Federal Reserve has a recession ticker which is used to plot periods of actual recessions on this indicator for comparison.

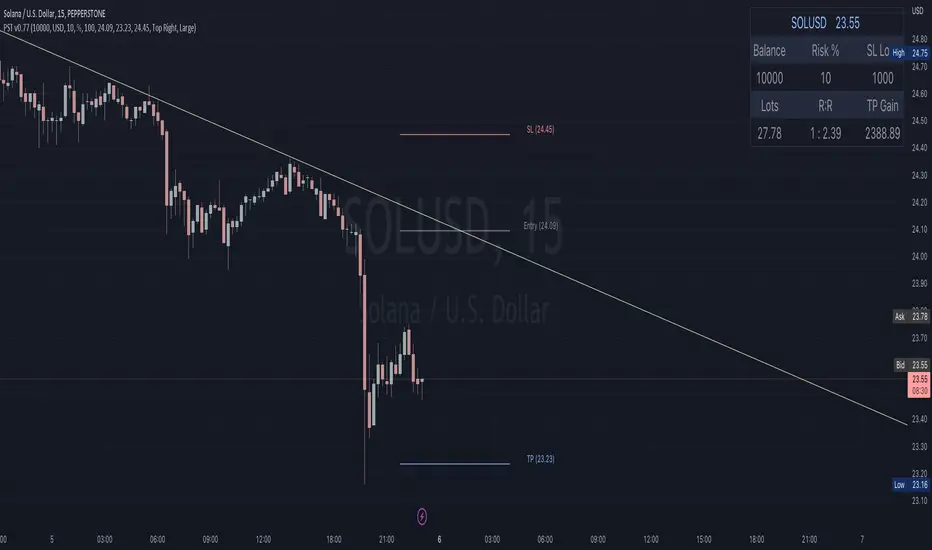
Position Sizing Tool [Skiploss]The position sizing tool is an indicator to help calculate in trading, such as loss and gain, lots size, and risk-reward ratio.
When you open the indicator, you must select the entry, take profit, and stop-loss points.
Be careful;
The take profit point must be more than the entry point in the long position. On the other hand, it will be a short position.
The stop loss point must be less than the entry point in the long position. On the other hand, it will be a short position.
For contract size, you can find details on MetaTrader, Ctrader, or your broker.
Ratio Smoothed, Volume Weighted Moving AverageThis is experimental moving average doesn't use a period/length but instead buffers the price per share and transfers that price per share at a given ratio per bar while also releasing the previous values at a decay ratio.
The idea is that volume is the engine by which the price moves but spikes in volume can cause noise. By having a buffer of price per share units, this VWMA style indicator can behave more like a WMA combined with volume (VAWMA) but smooths out the noise of recent volume. The end result is a price movement that is smooth but also still based strongly up on the average price per share and will always eventually catch up to the true price per share value.
A metaphor to understand this could be a bucket with a hole in it where water is flowing sporadically into the bucket. The level of water in the bucket may change drastically but instead of all the water emptying out immediately, it is throttled by the hole in the bottom. As the level rises, the water pressure increases and the flow increases so that the virtual bucket never has a chance to fill up but also never really empties either.

Financial MetricsGives a sneak peak into some of the important financial ratios described below:
1. P/E : price to earnings ratio (Green when P/E<15)
2. PEG: Price to earnings growth ratio (Green when PEG<1)
3. P/S: Price to sales ratio (Green when P/S<2)
4. EV/FCF: Enterprise Value to Free Cashflow ratio
5. OPM: Operating Profit Margin % (Green when OPM>15%)
6. D/E: Debt to equity ratio (Green when D/E<1)
7. ROE: Return on equity % (Green when ROE>15%)
8. Div_Yield: Dividend yield
Disclaimer: All the limits defined are based on the widely accepted general values, but are subjective to particular sector or group of stocks. For example IT stocks command higher valuation than cyclical stocks like metal. So Compare with other stocks of the same sector to reach any conclusion.

scalping with market facilitationThis strategy is for scalping low timeframes for 10 pips. I have yet to see a strategy with this unique combo of indicators.
First we have volume indicator market facilitation, where we are looking for volume and mfi to be up, then we want the adx 5 to be above level 30 and above its ema period 3, then if these conditions are good we take shorts when ema 8 is below ema 100 and longs when ema8 is above ema 100 with parabolic sar in its propet place, also to verify trend we have obv over or under its ema of 55 and macd line over its signal line.
I have heikenashi bars on with the regular priceline showing so j see actual price levels, when i get a buy signal i set a buystop above the high of that bar and have a stoploss of 7.5 pips and a take profit of 10 pips, reverse for sells, i have to use metatrader to trade so i use this as my signals to trade.
Note this is not advice trade at your own risk no guarantees in anything in life, but i wanted to share this for it is helping me with my trades to be more strict and semi mechanical. I use it for forex time frames 1 3 5 15 mjn

3-Pole Super Smoother w/ EMA-Deviation-Corrected Stepping [Loxx]3-Pole Super Smoother w/ EMA-Deviation-Corrected Stepping is an Ehlers 3-pole smoother with EMA deviations corrective stepping. This allows for greater response to volatility.
What is 3-pole Super Smoother?
A SuperSmoother filter is used anytime a moving average of any type would otherwise be used, with the result that the SuperSmoother filter output would have substantially less lag for an equivalent amount of smoothing produced by the moving average. For example, a five-bar SMA has a cutoff period of approximately 10 bars and has two bars of lag. A SuperSmoother filter with a cutoff period of 10 bars has a lag a half bar larger than the two-pole modified Butterworth filter. Therefore, such a SuperSmoother filter has a maximum lag of approximately 1.5 bars and even less lag into the attenuation band of the filter. The differential in lag between moving average and SuperSmoother filter outputs becomes even larger when the cutoff periods are larger.
What is EMA Deviation Corrected?
Dr. Alexander Uhl invented a method that he used to filter the moving average and to check for signals.
By definition, the Standard Deviation (SD, also represented by the Greek letter sigma σ or the Latin letter s) is a measure that is used to quantify the amount of variation or dispersion of a set of data values. In technical analysis we usually use it to measure the level of current volatility.
Standard Deviation is based on Simple Moving Average calculation for mean value. The built-in MetaTrader 5 Standard Deviation can change that and can use one of the 4 basic types of averages for calculations. This version is not doing that. It is, instead, using the properties of EMA to calculate what can be called a new type of deviation, and since it is based on EMA, we shall call it EMA deviation.
It is similar to Standard Deviation, but on a first glance you shall notice that it is "faster" than the Standard Deviation and that makes it useful when the speed of reaction to volatility is expected from any code or trading system.
Included:
-Color bars
-Loxx's Expanded Source Types

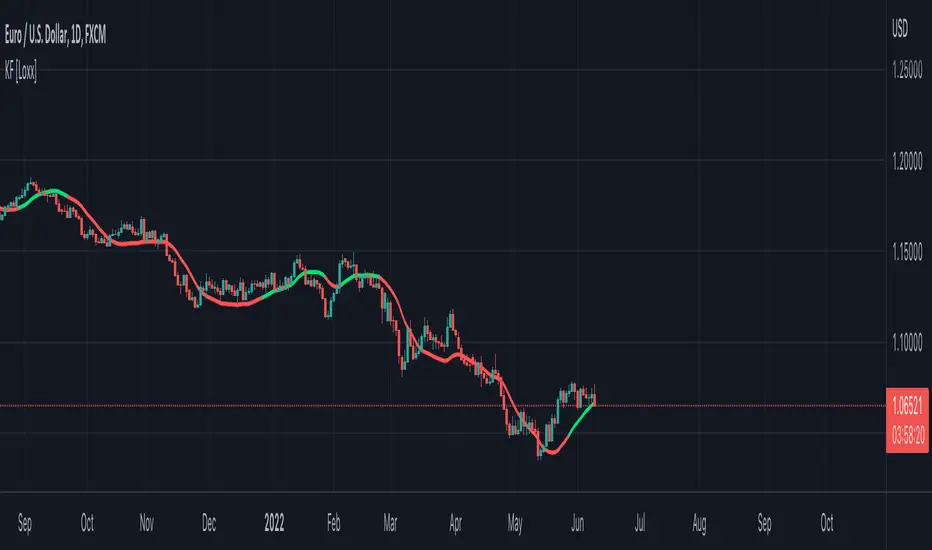
Kalman Filter [Loxx]Kalman filter is a recursive algorithm that has been invented in the 1960s to track a moving target, remove any noisy measurements of its position and predict its future position. In finance, KF has been used by the asset management industry for various purposes. KF is an optimal choice in many cases and do at least better than a moving average smoothing.
A port of Kalman filter - indicator for MetaTrader 4
Added color change based on whether velocity is over/under 0
Bagheri IG Ether v2In this version, the winning ratio has been decreased, but the Risk to Reward Ratio (RRR) has been set to be better than the previous version.
This is a technical trading strategy for Ethereum ( BINANCE:ETHUSDT ). We built and developed it on MetaEditor and optimized it with MetaTrader optimizer.
The main indicators are Donchian Channel, Oscillator of ROC , Bears Power, Balance of Power , and Simple Moving Average ( SMA ). Default values in the input panel are the best combination of these indicators, but you can change any of them and try it for better results.
Please notice that this strategy has been optimized on the 1-minute chart of Ethereum .
For each position, you can see the Take Profit (TP) and Stop Loss (SL) levels. Also, you can find the values of mentioned TP and SL in points from the input panel of the script.
Attention: The price of Ethereum has 2 decimal places.
Therefore, 3000 points for TP means 30 USDT for trading 1 BINANCE:ETHUSDT .

Pivot Reversal Strategy + alerts via TradingConnector to indicesSoftware part of algotrading is simpler than you think. TradingView is a great place to do this actually. To present it, I'm publishing each of the default strategies you can find in Pinescript editor's "built-in" list with slight modification - I'm only adding 2 lines of code, which will trigger alerts, ready to be forwarded to your broker via TradingConnector and instantly executed there. Alerts added in this script: 14 and 22.
How it works:
1. TradingView alert fires.
2. TradingConnector catches it and forwards to MetaTrader4/5 you got from your broker.
3. Trade gets executed inside MetaTrader within 1 second of fired alert.
When configuring alert, make sure to select "alert() function calls only" in CreateAlert popup. One alert per ticker is required.
Adding stop-loss, take-profit, trailing-stop, break-even or executing pending orders is also possible. These topics have been covered in other example posts.
This routing works for Forex, indices, stocks, crypto - anything your broker offers via their MetaTrader4 or 5.
Disclaimer: This concept is presented for educational purposes only. Profitable results of trading this strategy are not guaranteed even if the backtest suggests so. By no means this post can be considered a trading advice. You trade at your own risk.
If you are thinking to execute this particular strategy, make sure to find the instrument, settings and timeframe which you like most. You can do this by your own research only.

Consecutive Up/Down Strat + alerts via TradingConnector to ForexSoftware part of algotrading is simpler than you think. TradingView is a great place to do this actually. To present it, I'm publishing each of the default strategies you can find in Pinescript editor's "built-in" list with slight modification - I'm only adding 2 lines of code, which will trigger alerts, ready to be forwarded to your broker via TradingConnector and instantly executed there. Alerts added in this script: 12 and 15.
How it works:
1. TradingView alert fires.
2. TradingConnector catches it and forwards to MetaTrader4/5 you got from your broker.
3. Trade gets executed inside MetaTrader within 1 second of fired alert.
When configuring alert, make sure to select "alert() function calls only" in CreateAlert popup. One alert per ticker is required.
Adding stop-loss, take-profit, trailing-stop, break-even or executing pending orders is also possible. These topics have been covered in other example posts.
This routing works for Forex, indices, stocks, crypto - anything your broker offers via their MetaTrader4 or 5.
Disclaimer: This concept is presented for educational purposes only. Profitable results of trading this strategy are not guaranteed even if the backtest suggests so. By no means this post can be considered a trading advice. You trade at your own risk.
If you are thinking to execute this particular strategy, make sure to find the instrument, settings and timeframe which you like most. You can do this by your own research only.

RSI Strategy with alerts via TradingConnector to ForexSoftware part of algotrading is simpler than you think. TradingView is a great place to do this actually. To present it, I'm publishing each of the default strategies you can find in Pinescript editor's "built-in" list with slight modification - I'm only adding 2 lines of code, which will trigger alerts, ready to be forwarded to your broker via TradingConnector and instantly executed there. Alerts added in this script: 12 and 17.
How it works:
1. TradingView alert fires.
2. TradingConnector catches it and forwards to MetaTrader4/5 you got from your broker.
3. Trade gets executed inside MetaTrader within 1 second of fired alert.
When configuring alert, make sure to select "alert() function calls only" in CreateAlert popup. One alert per ticker is required.
Adding stop-loss, take-profit, trailing-stop, break-even or executing pending orders is also possible. These topics have been covered in other example posts.
This routing works for Forex, indices, stocks, crypto - anything your broker offers via their MetaTrader4 or 5.
Disclaimer: This concept is presented for educational purposes only. Profitable results of trading this strategy are not guaranteed even if the backtest suggests so. By no means this post can be considered a trading advice. You trade at your own risk.
If you are thinking to execute this particular strategy, make sure to find the instrument, settings and timeframe which you like most. You can do this by your own research only.

Bagheri IG EtherThis is a technical trading strategy for Ethereum ( BINANCE:ETHUSDT ). We built and developed it on MetaEditor and optimized it with MetaTrader optimizer.
The main indicators are Donchian Channel, Oscillator of ROC, Bears Power, Balance of Power, and Simple Moving Average (SMA). Default values in the input panel are the best combination of these indicators, but you can change any of them and try it for better results.
Please notice that this strategy has been optimized on the 1-minute chart of Ethereum.
For each position, you can see the Take Profit (TP) and Stop Loss (SL) levels. Also, you can find the values of mentioned TP and SL in points from the input panel of the script.
Attention: The price of Ethereum has 2 decimal places.
Therefore, 3000 points for TP means 30 USDT for trading 1 BINANCE:ETHUSDT .

Heat Zone Relative Volatility Index 2.0v2 of Heat Zone RVI
• Updated aesthetics and added various alerts.
• The use of temperature descriptions with these Heat Zone scripts is more so metaphoric of the interpretations from what the RVI attempts to indicate primarily.
--- Due to the additions of the Overheated and Freezing Zones , the indicator-pane scaling is a little different from the original Heat Zone RVI .
Ex.)
--- If you like the scaling the way it was on v1, you can change it back by going into the settings , opening up the style page, and unchecking/turning off the Overheated Top Line as well as the Freezing Bottom Line . Otherwise, you can leave the settings be in regards to this matter.
Ex.)
Disclaimer : I am by no means a highly skilled or professional coder/programmer. I just enjoy dabbling and tinkering every now and again.
HOPE YOU ENJOY

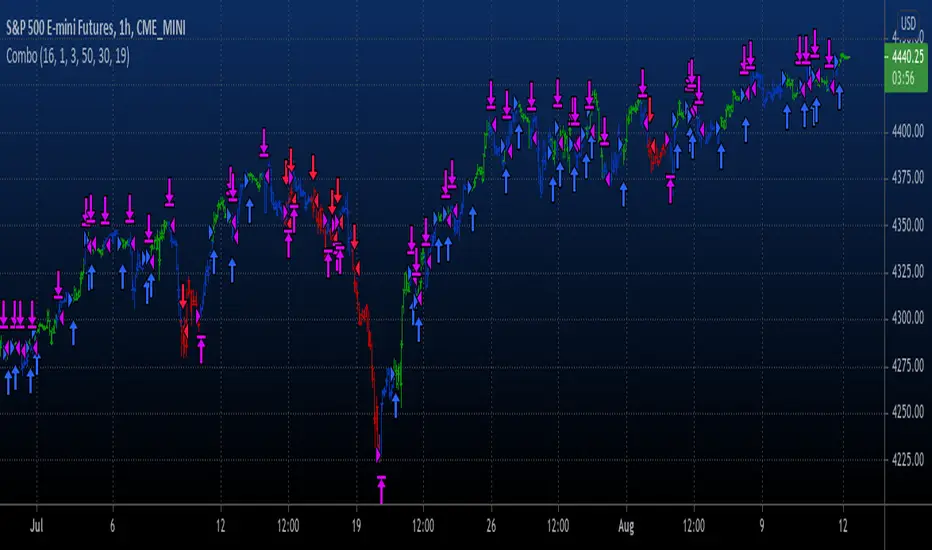
Combo Backtest 123 Reversal & Awesome Oscillator (AO) This is combo strategies for get a cumulative signal.
First strategy
This System was created from the Book "How I Tripled My Money In The
Futures Market" by Ulf Jensen, Page 183. This is reverse type of strategies.
The strategy buys at market, if close price is higher than the previous close
during 2 days and the meaning of 9-days Stochastic Slow Oscillator is lower than 50.
The strategy sells at market, if close price is lower than the previous close price
during 2 days and the meaning of 9-days Stochastic Fast Oscillator is higher than 50.
Second strategy
This indicator is based on Bill Williams` recommendations from his book
"New Trading Dimensions". We recommend this book to you as most useful reading.
The wisdom, technical expertise, and skillful teaching style of Williams make
it a truly revolutionary-level source. A must-have new book for stock and
commodity traders.
The 1st 2 chapters are somewhat of ramble where the author describes the
"metaphysics" of trading. Still some good ideas are offered. The book references
chaos theory, and leaves it up to the reader to believe whether "supercomputers"
were used in formulating the various trading methods (the author wants to come across
as an applied mathemetician, but he sure looks like a stock trader). There isn't any
obvious connection with Chaos Theory - despite of the weak link between the title and
content, the trading methodologies do work. Most readers think the author's systems to
be a perfect filter and trigger for a short term trading system. He states a goal of
10%/month, but when these filters & axioms are correctly combined with a good momentum
system, much more is a probable result.
There's better written & more informative books out there for less money, but this author
does have the "Holy Grail" of stock trading. A set of filters, axioms, and methods which are
the "missing link" for any trading system which is based upon conventional indicators.
This indicator plots the oscillator as a histogram where periods fit for buying are marked
as blue, and periods fit for selling as red. If the current value of AC (Awesome Oscillator)
is over the previous, the period is deemed fit for buying and the indicator is marked blue.
If the AC values is not over the previous, the period is deemed fir for selling and the indicator
is marked red.
WARNING:
- For purpose educate only
- This script to change bars colors.
Exploring UnicodeThis script demonstrates how to display Unicode characters and symbols, including emoji, in Pine:
• Part 1 displays multi-line labels on hi/lo pivots.
• Part 2 displays price/volume bumps using small up/down arrows plotted with plotchar() .
• Part 3 detects bounces and uses plotshape() to mark them.
You can use our `f_bounceFrom()` function from this part as confirmation for signals in your strategies.
Note that the labels displayed on pivots with the code in Part 1 are plotted in the past. In realtime, they would only appear where they are after 50 bars have elapsed from that point. The other plots are plotted on the bar where their conditions are detected.
You can display thousands of Unicode characters and symbols using Pine. As you can see with our script, it is very easy to do so. The challenge will often be to find the exact symbols you are looking for. Many websites exist to help you explore Unicode characters or symbols. The PineCoders Resources page contains a section presenting a few of them.
Duyck has a Unicode font function script containing functions to convert strings to monospaced Unicode representations. TradingView uses the Trebuchet font for most of its text, including text displayed with Pine scripts. While its numerals are monospace and will align vertically in labels text, Duyck's functions will be handy when you need to convert characters to a monospaced form, so they also align vertically in multi-line labels.
What is Unicode?
Unicode is to character encoding what Wikipedia is to knowledge; it holds codes to a good proportion of the characters or symbols used by humans, past or present. In the early days of computing, environments from different manufacturers often used different character encoding schemes, making transport between them difficult. Unicode solves that challenge. It is a comprehensive encoding scheme that visionaries from Xerox and Apple came up with in the late 80's. The addition of members from the Research Libraries Group, Sun Microsystems, Microsoft, Next and Metaphor created the "Unicode working group" and later, the Unicode Consortium , which continues to improve and manage the Unicode standard.
Theoretically, Unicode encodes values representing characters or glyphs —not their pictorial representations. The letters "A" or "a", or the blue heart emoji "💙" are each represented by a Unicode value. In practice, however, there are many different versions of the Latin alphabet in Unicode. That is how our low pivot label can display different representations of the letters "ITV". The exact rendition of Unicode symbols on a specific device is left to equipment manufacturers and typeface designers.
The current Unicode space is comprised of 17 planes of 65,536 characters each, which allows for more than one million code points . Planes are further divided into character blocks , which typically hold a character set corresponding to one script—or language. Emoticons are in the character block starting at U+1F600.
Look first. Then leap.

Trend MagicTrend Magic is originally a MT platform (MetaTrader) indicator and it can be used with any forex trading systems / strategies for additional confirmation of trading entries or exits. Converted the MT platform code to TradingView Pine version 4. Also you can use Multiple Time Frame.
It also works well with Crypto and Stock Markets.
Trend Magic consists of two main calculation parts as momentum and volatility:
First part is ATR based (like ATR Trailing Stop) logic, second part is all about CCI which also determines the color of Trend Magic.
Blue: when CCI is positive
Red: when CCI is negative
Also added alert condition regarding price crosses :
when LOW CrossesAbove TM
and HIGH CrossesBelow TM
Enjoy
Kıvanç Özbilgiç
