Any MA bands (TMA bands V2)Hi everyone
Website will be opening very shortly :) Sorting out the last details and we're so excited to finally roll-out our different Algorithm Builders for you guys
Forewords
This present script is an evolution of the TMA bands . I would never have expected that script to become so popular to be honest
This is not only a study or idea but a really proven method and I'm glad that many of you are using it already. But please, whenever you see a new script out there, even if it looks cool and promising, please test it on a demo account for a week or on a LIVE account but with tiny amounts every time.
Many times, what you see on the chart is not what will happen in reality. I know that most of you will agree and I know exactly why we see this behavior... I'll give more details in a later post
I have plenty of methods like that one and I'll detail them on my website (and a bit on TradingView) starting next month
TMA bands on steroids
Someone asked me privately to make a generic version of the TMA bands and make it compatible with other standards Moving Average types. That's it for the specifications really as I didn't do much than re-using some piece of my own code
Suggested (but not mandatory) methodology
1) The Take Profit 1 is the middle line, Take Profit 2 is the opposite band.
2) Once the TP1 is hit, set your Stop Loss to breakeven
3) Once the TP2 is hit, if you still want to stay in the trade, set your Stop Loss to the TP1
It will be a powerful tool in your arsenal for some scalp/intraday trades
Wishing you all of you a great and profitable day
PS
It's strictly forbidden to republish this script without my explicit approval. All my posts are copyrighted from now on
Obviously you can use but not republish and get the credit or even worse... some money from your own clients
Dave
____________________________________________________________
Be sure to hit the thumbs up. Building those indicators take a lot of time and likes are always rewarding for me :) (tips are accepted too)
- If you want to suggest some indicators that I can develop and share with the community, please use my personal TRELLO board
- I'm an officially approved PineEditor/LUA/MT4 approved mentor on codementor. You can request a coaching with me if you want and I'll teach you how to build kick-ass indicators and strategies
Jump on a 1 to 1 coaching with me
- You can also hire for a custom dev of your indicator/strategy/bot/chrome extension/python
Disclaimer:
Trading involves a high level of financial risk, and may not be appropriate because you may experience losses greater than your deposit. Leverage can be against you.
Do not trade with capital that you can not afford to lose. You must be aware and have a complete understanding of all the risks associated with the market and trading. We can not be held responsible for any loss you incur.
Trading also involves risks of gambling addiction.
Please notice I do not provide financial advice - my indicators, strategies, educational ideas are intended to provide only some source code for anyone interested in improving their trading
The proprietary indicators and strategies developed by Best Trading Indicator, the object of intellectual property rights are and remain the exclusive property of Best Trading Indicator, at the exclusion of images and videos and texts free of rights or provided by the Company or external legal or physical person.
No assignment of intellectual property rights is carried out through these Terms and Conditions.
Any total or partial reproduction, modification or use of these properties for any reason whatsoever is strictly prohibited without the express written authorization of the Company.
Cerca negli script per "N+credit最新动态"

SSL Channel- Automatic Indicator by forexcakemix689 copy:Not taking any credit for the coding
I only made a slight adjustment to the EMA

Mega Trend Plus - S&P 500 Trend Follower / Market GaugeFirstly, 100% of the credit goes to Greg Morris @ Stockcharts.com for the article detailing the concept and most of the settings/components. I've simply implemented his idea. I haven't sought permission from him, but given that he was open with the components of the indicator I'm assuming he's happy for me to go ahead and code this in pinescript. See the article here: stockcharts.com
Okay, so this is part of a system/indicator Greg outlined in the article that he calls Trend Gauge. The idea is fairly simple: take a group of indexes that cover the breadth of the market you want to trade, track their relationship/position to their 200 period Exponential Moving Average (EMA), and assign scores to bull/bear crosses + relative location to the EMA. Once you've normalized and aggregated the scores you finish up with a trend following indicator that works surprisingly well.
This part is called Mega Trend Plus, and tracks whether an index is above or below its 200 period EMA. I'll be releasing the second part ("Trend Strength") soon. Once that's done I'll combine them to form the full "Trend Gauge" indicator.
I decided to provide the base version that people can then experiment with and tweak to their liking, so Greg's version shown in the article is smoother than the one provided here. It's up to you to play with smoothing options, and potentially tweak the weightings of the various components. Please see the script for info on what the various inputs are - I've added notes there.
So, how does it do? Well, as you can see from the chart above it works pretty well overall. The S&P 500 has been fairly trendy over the last few decades, so it's been prime territory for a system like this. It would have kept you out of the big bear markets (particularly GFC & 2015-16), and that's the goal of any trend-based system. They thrive on how little they lose, not necessarily on how much they make.
As you can see, the indicator is pretty choppy. So it's not designed (in the current configuration) to provide accurate buy/hold/sell signals. It currently functions more as a market gauge / strength indicator.
Hopefully you find this concept interesting. It's simple, but the best systems often are.
Please add comments below if you come up with an interesting configuration or variation.
Let me know if you have any queries.
DD

Multi Time Frame EMA Cloud EMA cloud for multiple time frames.
Change settings for time frame u need. Default is 4 hrs. Original credit to Junij
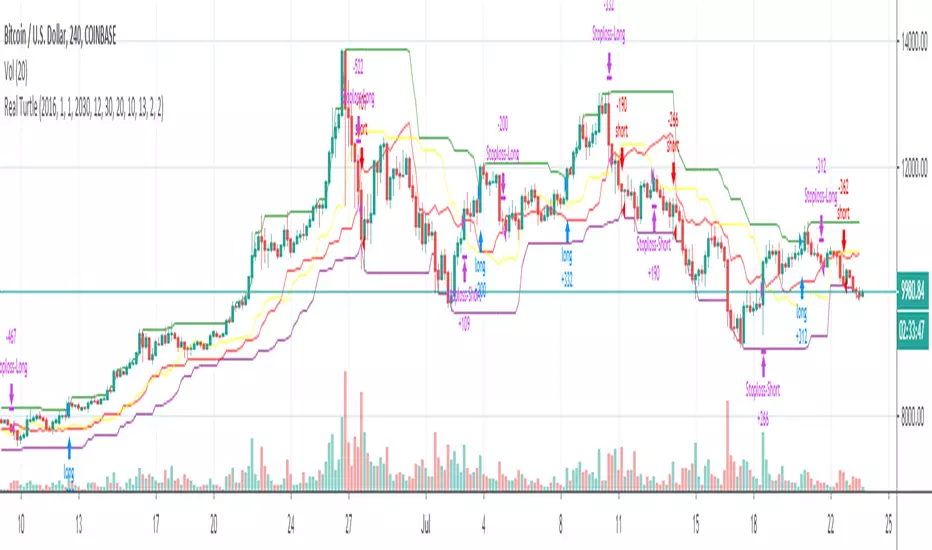
Real TurtleThere are a few different attempts at the turtle strategy on here, but none that I have seen thus far correctly follow the strategy as I know it. This version uses a stop order to trail out of the position by moving the stop order to match the exit channel or stoploss as the N*2( ema of True Range * 2). This version of turtle strategy also uses stop orders for entry on either side in order to enter at optimal time. The ability to specify a backtest period was borrowed from another script, I grabbed it so long ago I no longer remember from whom i borrowed it, if it was yours I will credit you if you PM me.
This version unlike others also allows you to specify a risk % so you only risk that percentage of your equity in a trade, as calculated from your stoploss.
Disclaimer: I have published several scripts in the past when i was first learning pinescript and they are all horrible please ignore those. I would delete them, but TV doesn't allow you to delete.
Engulfing Candles DetectorHello traders
Credit to HPotter for that script
I took his script and added alerts to it. 2 lines lol
But anyway, useful to detect reversals by coloring bullish/bearish engulfing candles :)
Enjoy
David

Hull TrendHere we are using Hull Moving Average crossovers as an experiment in trend detection.
The Hull Moving Average (HMA) is an extremely fast and smooth moving average.
Credit to alexgrover & RicardoSantos:

RSI Go longGiving all credit to @Celena at WarriorTrading for the idea behind this script.
The script is pretty basic and self-explanatory. We will use certain RSI levels both on 5min and 1min to determine the strength/momentum of a stock.
The idea is to monitor 5m and 1m timeframes at once. if the RSI starts to test the initial level, we will see a plot on the graph ( default color is orange ). If we reach our target level and above, bar colors will change to default color green. If this happens in both 1min and 5 min timeframe it is an indicator of the strength of the stock. This indicator coupled with our own strategy helps us reinforce the idea for long entries.

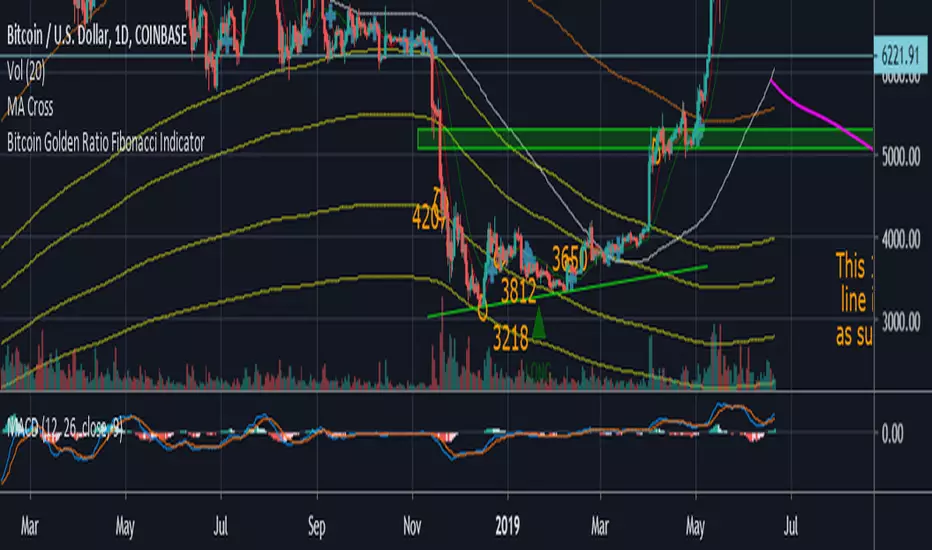
Bitcoin Golden Ratio Fibonacci IndicatorI didn't see this one already it isn't my original idea either. I pulled the formula's from an article on medium, I also added few bear market bottom fib indicators.
Credit to the article I pulled the formula from.
The Golden Ratio Multiplier
Unlocking the mathematically organic nature of Bitcoin adoption
Go to the profile of Philip Swift (@PositiveCrypto)
Philip Swift (@PositiveCrypto)
Jun 17, 2019
By Philip Swift
Release Notes: Fixed spelling error on title, added a couple long and short labels for the top and bottom indicator.
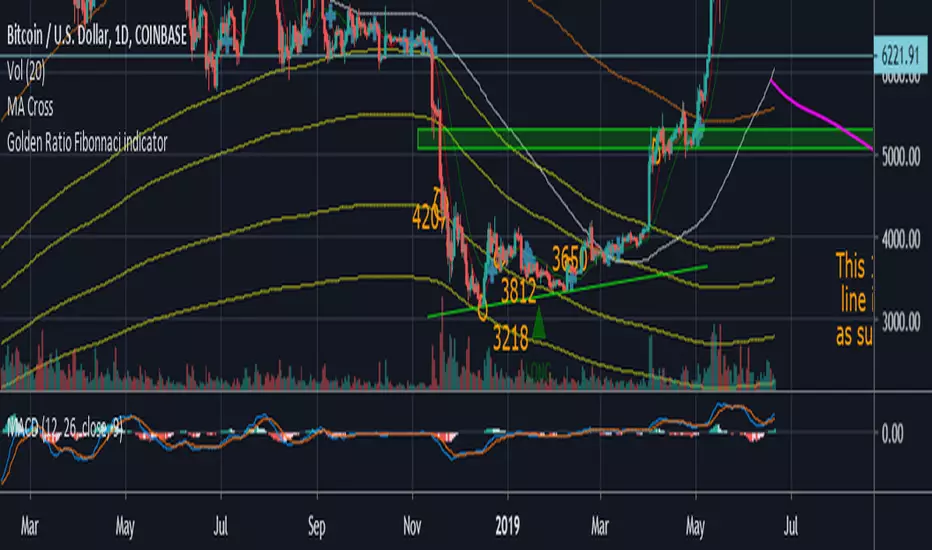
Golden Ratio Fibinnaci IndicatorI didn't see this one already it isn't my original idea either. I pulled the formula's from an article on medium, I also added few bear market bottom fib indicators.
Credit to the article I pulled the formula from.
The Golden Ratio Multiplier
Unlocking the mathematically organic nature of Bitcoin adoption
Go to the profile of Philip Swift (@PositiveCrypto)
Philip Swift (@PositiveCrypto)
Jun 17, 2019
By Philip Swift
Historical Volatility RatioThis script is a way to plot the ratio of short-term and long-term volatility. If the ratio is below 50% for a short/long term HV, we know that the market has the potential to make a large move as the volatility reverts back to its mean.
Credit to Dave Landry for this idea. Seems to be a nice predictor after looking at many breakouts after a pullback.
Defaults to 6-period and 100-period HV.

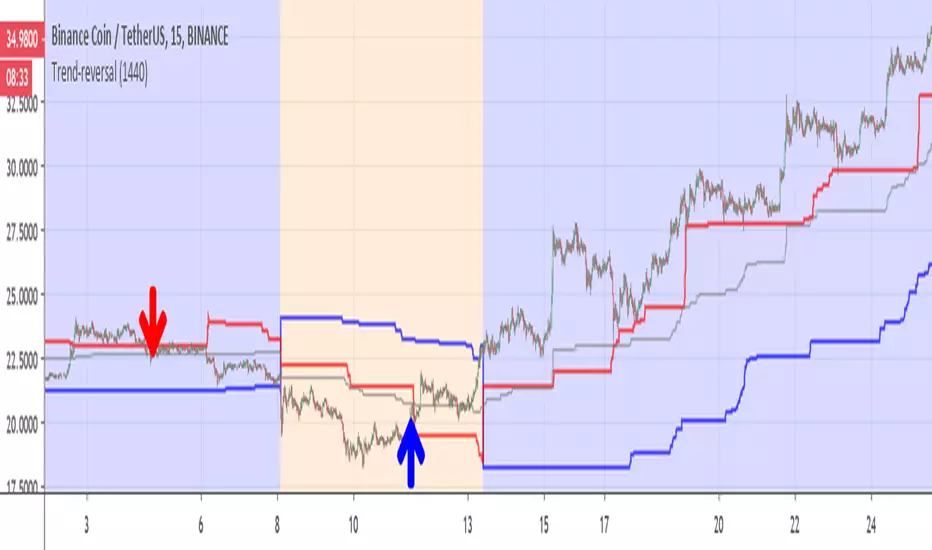
Trend-reversalThis indicator is for detection of trend reversal based on trailing stop (blue line)
the Bullish zone is in blue (red above blue line), bearish zone in orange ( blue line above red line)
gray line is the average of donchian channel
I put the line on 1440 min (so it like daily trailing line) , you can make it shorter if you want .
In this example of BNB coin we see in red arrow that the coin drop from red line so it loosing power -here it sell point during bullish period(blue)
on the other hand when we are in bearish (orange), we can see that the coin is breaking the red line -buy point and the trend is reverse
main script is taken from ceyhun so credit is to him on this
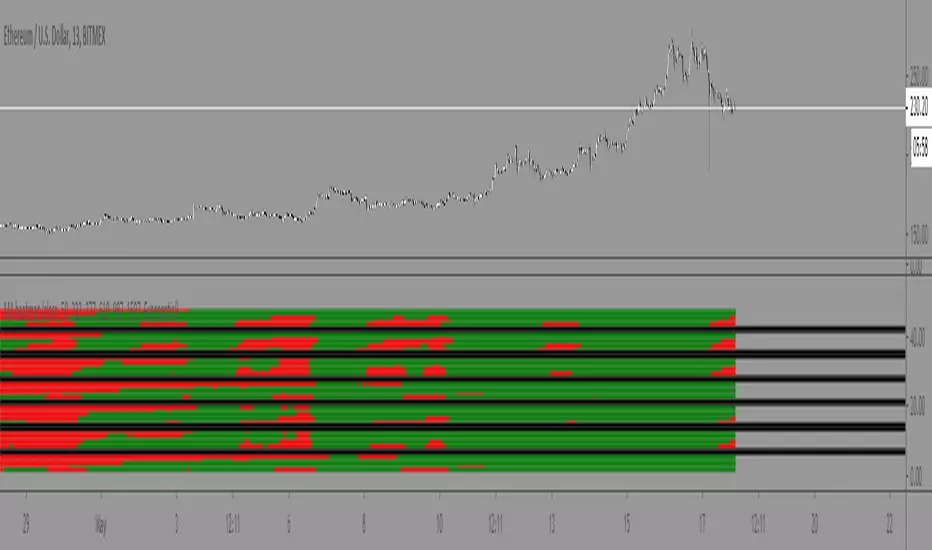
Moving Average Heatmap Visualization7 different types of moving averages (5 different lengths of each) compared to a base moving average. Base moving average can be configured to be a slew of different types of moving averages (credit to @mortdiggiddy for the code) and have a custom length.
Red = base moving average is over other moving average (bearish)
Green = base moving average is under other moving average (bullish)
lengths for the different MAs are just fibonacci numbers due to lack of creativity.
First 5 moving averages are Simple moving average the next 5 are Exponential moving averages and after that it is weighted moving averages, volume weighted moving average (VWAP), Exponential volume weighted moving average (thanks again @mortdiggiddy ), hull moving averages and lastly zero lag moving averages.
The indicator might lag your chart out a bit so be ready for that.
Have fun!
RSI Bands %BThis is again a lazy bear script that has been lost due to the removal of the "make it mine feature".
please credit
If you see any of his great scripts that are no longer accessible message me and I will see what I can do.

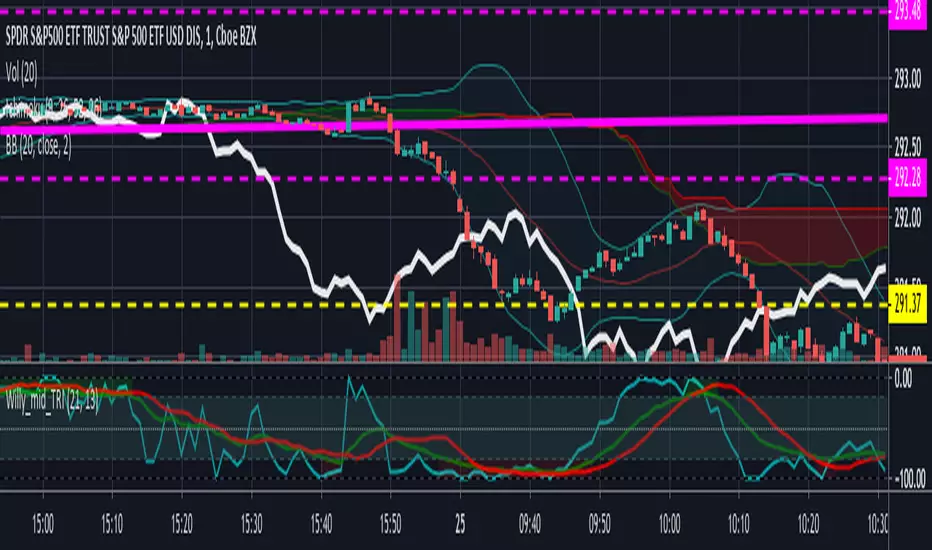
Willams %R with 13 EMA and 13 SMAThis is standard Williams %R originally written by another user that I modified. Credit to him whose name escapes me at the moment. The green line is 13EMA and red line is 13SMA (offset by 2 for timing trades). Great for very quick trades/day trades. Green over red = long. Red over Green = short.
Beware: this is still a choppy indicator. You'll need to use it with the Ichimoku lagging span, chop indiicator, adx, or some other method of avoiding getting chopped to death trying to take every signal.
Simple Relative Strength IndexCreated this script to simply let us predict buy and sell for RSI 15 and 85 (configurable).
It is best use for ETH and monthly chart.
Good for people who can not stay for daily trade and only able to trade few times a month.
The earning is quite lucrative while ETH is on up trend. However, this will not work when ETH on side way.
This only work when ETH is excited!!!
Happy sharing..
Credit to anonymous-es that i used their codes.
