OBV Divergence Indicator [TradingFinder] On-Balance Vol Reversal🔵 Introduction
The On-Balance Volume (OBV) indicator, introduced by Joe Granville in 1963, is a powerful technical analysis tool used to measure buying and selling pressure based on trading volume and price.
By aggregating trading volume—adding it on positive days and subtracting it on negative days—OBV creates a cumulative line that reflects market volume pressure, making it valuable for confirming trends, identifying entry and exit points, and forecasting potential price movements.
Divergences between price and OBV often provide significant signals. A bearish divergence occurs when the price forms higher highs while the OBV line forms lower highs. This discrepancy indicates that upward momentum is weakening, increasing the likelihood of a downward trend.
In contrast, a bullish divergence happens when the price makes lower lows, but the OBV line forms higher lows. This suggests increasing buying pressure and the potential for an upward trend reversal.
For instance, if the price is rising but the OBV trendline is falling, it may signal a bearish divergence, warning of a possible price decline. Conversely, if the price is falling while the OBV line is rising, this could signal a bullish divergence, indicating a possible price recovery. These signals are particularly useful for identifying market turning points.
OBV often acts as a leading indicator, moving ahead of price changes. For example, a rising OBV alongside stable or declining prices can signal an impending upward breakout.
Conversely, a declining OBV with rising prices may indicate that the current uptrend is losing strength. Traders using this strategy often consider entering positions at breakout levels while setting stop losses near recent swing highs or lows to manage risk effectively.
This integration highlights how OBV divergences can provide actionable insights for predicting price movements and managing trades efficiently.
Bullish Divergence :
Bearish Divergence :
🔵 How to Use
The OBV indicator, as a cumulative tool, assists analysts in comparing volume and price changes to identify new trends and key levels for entering or exiting trades. Beyond confirming existing trends, it is particularly effective in analyzing positive and negative divergences between price and volume, providing valuable signals for trading decisions.
🟣 Bullish Divergence
A bullish divergence occurs when the price continues its downward or stable trend, but the OBV line starts rising, forming a higher low compared to its previous low. This suggests increasing volume on up days relative to down days and often signals a reversal to the upside.
For instance, if an asset's price stabilizes near a support level but the OBV line shows an upward trend, this divergence could present an opportunity to enter a long position.
🟣 Bearish Divergence
A bearish divergence occurs when the price forms higher highs, but the OBV line declines, creating lower highs compared to previous peaks. This indicates decreasing volume on up days relative to down days and often acts as a warning for a reversal to the downside.
For example, if an asset’s price approaches a resistance level while OBV starts declining, this divergence may signal the beginning of a downtrend and could indicate a good time to exit long trades or enter short positions.
🔵 Setting
Period : The "Period" setting allows you to define the number of bars or intervals for "Periodic" and "EMA" modes. A shorter period captures more short-term movements, while a longer period smooths out the fluctuations and provides a broader view of market trends.
You can enable or disable labels to highlight key levels or divergences and tables to show numerical details like values and divergence types. These options allow for a customized chart display.
🔵 Table
The following table breaks down the main features of the oscillator. It covers four critical categories: Exist, Consecutive, Divergence Quality, and Change Phase Indicator.
Exist : If divergence is detected, a "+" will appear in this row.
Consecutive: Shows the number of consecutive divergences that have formed in a short period.
Divergence Quality : Evaluates the quality of the divergence based on the number of occurrences. One is labeled "Normal," two are "Good," and three or more are considered "Strong."
Change Phase Indicator : If a phase change is detected between two oscillation peaks, this is marked in the table.
🔵 Conclusion
The OBV (On Balance Volume) indicator is a simple yet effective tool in technical analysis that combines volume and price changes to provide a comprehensive view of market buying and selling pressure. By identifying positive and negative divergences, OBV enables analysts to detect early signs of trend reversals and refine their trading strategies.
Divergences in OBV often precede price changes, making it a leading indicator for predicting market movements. Using OBV alongside other technical tools can enhance decision-making accuracy and help traders identify better entry and exit points. However, it is essential to consider the limitations of OBV, such as the potential for signal errors and the impact of sudden news events.
Ultimately, OBV serves as a complementary tool in technical analysis, aiding in trend identification, signal confirmation, and risk management. A thoughtful application of this indicator, in combination with other analytical tools, can create valuable opportunities for profiting in financial markets.
Cerca negli script per "OBV"

OBV High / LOW (On-Balance Volume )This is a simple application of OBV indicator (On-Balance Volume ), to visually determine when a given stock current obv is near the highest or lowest based on the number of lookback bars.
Indicator examples:
### OBV value is near an all-time high ##
breakthrough , stock value could set new all-time highs.
rejection , stock value could come down or consolidate.
Example
Inputs
OBV High Lookback -> numbers of bars to look back for the obv high.
OBV LowLookback -> numbers of bars to look back for the obv low.
OBV EMA Length -> Ema length
Notes:
This script also comes with an ema indicator based on obv for smoothing the obv signal since it gets noise at lower timeframes (by default comes disabled)
OBV information
www.investopedia.com
Comments:
This is my first script any ideas, suggestions, or detected errors (language/script) don´t hesitate to send a message.
Best regards, Mauro.

OBV Divergence +This study Plots Divergences for OBV along with 2 MA's
Choose between standard type of OBV and OBV Accumulation / Distribution thanks to spacetrader which seems to be a truer reading
Divergence Alerts are provided so that you dont have to stare at your screen all day

OBV+OBV with an extra twist.
Add up to 4 moving averages and choose from simple, exponential, smoothed, etc.
Choose to display a trend fill. Fill will be green when above the MA4 or red when below it. If the difference between the MA1 and MA4 is growing, the trend fill will be a more solid color indicating a strengthening trend. If the gap is lessening, it will gradually get more transparent indicating a weakening trend.
Finally, options to display bullish and bearish regular and hidden divergences are included.

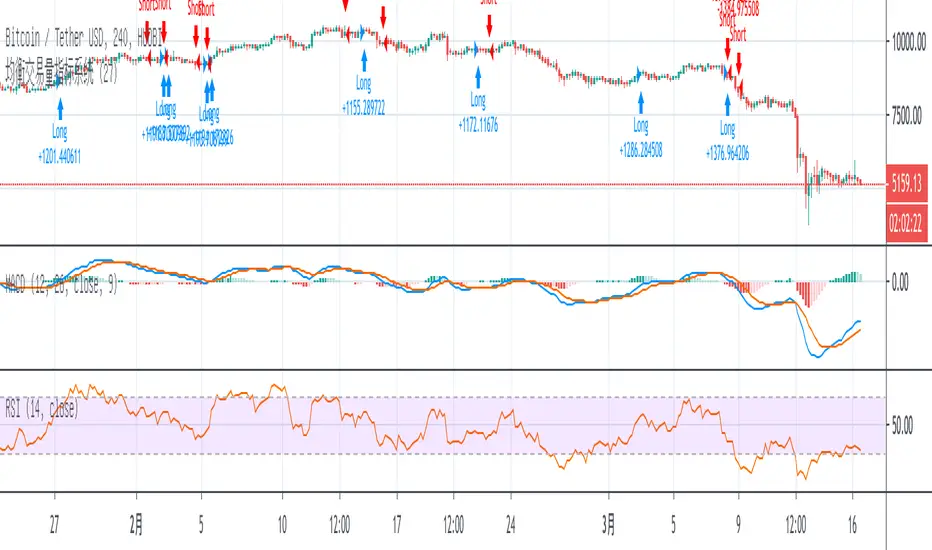
OBV ATR Strategy (OBV Breakout Channel) bas20230503ผมแก้ไขจาก OBV+SMA อันเดิม ของเดิม ดูที่เส้น SMA สองเส้นตัดกันมั่นห่วยแตกสำหรับที่ผมลองเทรดจริง และหลักการเบรค ได้แรงบันดาลใจ ATR จาก เทพคอย ที่ใช้กับราคา แต่นี้ใช้กับ OBV แทน
และผมใช้เจมินี้ เพื่อแก้ ให้ เป็น strategy เพื่อเช็คย้อนหลังได้ง่ายกว่าเดิม
หลักการง่ายคือถ้ามันขึ้น มันจะขึ้นเรื่อยๆ
เขียน แบบสุภาพ (น่าจะอ่านได้ง่ายกว่าผมเขียน)
สคริปต์นี้ได้รับการพัฒนาต่อยอดจากแนวคิด OBV+SMA Crossover แบบดั้งเดิม ซึ่งจากการทดสอบส่วนตัวพบว่าประสิทธิภาพยังไม่น่าพอใจ กลยุทธ์ใหม่นี้จึงเปลี่ยนมาใช้หลักการ "Breakout" ซึ่งได้รับแรงบันดาลใจมาจากการใช้ ATR สร้างกรอบของราคา แต่เราได้นำมาประยุกต์ใช้กับ On-Balance Volume (OBV) แทน นอกจากนี้ สคริปต์ได้ถูกแปลงเป็น Strategy เต็มรูปแบบ (โดยความช่วยเหลือจาก Gemini AI) เพื่อให้สามารถทดสอบย้อนหลัง (Backtest) และประเมินประสิทธิภาพได้อย่างแม่นยำ
หลักการของกลยุทธ์: กลยุทธ์นี้ทำงานบนแนวคิดโมเมนตัมที่ว่า "เมื่อแนวโน้มได้เกิดขึ้นแล้ว มีโอกาสที่มันจะดำเนินต่อไป" โดยจะมองหาการทะลุของพลังซื้อ-ขาย (OBV) ที่แข็งแกร่งเป็นพิเศษเป็นสัญญาณเข้าเทร
----
สคริปต์นี้เป็นกลยุทธ์ (Strategy) ที่ใช้ On-Balance Volume (OBV) ซึ่งเป็นอินดิเคเตอร์ที่วัดแรงซื้อและแรงขายสะสม แทนที่จะใช้การตัดกันของเส้นค่าเฉลี่ย (SMA Crossover) ที่เป็นแบบพื้นฐาน กลยุทธ์นี้จะมองหาการ "ทะลุ" (Breakout) ของพลัง OBV ออกจากกรอบสูงสุด-ต่ำสุดของตัวเองในรอบที่ผ่านมา
สัญญาณกระทิง (Bull Signal): เกิดขึ้นเมื่อพลังการซื้อ (OBV) แข็งแกร่งจนสามารถทะลุจุดสูงสุดของตัวเองในอดีตได้ บ่งบอกถึงโอกาสที่แนวโน้มจะเปลี่ยนเป็นขาขึ้น
สัญญาณหมี (Bear Signal): เกิดขึ้นเมื่อพลังการขาย (OBV) รุนแรงจนสามารถกดดันให้ OBV ทะลุจุดต่ำสุดของตัวเองในอดีตได้ บ่งบอกถึงโอกาสที่แนวโน้มจะเปลี่ยนเป็นขาลง
ส่วนประกอบบนกราฟ (Indicator Components)
เส้น OBV
เส้นหลัก ที่เปลี่ยนเขียวเป็นแดง เป็นทั้งแนวรับและแนวต้าน และ จุด stop loss
เส้นนี้คือหัวใจของอินดิเคเตอร์ ที่แสดงถึงพลังสะสมของ Volume
เมื่อเส้นเป็นสีเขียว (แนวรับ): จะปรากฏขึ้นเมื่อกลยุทธ์เข้าสู่ "โหมดกระทิง" เส้นนี้คือระดับต่ำสุดของ OBV ในอดีต และทำหน้าที่เป็นแนวรับไดนามิก
เมื่อเส้นกลายเป็นสีแดงสีแดง (แนวต้าน): จะปรากฏขึ้นเมื่อกลยุทธ์เข้าสู่ "โหมดหมี" เส้นนี้คือระดับสูงสุดของ OBV ในอดีต และทำหน้าที่เป็นแนวต้านไดนามิก
สัญลักษณ์สัญญาณ (Signal Markers):
Bull 🔼 (สามเหลี่ยมขึ้นสีเขียว): คือสัญญาณ "เข้าซื้อ" (Long) จะปรากฏขึ้น ณ จุดที่ OBV ทะลุขึ้นไปเหนือกรอบด้านบนเป็นครั้งแรก
Bear 🔽 (สามเหลี่ยมลงสีแดง): คือสัญญาณ "เข้าขาย" (Short) จะปรากฏขึ้น ณ จุดที่ OBV ทะลุลงไปต่ำกว่ากรอบด้านล่างเป็นครั้งแรก
วิธีการใช้งาน (How to Use)
เพิ่มสคริปต์นี้ลงบนกราฟราคาที่คุณสนใจ
ไปที่แท็บ "Strategy Tester" ด้านล่างของ TradingView เพื่อดูผลการทดสอบย้อนหลัง (Backtest) ของกลยุทธ์บนสินทรัพย์และไทม์เฟรมต่างๆ
ใช้สัญลักษณ์ "Bull" และ "Bear" เป็นตัวช่วยในการตัดสินใจเข้าเทรด
ข้อควรจำ: ไม่มีกลยุทธ์ใดที่สมบูรณ์แบบ 100% ควรใช้สคริปต์นี้ร่วมกับการวิเคราะห์ปัจจัยอื่นๆ เช่น โครงสร้างราคา, แนวรับ-แนวต้านของราคา และการบริหารความเสี่ยง (Risk Management) ของตัวคุณเองเสมอ
การตั้งค่า (Inputs)
SMA Length 1 / SMA Length 2: ใช้สำหรับพล็อตเส้นค่าเฉลี่ยของ OBV เพื่อดูเป็นภาพอ้างอิง ไม่มีผลต่อตรรกะการเข้า-ออกของ Strategy อันใหม่ แต่มันเป็นของเก่า ถ้าชอบ ก็ใช้ได้ เมื่อ SMA สองเส้นตัดกัน หรือตัดกับเส้น OBV
High/Low Lookback Length: (ค่าพื้นฐาน30/แก้ตรงนี้ให้เหมาะสมกับ coin หรือหุ้น ตามความผันผวน ) คือระยะเวลาที่ใช้ในการคำนวณกรอบสูงสุด-ต่ำสุดของ OBV
ค่าน้อย: ทำให้กรอบแคบลง สัญญาณจะเกิดไวและบ่อยขึ้น แต่อาจมีสัญญาณหลอก (False Signal) เยอะขึ้น
ค่ามาก: ทำให้กรอบกว้างขึ้น สัญญาณจะเกิดช้าลงและน้อยลง แต่มีแนวโน้มที่จะเป็นสัญญาณที่แข็งแกร่งกว่า
แน่นอนครับ นี่คือคำแปลฉบับภาษาอังกฤษที่สรุปใจความสำคัญ กระชับ และสุภาพ เหมาะสำหรับนำไปใช้ในคำอธิบายสคริปต์ (Description) ของ TradingView ครับ
---Translate to English---
OBV Breakout Channel Strategy
This script is an evolution of a traditional OBV+SMA Crossover concept. Through personal testing, the original crossover method was found to have unsatisfactory performance. This new strategy, therefore, uses a "Breakout" principle. The inspiration comes from using ATR to create price channels, but this concept has been adapted and applied to On-Balance Volume (OBV) instead.
Furthermore, the script has been converted into a full Strategy (with assistance from Gemini AI) to enable precise backtesting and performance evaluation.
The strategy's core principle is momentum-based: "once a trend is established, it is likely to continue." It seeks to enter trades on exceptionally strong breakouts of buying or selling pressure as measured by OBV.
Core Concept
This is a Strategy that uses On-Balance Volume (OBV), an indicator that measures cumulative buying and selling pressure. Instead of relying on a basic Simple Moving Average (SMA) Crossover, this strategy identifies a "Breakout" of the OBV from its own highest-high and lowest-low channel over a recent period.
Bull Signal: Occurs when the buying pressure (OBV) is strong enough to break above its own recent highest high, indicating a potential shift to an upward trend.
Bear Signal: Occurs when the selling pressure (OBV) is intense enough to push the OBV below its own recent lowest low, indicating a potential shift to a downward trend.
On-Screen Components
1. OBV Line
This is the main indicator line, representing the cumulative volume. Its color changes to green when OBV is rising and red when it is falling.
2. Dynamic Support & Resistance Line
This is the thick Green or Red line that appears based on the strategy's current "mode." This line serves as a dynamic support/resistance level and can be used as a reference for stop-loss placement.
Green Line (Support): Appears when the strategy enters "Bull Mode." This line represents the lowest low of the OBV in the recent past and acts as dynamic support.
Red Line (Resistance): Appears when the strategy enters "Bear Mode." This line represents the highest high of the OBV in the recent past and acts as dynamic resistance.
3. Signal Markers
Bull 🔼 (Green Up Triangle): This is the "Long Entry" signal. It appears at the moment the OBV first breaks out above its high-low channel.
Bear 🔽 (Red Down Triangle): This is the "Short Entry" signal. It appears at the moment the OBV first breaks down below its high-low channel.
How to Use
Add this script to the price chart of your choice.
Navigate to the "Strategy Tester" panel at the bottom of TradingView to view the backtesting results for the strategy on different assets and timeframes.
Use the "Bull" and "Bear" signals as aids in your trading decisions.
Disclaimer: No strategy is 100% perfect. This script should always be used in conjunction with other forms of analysis, such as price structure, key price-based support/resistance levels, and your own personal risk management rules.
Inputs
SMA Length 1 / SMA Length 2: These are used to plot moving averages on the OBV for visual reference. They are part of the legacy logic and do not affect the new breakout strategy. However, they are kept for traders who may wish to observe their crossovers for additional confirmation.
High/Low Lookback Length: (Most Important Setting) This determines the period used to calculate the highest-high and lowest-low OBV channel. (Default is 30; adjust this to suit the asset's volatility).
A smaller value: Creates a narrower channel, leading to more frequent and faster signals, but potentially more false signals.
A larger value: Creates a wider channel, leading to fewer and slower signals, which are likely to be more significant.

OBV by readCrypto
-------------------------------------
OBV is used as a leading indicator to predict stock price movements by measuring changes in trading volume.
Reflecting the cumulative value of trading volume,
- When the price rises, if the trading volume increases, OBV rises,
- When the price falls, if the trading volume decreases, OBV falls.
Therefore, the movement of the OBV indicator must be checked along with the price movement, and it has the disadvantage of being unreliable for coins (tokens) with low trading volume.
---------------------------------------
(First interpretation method)
By adding a signal line for the OBV indicator,
- If the OBV indicator moves above the signal line, it is likely to show an upward trend,
- If the OBV indicator moves beyond the signal line, it is likely to show a downward trend.
This interpretation method is difficult to use in actual trading strategies because the OBV indicator often moves up and down repeatedly based on the signal line.
Therefore, it is recommended to use this interpretation method as reference when analyzing charts.
-------------------------------
(Second interpretation method)
Draw support and resistance lines based on the high and low points of the OBV indicator
- If the OBV indicator breaks through the previous high point, it is likely to show an upward trend,
- If the OBV indicator breaks through the previous low point, it is likely to show a downward trend.
This interpretation method is a bit more reliable than the first interpretation method, but it has the disadvantage of having to consider support and resistance lines separately based on the high and low points.
-
To compensate for this, a High line for the high point and a Low line for the low point were added.
- If the OBV indicator shows an upward breakout of each line (Low, HL2, High), the price is likely to rise,
- If the OBV indicator shows a downward breakout of each line (Low, HL2, High), the price is likely to fall.
-
Also, the Low and High lines can be interpreted like Bollinger Bands.
That is, if the Low and High lines show a contraction, the price is likely to move sideways, and if they show an expansion, the price is likely to show a trend.
Therefore, if the High line breaks upward in a contracted state,
- It is likely to show an upward trend,
- If the Low line breaks downward, it is likely to show a downward trend.
In an expanded state, you should focus on finding the point to realize profits rather than conducting new transactions.
--------------------------------
It is not easy to interpret the change in actual transaction volume and use it to create a trading strategy.
In particular, it is more difficult in the coin market where multiple exchanges are linked to show movements for one coin (token).
Therefore, the coin market is actively conducting transactions without referring to trading volume at all by following trends.
However, I think that if you interpret the change in trading volume and use it to find a trading point, it can help you find a more accurate trading point.
In that sense, I think that an indicator that adds the High and Low lines of the OBV indicator can be used as meaningful reference material.
-----------------------------------------------------------------
-------------------------------------
OBV는 거래량의 변화를 측정하여 주가 움직임을 예측하는 선행 지표로 활용됩니다.
거래량의 누적값을 반영하여
- 가격이 상승할 때 거래량이 증가면 OBV가 상승하고,
- 가격이 하락할 때 거래량이 줄면 OBV가 하락하게 됩니다.
따라서, 가격의 움직임과 함께 OBV 지표의 움직임을 확인하여야 하고 거래량이 적은 코인(토큰)에서는 신뢰성이 떨어지는 단점도 가지고 있습니다.
---------------------------------------
(첫번째 해석 방법)
OBV 지표에 대한 Signal선을 추가하여
- OBV 지표가 Signal선 이상에서 이동하게 되면 상승세를 보일 가능성이 높고,
- OBV 지표가 Signal선 이항에서 이동하게 되면 하락세를 보일 가능성이 높습니다.
이러한 해석 방법은 Signal선을 기준으로 OBV 지표가 반복적으로 위아래로 움직임을 보이는 경우가 많기 때문에 실제 거래 전략에 활용되기가 어려운 면이 있습니다.
따라서, 이러한 해설 방법은 차트 분석을 할 때 참고 자료로 활용하는 것이 좋습니다.
-------------------------------
(두번째 해석 방법)
OBV 지표의 고점과 저점을 기준하여 지지와 저항선을 그려
- OBV 지표가 이전 고점을 상향 돌파하면 상승세를 보일 가능성이 높고,
- OBV 지표가 이전 저점을 하향 돌파하면 하락세를 보일 가능성이 높습니다.
이러한 해석 방법은 첫번째 해석 방법보다 좀 더 신뢰성이 있는 방법이지만, 고점과 저점을 기준으로 지지와 저항선을 나누어 생각해야 하는 단점이 있습니다.
-
이를 보완하고자 고점에 대한 High선과 저점에 대한 Low선을 추가하였습니다.
- OBV 지표가 각 선(Low, HL2, High)을 상향 돌파하는 모습을 보이면 가격이 상승할 가능성이 높고,
- OBV 지표가 각 선(Low, HL2, High)을 하향 돌파하는 모습을 보이면 가격이 하락할 가능성이 높습니다.
-
또한, Low선과 High선을 볼린저밴드와 같이 해석할 수 있습니다.
즉, Low선과 High선이 수축하는 모습을 보이면 가격은 횡보할 가능성이 높고, 확장하는 모습을 보이면 가격은 추세를 나타낼 가능성이 높습니다.
따라서, 수축한 상태에서
- High선을 상향 돌파하게 되면 상승세를 나타낼 가능성이 높고,
- Low선을 하향 돌파하게 되면 하락세를 나타낼 가능성이 높습니다.
확장된 상태에서는 신규 거래를 진행하기 보다 수익 실현할 시점을 찾는데 집중해야 합니다.
--------------------------------
실제 거래량의 변화를 해석하여 거래 전략을 만드는데 활용하기가 쉽지 않습니다.
특히, 하나의 코인(토큰)에 대해서 여러 개의 거래소가 연동되어 움직임을 나타내는 코인 시장에서는 더욱 어려움이 있습니다.
따라서, 코인 시장은 추세 추종으로 아예 거래량을 참고하지 않고 거래를 진행하는 방법이 활성화되어 있기도 합니다.
하지만, 거래량의 변화를 해석하여 거래 시점을 찾는데 활용한다면 보다 정확한 거래 시점을 찾는데 도움을 받을 수 있다고 생각합니다.
그러한 의미에서 OBV 지표의 High선과 Low선을 추가한 지표가 의미 있는 참고 자료로 활용될 수 있다고 생각합니다.
-------------------------------------------------------------------

OBV with MA & Bollinger Bands by Marius1032OBV with MA & Bollinger Bands by Marius1032
This script adds customizable moving averages and Bollinger Bands to the classic OBV (On Balance Volume) indicator. It helps identify volume-driven momentum and trend strength.
Features:
OBV-based trend tracking
Optional smoothing: SMA, EMA, RMA, WMA, VWMA
Optional Bollinger Bands with SMA
Potential Combinations and Trading Strategies:
Breakouts: Look for price breakouts from the Bollinger Bands, and confirm with a rising OBV for an uptrend or falling OBV for a downtrend.
Trend Reversals: When the price touches a Bollinger Band, examine the OBV for divergence. A bullish divergence (price lower low, OBV higher low) near the lower band could signal a reversal.
Volume Confirmation: Use OBV to confirm the strength of the trend indicated by Bollinger Bands. For example, if the BBs indicate an uptrend and OBV is also rising, it reinforces the bullish signal.
1. On-Balance Volume (OBV):
Purpose: OBV is a momentum indicator that uses volume flow to predict price movements.
Calculation: Volume is added on up days and subtracted on down days.
Interpretation: Rising OBV suggests potential upward price movement. Falling OBV suggests potential lower prices.
Divergence: Divergence between OBV and price can signal potential trend reversals.
2. Moving Average (MA):
Purpose: Moving Averages smooth price fluctuations and help identify trends.
Combination with OBV: Pairing OBV with MAs helps confirm trends and identify potential reversals. A crossover of the OBV line and its MA can signal a trend reversal or continuation.
3. Bollinger Bands (BB):
Purpose: BBs measure market volatility and help identify potential breakouts and trend reversals.
Structure: They consist of a moving average (typically 20-period) and two standard deviation bands.
Combination with OBV: Combining BBs with OBV allows for a multifaceted approach to market analysis. For example, a stock hitting the lower BB with a rising OBV could indicate accumulation and a potential upward reversal.
Created by: Marius1032

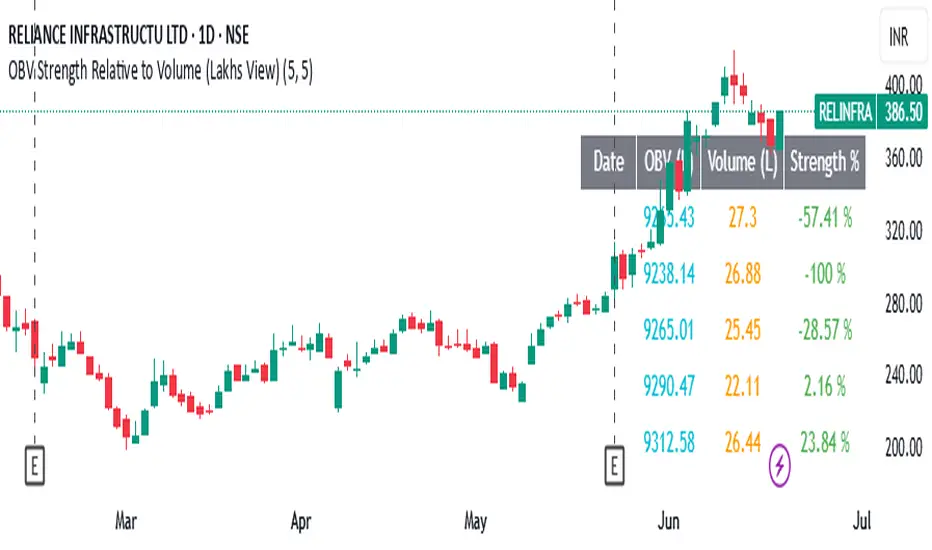
OBV Strength Relative to Volume (Lakhs View)OBV Strength Relative to Volume (Lakhs View)
Description:
to provide a compact yet powerful insight into volume momentum and price conviction. It's tailored for traders and analysts in markets like India, where high-volume stocks are often better interpreted in lakhs.
💡 Key Features:
OBV Calculation: Cumulative OBV is computed based on price movement direction and volume contribution.
OBV Strength (%): Measures the percentage strength of OBV relative to total volume over a user-defined period. It reflects how strongly volume is contributing to price movements.
Lakhs View: Both OBV and Volume are scaled to lakhs for cleaner readability and practical analysis in high-volume securities.
Historical Table Display:
Displays date-wise OBV, Volume, and OBV Strength for the last N candles (customizable).
Automatically updates every 5 bars or on each bar for real-time analysis.
Color-coded cells for quick visual recognition.
⚙️ Inputs:
OBV Strength Period: Number of bars used to calculate OBV strength (default = 5).
Number of Days in Table: Number of recent bars shown in the on-chart table (default = 5).
📈 Plots:
OBV (Lakhs) – Aqua line.
Volume (Lakhs) – Orange columns.
OBV Strength (%) – Green line indicating momentum strength based on volume.
📍 Ideal Use:
Use this indicator to:
Spot divergences between OBV and price.
Assess the strength of volume behind a trend.
Track consistency and spikes in volume-backed price moves.
Quickly scan recent trends with a clear numerical and visual table.
OBV Trend Indicator by Bruno MoscanOBV Trend is a modification I made in other scripts, so that after months of testing, I got a very accurate indicator as to the right moment to enter a high-yield trade.
The red line indicates the very short-term OBV variation, counting the last 3 candles.
The yellow line shows the short-term OBV variation, counting the last 9 candles.
The white line shows the medium-term OBV variation, counting the last 21 candles.
The trend is up (Bull Market) while the order of the lines on the chart is Red/Yellow/White.
The trend is Bear Market while the order of the lines on the chart is White/Yellow/Red.
If the Yellow line is in the first position, either from bottom to top, or from top to bottom, it is a sign that the trend is changing, reversing, wait for the lines to organize before entering the movement.
When the lines are so close together that it is difficult to understand the correct order of the lines, it means that you are facing the best possible entry point. Wait for the lines to separate, at the first perfect food signal as described above, enter the movement, at this point, your stoploss may be very short, positioned at the base of the last candlestick.
The indicator works best on H1, H2, H4 and D1. In the Weekly until the signal reversal occurs, you can lose several days, sometimes weeks. On minute charts, there are many reversals and you can be stopped many times.
Good trends.
*Translate by Google Tradutor*
*In Brazil, we speack Portuguese, not Spanish or English :p *

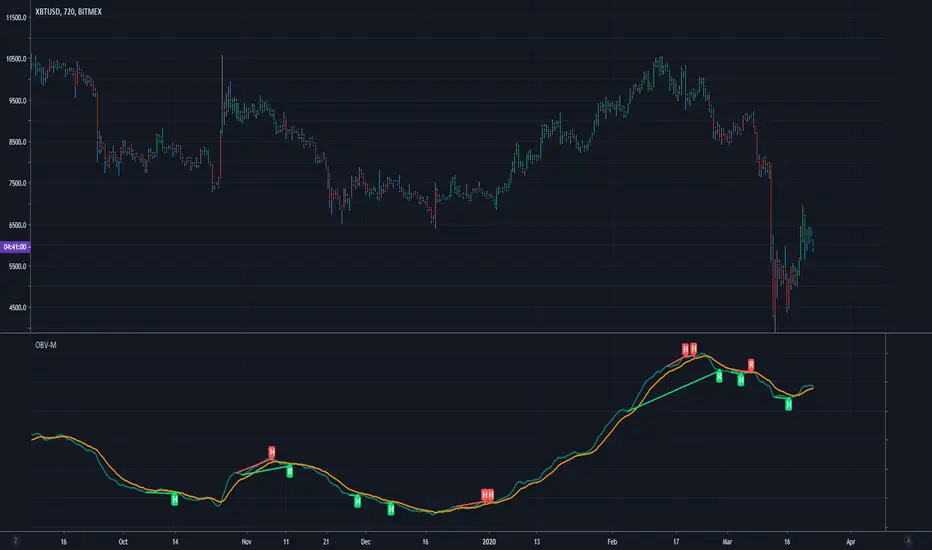
Modified OBV w/ Divergence Detection by CryptorhythmsApirine OBV-M Modified OBV w/ MA Selection by Cryptorhythms
Intro
Released in the April 2020 issue of TASC, and created by Vitali Apirine.
Description
OBV-M is of course based on the classic indicator on balance volume originally developed by Joe Granville. Apirine then smooths the calculation and adds a signal line to help denote entry and exit points.
As the author points out uts also great at showing divergences!
Extras
As usual when porting indicators to the library here on tradingview, I like to add some extra flare!
💠MA selection to allow you to experiment with alternate settings
💠Bar coloration based on trade state for easy visual at a glance chart checking
💠Divergence Detection and plotting thanks for Ricardo Santos' script
Enjoy!
👍 We hope you enjoyed this indicator and find it useful! We post free crypto analysis, strategies and indicators regularly. This is our 78th script on Tradingview!
OBV-LINOBV with linear regression
so we have two type of linear regression channel
1. base on the OBV line (red =bearish,green= bullish trend) (length 50)
2-regular (length 100)
when ever the OBV change direction if it bellow lower part of liner and it bullish so can be buy signal
if opposite can be short signal
not perfect but seems to work ,so it crude work but with some addition maybe in future i make it better
for the signals
on the other hand the combination the two channels seems to predict trend very good
the dashed line is regukar linear channel trend
//

RSI+OBVthis strategy works on the basis of crossovers of RSI at different period and OBV at different periods (separately). I am using it for Nifty and Bank Nifty. Entry for long can be taken when green bar appears; and exit has to be done when it disappears. Entry for short has to be taken when red bar appears; and exit has to be done when it disappears.
With little help from price action good results can be achieved.

OBV w/BB+EMAOBV plotted with Bollinger Bands to show whether the volume is breaking out from its normal deviation (both up or down). The OBV changes color depending on the macro trend which is set using a 100 EMA.

Divergence OBV RSI[mado]Divergence screener for OBV RSI
Regular Bullish: "D" navy label
Hidden Bullish: "H" navy label
Regular Bearish: "D" red label
Hidden Bearish: "H" red label

OBV Accumulation / Distribution combination v2OBV takes difference between old close and new close and multiplies by volume without considering high and low.
This assigns the entire volume into a single direction even tho movement could've been in both.
Accum/dist takes difference between close and high and low without considering previous close or open. This causes huge deviation from OBV when you have close or open far from high or low and price moving in the other direction like in a series of descending hammers.
This is attempt to combine both so relative motion between candles is detected and volume direction is assigned based relative to movement within a candle to account for volume in both directions.
+ and - depends if close is above previous close (+ if above, - if below)
Maximum upward volume counts if close = high and previous close = low, this makes multiplier 1 and thus entire volume is counted upwards
Maximum downward volume counts if close = low and previous close = high, this makes multiplier -1 and thus entire volume is counted downwards.
Zero volume movement occurs when close = previous close.
Half upward volume movement occurs if close-previous_close is half the range from high-low.
Update:
Open used instead of previous close due to issues with grabbing previous close on some charts. This seems more accurate for gaps without volume.

OBV Accumulation/Distribution combinationOBV takes difference between old close and new close and multiplies by volume without considering high and low.
This assigns the entire volume into a single direction even tho movement could've been in both.
Accum/dist takes difference between close and high and low without considering previous close or open. This causes huge deviation from OBV when you have close or open far from high or low and price moving in the other direction like in a series of descending hammers.
This is attempt to combine both so relative motion between candles is detected and volume direction is assigned based relative to movement within a candle to account for volume in both directions.
+ and - depends if close is above previous close (+ if above, - if below)
Maximum upward volume counts if close = high and previous close = low, this makes multiplier 1 and thus entire volume is counted upwards
Maximum downward volume counts if close = low and previous close = high, this makes multiplier -1 and thus entire volume is counted downwards.
Zero volume movement occurs when close = previous close.
Half upward volume movement occurs if close-previous_close is half the range from high-low.


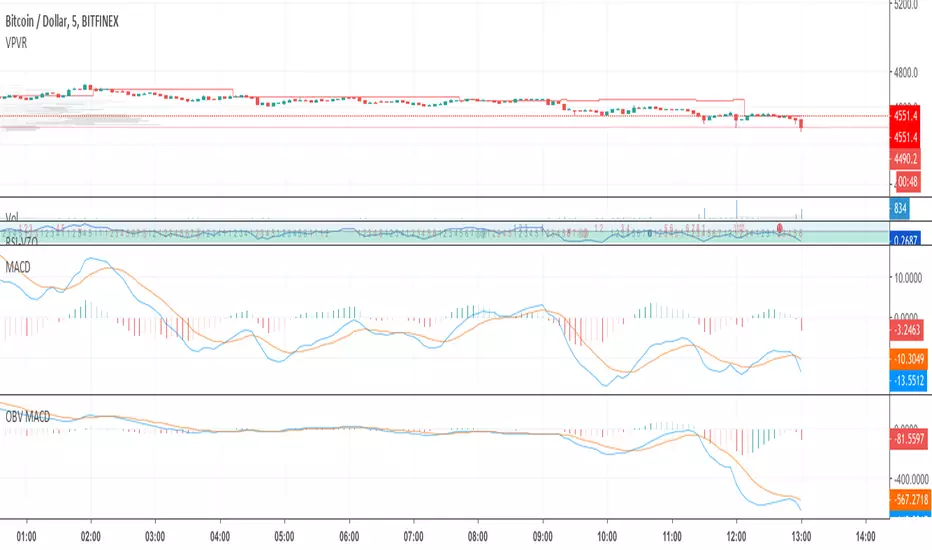
OBV MACDOBV MACD paints a different picture from traditional MACD on low and high (not intermediate) timeframes.
OBV-XOld private script but very nice for detection of trends
it a hybrid of OBV with RSI and multiple type of MA
if we change length of MA we can make to be like stoch type indicator
same princeple as RSI but since its OBV it more responsive
you can buy if cross lower treshold or sell if crossdown upper treshold (can be set by menue)
or you can by and sell in this example by cross between the fast and slow OBV RSI MA
different MA give different results
so another toy to play with
in past I use this script for my trading to detect trends
signal and alerts are included
the fast one is color green (bullish), red (bearish)the slow one is black
so another toy to play with to those who love OBV :)
here example of forex

OBV Oscillator Volume FilterOBV Oscillator Volume Filter
Introduction
The On-Balance Volume (OBV) is a widely-used technical indicator that aims to relate price and volume in trading. Price and volume are two of the most basic and yet crucial concepts in price movement. Together, they can reveal a lot about the instruments trends and the market's sentiment. This On Balance Volume (OBV) Oscillator incorporates enhanced features like a volume filter using a rolling window to detect outliers in accumulated volume, making it an advanced and more refined version of the standard OBV.
Interpreting the OBV Indicator
The primary function of the OBV is to accumulate volume. In simpler terms:
When the market closes higher than the previous candle, all of that candle's volume is considered 'up-volume'.
Conversely, when the market closes lower than the previous day, all of that candle's volume is considered 'down-volume'.
A rising OBV suggests that volume is being accumulated, indicating bullish market sentiment. A declining OBV, on the other hand, points to a bearish sentiment.
Features of the Script
1. Moving Averages Selection:
The script provides users with the option to select among six types of moving averages (EMA, DEMA, TEMA, SMA, WMA, HMA) to calculate the OBV. This feature offers flexibility and enables traders to choose an MA type they're most comfortable with or find the most effective.
2. Smoothing Option:
To reduce the inherent noise in the indicator, there's an option to apply smoothing. It uses a Simple Moving Average (SMA) to produce a clearer signal, making it easier for traders to interpret and respond to. If you don't want to use smoothing, just simply change the input length of smoothing to 1 in the settings.
3. Outlier Detection:
One of the standout features is the use of a rolling window to detect volume outliers. This ensures that the OBV only reacts to significant volume changes and isn't overly influenced by random spikes or drops. The volume filter is calculated based on a % of the highest OBV volume of X number of bars back. Users can adjust the time (# bars) and the sensitivity (%) of the volume filter. A longer timeperiode (# bars) and a higher % (sensitivity) in the settings result to less signals presented by the indicator.
4. Divergence Detection:
The script automatically highlights both regular and hidden divergences on the chart. Divergences can be a powerful signal of potential price reversals. This feature aids traders in spotting potential buy or sell opportunities based on divergences between price and OBV.
Regular Bullish Divergence: When the price makes lower lows, but the OBV makes higher lows.
Hidden Bullish Divergence: When the price makes higher lows, but the OBV makes lower lows.
Regular Bearish Divergence: When the price makes higher highs, but the OBV makes lower highs.
Hidden Bearish Divergence: When the price makes lower highs, but the OBV makes higher highs.
5. Alerts for Trend Reversals:
The script incorporates alerts that notify traders when the OBV indicates potential trend reversals. This feature can be instrumental in catching early entries or exits.
Disclaimer
It's crucial to understand that no single indicator should be used in isolation. To increase the probability of making accurate market predictions, always use the OBV Oscillator in conjunction with other indicators and tools. Remember that all trading involves risk, and it's possible to lose your invested capital. Always seek advice from a financial advisor before making any trading decisions. By enhancing the OBV with features like the volume filter, multiple MA types, smoothing, and divergence detection, this script becomes a potent tool in a trader's arsenal. Use it wisely, and always ensure to maintain proper risk management.

OBV Z-ScoresThis study calculates the On-Balance Volume (OBV) and displays it in terms of its Z-Score.
OBV is a great momentum indicator . As the name suggests, OBV predicts changes in price based on the security's volume flow.
Formula:
if (Current Price > Previous Price)
then Current OBV = Previous OBV + Current Volume
if (Current Price < Previous Price)
then Current OBV = Previous OBV - Current Volume
if (Current Price == Previous Price)
then Current OBV = Previous OBV
As the formula shows, the OBV goes a step beyond just looking at the pure volume of a security. Instead, it factors in relative price action from period to period to reflect investor sentiment. As a result, we often look to the OBV to spot bullish or bearish trends while they are in the early stages of development or simply predict impending uptrends or downtrends.
To make the OBV easier to visualize, we converted the value to a Z-Score. The Z-Score is a simple statistical measurement and represents the current OBV value's distance from the mean OBV value in terms of # of standard deviations.
Users can adjust the values for the 2 upper bounds for Z Scores and 2 lower bounds. Additionally, the n value for z score calculation can be adjusted in the input menu. A higher n value means the z score will be based on a longer lookback period. A lower value will result in more sensitive readings.
Overall, I think this is an interesting way to represent OBV values and will be a valuable leading indicator.
~Happy Trading~
