VWMACD-MFI-OBV Composite# MACD-MFI-OBV Composite
A dynamic volume-based technical indicator combining Volume-Weighted MACD, Money Flow Index (MFI), and normalized On Balance Volume (OBV). This composite indicator excels at identifying breakouts and strong trend movements through multiple volume confirmations, making it particularly effective for momentum and high-volatility trading environments.
## Overview
The indicator integrates trend, momentum, and cumulative volume analysis into a unified visualization system. Each component is carefully normalized to enable direct comparison, while the background color system provides instant trend recognition. This version is specifically optimized for breakout detection and strong trend confirmation.
## Core Components
### Volume-Weighted MACD
Visualized through the background color system, this enhanced MACD implementation uses Volume-Weighted Moving Averages (VWMA) instead of traditional EMAs. This modification ensures greater sensitivity to volume-supported price movements while filtering out less significant low-volume price changes. The background alternates between green (bullish) and red (bearish) to provide immediate trend feedback.
### Money Flow Index (MFI)
Displayed as the purple line, the MFI functions as a volume-weighted momentum oscillator. Operating within a natural 0-100 range, it helps identify potential overbought and oversold conditions while confirming volume support for price movements. The MFI is particularly effective at validating breakout momentum.
### Normalized On Balance Volume (OBV)
The white line represents normalized OBV, providing insight into cumulative buying and selling pressure. The normalization process scales OBV to match other components while maintaining its ability to confirm price trends through volume analysis. This component excels at identifying strong breakout movements and volume surges.
## Signal Integration
The indicator generates its most powerful signals when all three components align, particularly during breakout conditions:
Strong Bullish Signals develop when:
- Background shifts to green (VWMACD bullish)
- MFI shows strong upward momentum
- OBV demonstrates sharp volume accumulation
Strong Bearish Signals emerge when:
- Background turns red (VWMACD bearish)
- MFI exhibits downward momentum
- OBV shows significant volume distribution
## Market Application
This indicator variant is specifically designed for:
Breakout Trading:
The OBV component provides excellent sensitivity to volume surges, making it ideal for breakout confirmation and momentum validation.
Trend Following:
Sharp OBV movements combined with MFI momentum help identify and confirm strong trending conditions.
High Volatility Markets:
The indicator's design excels in active, volatile markets where clear signal generation is crucial for decision-making.
## Technical Implementation
Default Parameters:
Volume-Weighted MACD maintains traditional periods (12/26/9) while leveraging volume weighting. MFI uses standard 14-period calculation with 80/20 overbought/oversold thresholds. All components undergo normalization over a 100-period lookback for stable comparison.
Visual Elements:
- Background: VWMACD trend indication (green/red)
- Purple Line: Money Flow Index
- White Line: Normalized OBV
- Yellow Line: Combined signal (arithmetic mean of normalized components)
- Reference Lines: Key levels at 20, 50, and 80
## Trading Methodology
The indicator supports a systematic approach to breakout and momentum trading:
1. Breakout Identification
Monitor for background color changes accompanied by significant OBV movement, indicating potential breakout conditions.
2. Volume Surge Confirmation
Examine OBV slope and magnitude to confirm genuine breakout scenarios versus false moves.
3. Momentum Validation
Use MFI to confirm breakout strength and identify potential exhaustion points.
4. Combined Signal Analysis
The yellow line provides a unified view of all components, helping identify high-probability breakout opportunities.
## Interpretation Guidelines
Breakout Confirmation:
Strong breakouts typically show alignment of all three components with notable OBV surge. This configuration often precedes significant price movements.
Trend Strength:
Continuous OBV expansion during trends, supported by steady MFI readings, suggests sustained momentum.
## Market Selection
Optimal Markets Include:
- High-beta growth stocks
- Momentum-driven securities
- Stocks with significant volatility
- Active trading instruments
- Examples: TSLA, NVDA, growth stocks
## Version Information
Current Version: 2.0.0
This indicator represents a specialized adaptation of volume-based analysis, optimized for breakout trading and momentum strategies in high-volatility environments.
Cerca negli script per "OBV"

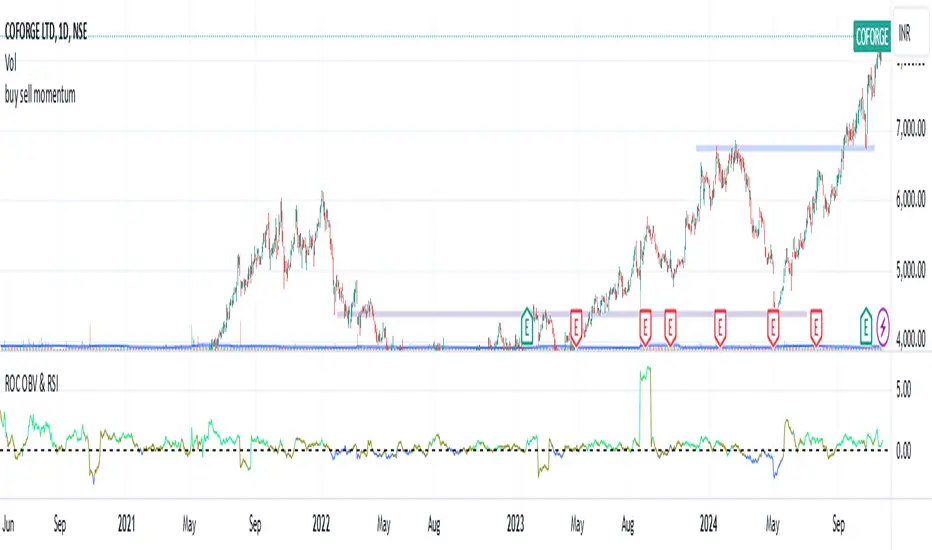
Rate of Change of OBV with RSI ColorThis indicator combines three popular tools in technical analysis : On-Balance Volume (OBV), Rate of Change (ROC), and Relative Strength Index (RSI). It aims to monitor momentum and potential trend reversals based on volume and price changes.
Calculation:
ROC(OBV) = ((OBV(today) - OBV(today - period)) / OBV(today - period)) * 100
This calculates the percentage change in OBV over a specific period. A positive ROC indicates an upward trend in volume, while a negative ROC suggests a downward trend.
What it Monitors:
OBV: Tracks the volume flow associated with price movements. Rising OBV suggests buying pressure, while falling OBV suggests selling pressure.
ROC of OBV:
Measures the rate of change in the OBV, indicating if the volume flow is accelerating or decelerating.
RSI: Measures the strength of recent price movements, indicating potential overbought or oversold conditions.
How it can be Used:
Identifying Trend Continuation: Rising ROC OBV with a rising RSI might suggest a continuation of an uptrend, especially if the color is lime (RSI above 60).
Identifying Trend Reversal: Falling ROC OBV with a declining RSI might suggest a potential trend reversal, especially if the color approaches blue (RSI below 40).
Confirmation with Threshold: The horizontal line (threshold) can be used as a support or resistance level. Bouncing ROC OBV off the threshold with a color change could suggest a pause in the trend but not necessarily a reversal.
When this Indicator is Useful:
This indicator can be useful for assets with strong volume activity, where tracking volume changes provides additional insights.
It might be helpful during periods of consolidation or trend continuation to identify potential breakouts or confirmations.
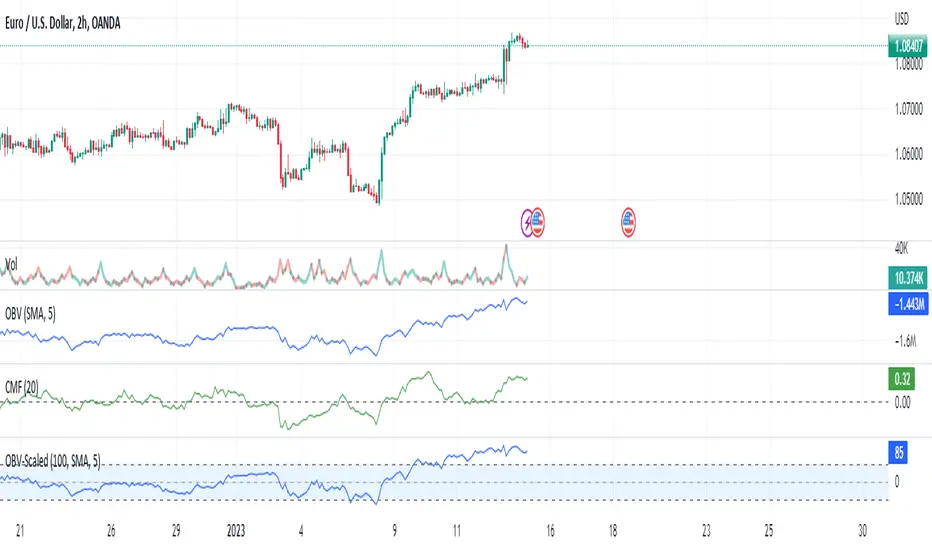
Composite Money Flow (MFI + CMF + OBV z-score)Composite Money Flow gives a single, easy-to-read readout of buy/sell pressure by combining three complementary flows:
MFI (Money Flow Index) — price × volume momentum, native 0..100
CMF (Chaikin Money Flow) — accumulation/distribution across the bar (≈ −1..+1)
OBV z-score — manual OBV (cumulative signed volume) standardized, then squashed to −100..+100
All three are normalized to the same scale (−100..+100) and combined with user-set weights to form a composite Money Flow Score plus a Signal (SMA). Use thresholds to flag strong accumulation/distribution and alerts for timely notifications.
What you get
Money Flow Score (−100..+100) with color change at zero
Signal line (SMA) to smooth whipsaw
Upper/Lower thresholds (defaults +50 / −50) with optional background shading
Component lines (optional) to see each contributor (MFI/CMF/OBV) on the same scale
Six alerts: cross up/down 0, enter/exit extreme zones, cross above/below signal
Inputs (key)
Lengths: MFI Length, CMF Length, OBV Z-Score Length, Signal Smoothing
Weights: Weight: MFI, Weight: CMF, Weight: OBV Z-Score (blend to taste)
Zones: Upper Threshold (+), Lower Threshold (−)
Display: Show Component Lines, Shade Background in Extreme Zones
How traders use it
Direction filter: Score > 0 favors longs; < 0 favors shorts.
Momentum turns: Score crosses Signal → early shift in flow.
Strength zones: Above Upper = strong buy pressure; below Lower = strong sell pressure.
Confluence: Pair with structure (S/R, trend) and execution rules (ATR stop, risk budget).
Notes (implementation)
OBV is computed manually for compatibility; then standardized (z-score) and squashed to −100..+100 (softsign).
All plots are non-repainting; signals update live until bar close like any indicator.
Alerts Provided
Money Flow crosses up 0
Money Flow crosses down 0
Money Flow enters positive zone (above Upper)
Money Flow enters negative zone (below Lower)
Money Flow crosses above Signal
Money Flow crosses below Signal
Good starting settings
MFI 14, CMF 20, OBV Z-Score 50, Signal 9
Weights: MFI 1.0, CMF 1.0, OBV 1.0
Thresholds: +50 / −50
Turn on background shading for quick visual reads
Disclaimer
This script is for educational purposes only and is not financial advice or a recommendation. Trading involves risk; past results do not guarantee future performance. Signals can fail, especially around news and regime shifts. Test on paper, verify settings, and use appropriate position sizing and risk controls. You are solely responsible for your trading decisions.

Altered OBV On MACDHere is another strategy along with an indicator that is already published for everyone to use wisely in the tradingview platform. The strategy is not very planned to highlight where to enter and when to exit as it is just a system. So, it is always good practice to follow the signal of simple moving averages and that is the reason you could find those color lines in this strategy as well.
As the indicator signals the entry point, it is wise to decide what the SMA (21, 50, 90, 200) signals us. When the price oscillated around the higher timeframe of moving averages, then it is wise to wait before entering.
OBV:
The OBV is perfect indicator to understand the strength of the particular stock. As the strength increase, the trend of the stock goes high along with price. But, the OBV is considered only with close of previous close which is to make sure the double confirmation on the price to accumulate the volume .
Altered OBV:
So, here is the altered OBV, which basically consider the close of previous close and also buying interested of the day when close is higher than open.
MACD:
I always admire the magic of MACD with pre-defined timeframe. Now, this MACD applied on top of altered OBV to signal us the moving of the ticker strength.
Long:
The long entry occurs when the MACD on Altered OBV signal bullish and the same time the MACD on close already bullish.
Short
The short denotes when the MACD on Altered OBV signal bearish and at the same time the MACD on close already bearish.
I hope this would help on your swing trading strategy.
Happy Investing.

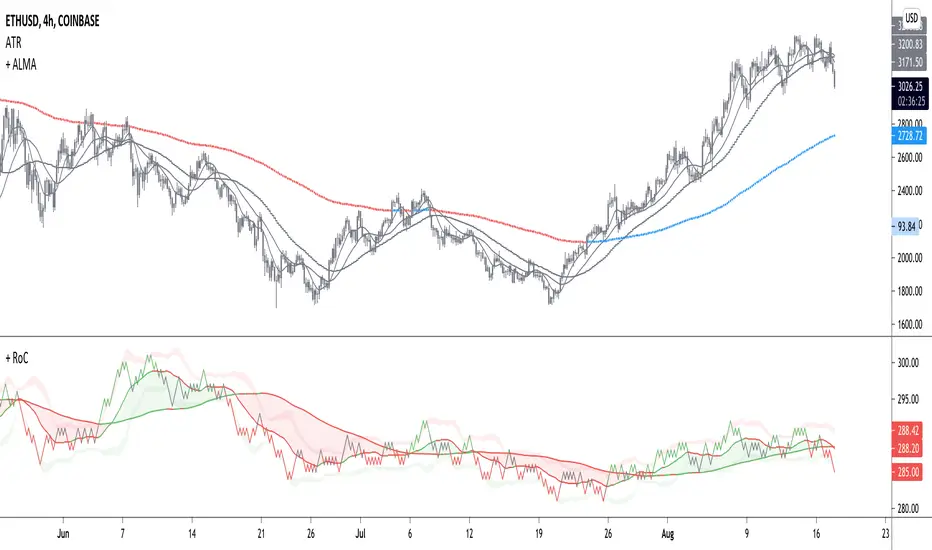
+ Rate of Change (and OBV)The Rate of Change, or RoC, is a momentum indicator that measures the percentage change in price between the current period and the price n periods ago. It oscillates above and below a zeroline, basically showing positive or negative momentum. I applied the OBV's calculation to it, but without the inclusion of volume (also added a lookback period) to see what would happen.
Actually what happened was I was looking at hot-rodding the OBV indicator, but then wondered if I could apply the cumulative calculation to another indicator to see what would happen. Not sure why I chose the Rate of Change, but it seemed a neat idea. And it worked! And so I called it the "Cumulative Rate of Change." I only recently realized that this is actually just the OBV without volume, HOWEVER the OBV does not have a lookback period, and its source is the close of each period. Basically, when you look at the calculation for the OBV you'll notice that it's a cumulative measure of the "change" of the closing price against the previous close times the volume. The Rate of Change is basically that measurement over more than one period, excluding the volume, and is not cumulative. Thus the "Cumulative Rate of Change" is basically an OBV without the volume but with the capability to adjust the lookback period.
Anyway, after days and weeks of playing with the indicator pretty infrequently I did decide that I actually really liked it, especially with the addition of moving averages and bollinger bands. So I decided to play with it a bit more.
I added a drop-down menu to include the standard Rate of Change indicator, and then thought I may as well add the OBV too, in case someone might like to compare that to the C-RoC, or just wants an OBV with myriad moving averages and bollinger bands.
By default I have the indicator set to the "C-RoC" and the lookback is set to 1, but play with longer settings (this is pretty much necessary if using the traditional RoC, which is by default set to 10 in TradingView, and is nigh on useless at 1).
I also recommend playing with the source. 'Close' is nice, but 'ohlc4' provides some very nice signals as well, as it follows the price flow for each period completely, filtering the noisiness of 'close' as source.
Hope you guys like this. With the bollinger bands and your preferred moving average settings this can be a powerful tool for re-entering trades in trend, taking profits, determining momentum swings.
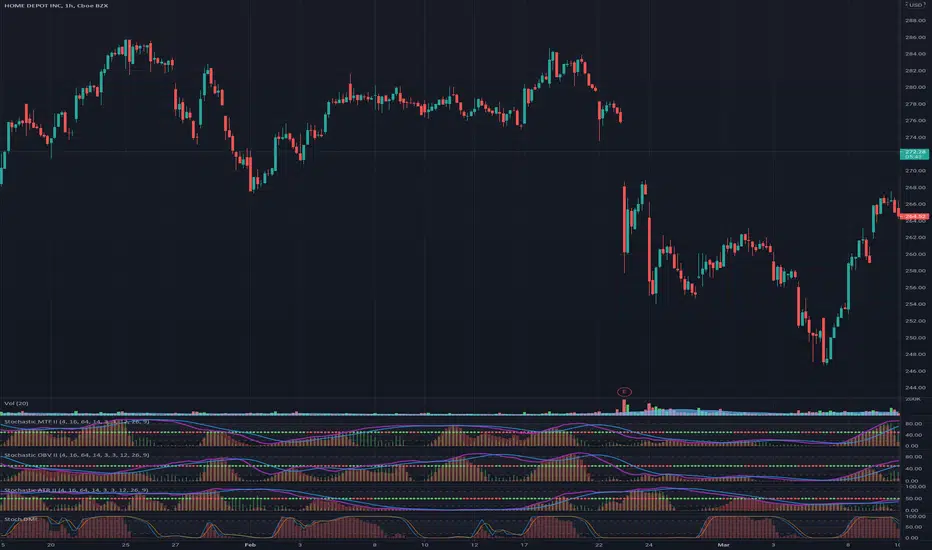
Kal's MTF OBV Haar Version 3Kal’s Multi-Time-Frame On-Balance-Volume Haar, also known as Kal’s MTF OBV Haar is a method/study for finding trending volume levels on stocks, indexes and cryptocurrencies using OBV, CMF and CCI over different time-frames (10Min, 1H, 4H, 1D, 1W, 1Month).
Upon adding to the 10Min chart, the sample Image in Tradingview looks as follows:
Note: Always check your time-frame(TF). Compare current TF to a row’s(bead row’s) time-frame. Ensure current TF is lower than a row’s time-frame when looking at it and higher time-frame rows above it. For instance, if you choose your chart’s time-frame at 1D, the lower time-frame rows(i.e. 10Min, 1H, 4H) don’t make sense.
For cryptocurrencies, one week is 7 periods, two weeks is 14 periods
For stocks, one week is 5 periods, two weeks is 10 periods
For the study of stocks, I used
9-period EMA over OBV for time-frames (10Min, 1H, 4H, D)
4-period EMA over OBV for time-frames (W, M)
For the study of cryptocurrencies, I would update EMAs as follows:
13-period EMA over OBV for time-frames (10Min, 1H, 4H, D)
6-period EMA over OBV for time-frames (W, M)
These days I'm finding the following parameters have better fitting
19-period EMA over OBV for time-frames (10Min, 1H, 4H, D)
9-period EMA over OBV for time-frames (W, M)
Description:
---------------
In the study plot, the lowest row is 10Min, the row above 10Min is 1H, then 4H, then 1D, then 1W and the highest row is 1M
Note: Always check your time-frame(TF). Compare current TF to a row’s(bead row’s) time-frame. Ensure current TF is lower than a row’s time-frame when looking at it and higher time-frame rows above it. For instance, if you choose your chart’s time-frame at 1D, the lower time-frame rows(i.e. 10Min, 1H, 4H) don’t make sense.
Lime( Bright Green) dot implies Trending Uptrend for that time-frame
Red dot implies Trending Downward for that time-frame
It’s best to wait and research for possibility of Trend Reversal during the following dots/bricks:
Silver dot implies indecisive up
Orange dot implies indecisive downtrend
Lime Brick implies CCI is near Zero line( between 15 and 0)
Red Brick implies CCI is near Zero line( between -15 and 0)
Purple dot implies CCI zero rejection to possibly/probably continue trend UP
Yellow dot implies CCI zero rejection to possibly/probably continue trend Down
Aqua dot implies that trend is overbought or oversold. This dot usually happens between red dots or green dots. Therefore, it’s best to wait for pull-back especially in lower time frames.
Safe Trading!
Kal Gandikota
Legal Disclaimer: This script is published here so I get replies from fellow viewers to educate myself. Hence, if anyone uses this script for making their financial decisions, I am not responsible for any failures incurred. If you have questions or improvements related to this script, please feel free to leave comments and as time permits, will respond to those comments.

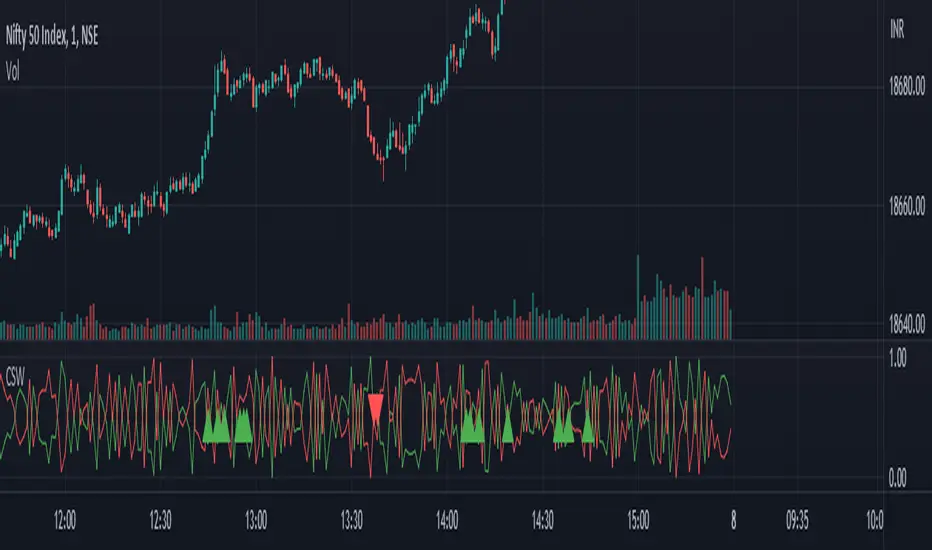
Candlestick Strength and Weakness with RSI and OBVThe "Candlestick Strength and Weakness with RSI and OBV" indicator, denoted as CSW, is a tool designed to assist traders in identifying potential trend reversals in financial markets. The CSW indicator combines the analysis of candlestick patterns, relative strength index (RSI), and on-balance volume (OBV) to provide traders with valuable insights into market dynamics.
The CSW indicator calculates the strength and weakness of each candlestick based on its open, close, high, and low prices. It considers the body range, upper shadow range, and lower shadow range of the candlestick to determine the distribution of strength and weakness within it. By quantifying the candlestick's strength and weakness, the indicator provides a visual representation of the balance between bullish and bearish forces in the market.
In addition to candlestick analysis, the CSW indicator incorporates RSI and OBV calculations to further validate potential trend reversals. The RSI is a widely-used momentum oscillator that measures the speed and change of price movements. The OBV, on the other hand, tracks the cumulative volume flow and helps identify periods of accumulation or distribution. By considering these indicators alongside candlestick strength and weakness, the CSW indicator enhances the accuracy of its signals.
To interpret the CSW indicator effectively, traders should consider the following:
Candlestick Strength and Weakness: The indicator plots two lines, "Candle Strength" and "Candle Weakness," representing the strength and weakness of each candlestick. The strength line indicates the bullish pressure, while the weakness line represents the bearish pressure.
Potential Reversal Signals: The CSW indicator identifies potential trend reversals based on the balance between candlestick strength and weakness, RSI readings, and OBV values. A bullish reversal signal occurs when the strength is higher than weakness, the RSI is below 30 (indicating oversold conditions), and the OBV is below its 20-period simple moving average (SMA). Conversely, a bearish reversal signal occurs when the weakness is higher than strength, the RSI is above 70 (indicating overbought conditions), and the OBV is above its 20-period SMA.
Trend Confirmation: The CSW indicator provides additional confirmation by comparing the closing price with the 20-period exponential moving average (EMA). If the closing price is above the EMA, it suggests an uptrend, while a closing price below the EMA indicates a downtrend.
Traders can add the indicator to their charts and customize its parameters based on their preferences. By monitoring the indicator's plots and observing the occurrence of potential reversal signals in alignment with the trend confirmation, traders can make informed decisions regarding entry or exit points in their trading strategies.
Stochastic Slow and OBV Percent Oscillator
Purpose - Stochastic is the best momentum indicator and On Balance Volume (OBV) is the best volume indicator. Why not combine both to come up with a more sophisticated oscillator?
How It's Done - I had to put OBV as an oscillator (returning values between 0 and 100) in order to put it in the same pane with the slow stochastic oscillator. Otherwise, their synergy won't be that great. So, I have decided to visualize OBV as a percentage relative to selected period's high and low value. That way, I can keep the OBV value to stay within boundary.
Interpretation
1. Dot color indicates the whether the stochastic K/OBV is over or below the stochastic D/Signal line.
2. When Stoch and OBV are moving in the same direction and are close together (on top of each other), this indicates a strong trend
3. When Stoch crosses up or down the OBV oscillator, it may indicate a trend reversal

Trigonometric On Balance Volume (OBV) OscillatorLove volume analysis but it's hard for you to implement a simple strategy by it?
Use OBV.
Is OBV still not quite as it should be for you to get it in your trading system?
Use OBV Oscillator.
Does OBV Oscillator give you too many false signals and when you smooth it, it lags by a ton?
Then this indicator is the answer to your problem.
Introducing the Trigonometric OBV Oscillator.
The Trigonometric OBV Oscillator or "Trig OBV" for short, uses an old, but uniquely extremely reliable mathematical formula to smooth the OBV, while eliminating more than 95% of its false signals (noises) and keeping with the real direction of the trend without introducing any lags.
It is very responsive, predictive even to some degree, very reliable, and keeps you out of false trades (like false breakouts, sudden changes in the price, etc).
To go long: wait until the white line crosses up the purple line and continues in that direction.
To go short: wait until the white line crosses down the blue line and continues in that direction.
To exit, do the opposite.
Better to be used with a baseline filter such as Kaufman's moving average.
Use it and let me know what you think about it.

Moving Average Convergence Divergence On Alter OBVOBV:
The OBV is perfect indicator to understand the strength of the particular stock. As the strength increase, the trend of the stock goes high along with price. But, the OBV is considered only with close of previous close which is to make sure the double confirmation on the price to accumulate the volume.
Altered OBV:
So, here is the altered OBV, which basically consider the close of previous close and also buying interested of the day when close is higher than open.
MACD:
I always admire the magic of MACD with pre-defined timeframe. Now, this MACD applied on top of altered OBV to signal us the moving of the ticker strength.
I hope the another MACDAltOBV would help on your swing trading strategy.
Happy Investing.

On Balance Volume Trend© 2022, CryptoNaut1000
An extension to "On Balance Volume Momentum (OBV Momentum)".
"OBV Trend" is a trend strength indicator, that can be used to identify strong trends and also trend changes based on volume.
High positive values indicate strong volume on the buy side, high negative values indicate strong volume on the sell side.
An increasing OBV trend indicates a strengthening buy trend or a weakening sell trend,
decreasing OBV trend indicates a strengthening sell trend or weakening buy trend.
OBV trend is calculated by plotting a short vs. a long moving average and filling the difference in volume.
OBV trend metric is absolute volume.

On Balance Volume MomentumA combination of "On Balance Volume (OBV)" and "Volume Oscillator".
"OBV Momentum" is a trend momentum indicator, that can be used to identify strong trends and also trend changes based on volume.
High positive values indicate strong volume on the buy side, high negative values indicate strong volume on the sell side.
An increasing OBV momentum indicates a strengthening buy trend or a weakening sell trend,
decreasing OBV Momentum indicates a strengthening sell trend or weakening buy trend.
OBV Momentum is calculated by comparing a short vs. a long moving average and plotting the difference in volume.
OBV Momentum metric is absolute volume.

Hashem OBV+EMA/MAThe On Balance Volume indicator (OBV) is used to measure buying and selling pressure.
It is a cumulative indicator meaning that on days where price went up, that day's volume is added to the cumulative OBV total. If price went down, then that day's volume is subtracted from the OBV total.
The OBV value is then plotted as a line for easy interpretation. OBV is primarily used to confirm or identify overall price Trends or to anticipate price movements after Divergences .
In addition to OBV, EMA and SMA are included. the EMA is used for Support and Resistances for the OBV. and the SMA is used by its Slope (can be S/R as well).

Volume +OBV + ADXVolume + OBV + ADX Table
Optimized Buyer & Seller Volume with Trend Indications
Overview:
This indicator provides a comprehensive view of market participation and trend strength by integrating Volume, On Balance Volume (OBV) trends, and ADX (Average Directional Index) signals into a visually structured table. Designed for quick decision-making, it highlights buyer and seller dominance while comparing the selected stock with another custom symbol.
Features:
✅ Buyer & Seller Volume Analysis:
Computes buyer and seller volume percentages based on market movements.
Displays daily cumulative volume statistics to assess ongoing market participation.
✅ On Balance Volume (OBV) Trends:
Identifies positive, negative, or neutral OBV trends using an advanced smoothing mechanism.
Highlights accumulation or distribution phases with colored visual cues.
✅ ADX-Based Trend Confirmation:
Evaluates Directional Indicators (DI+ and DI-) to determine the trend direction.
Uses customizable ADX settings to filter out weak trends.
Provides uptrend, downtrend, or neutral signals based on strength conditions.
✅ Custom Symbol Comparison:
Allows users to compare two different assets (e.g., a stock vs. an index or ETF).
Displays a side-by-side comparison of volume dynamics and trend strength.
✅ User-Friendly Table Display:
Presents real-time calculations in a compact and structured table format.
Uses color-coded trend signals for easier interpretation.
Recommended Usage for Best Results:
📌 Pairing this indicator with Sri_Momentum and Sri(+) Pivot will enhance accuracy and provide better trade confirmations.
📌 Adding other major indicators like RSI, CCI, etc., will further increase the probability of winning trades.
How to Use:
Select a custom symbol for comparison.
Adjust ADX settings based on market conditions.
Analyze the table to identify buyer/seller dominance, OBV trends, and ADX trend strength.
Use the combined signals to confirm trade decisions and market direction.
Best Use Cases:
🔹 Trend Confirmation – Validate breakout or reversal signals.
🔹 Volume Strength Analysis – Assess buyer/seller participation before entering trades.
🔹 Multi-Asset Comparison – Compare the behavior of two related instruments.
This indicator is ideal for traders looking to combine volume dynamics with trend-following strategies. 🚀📈
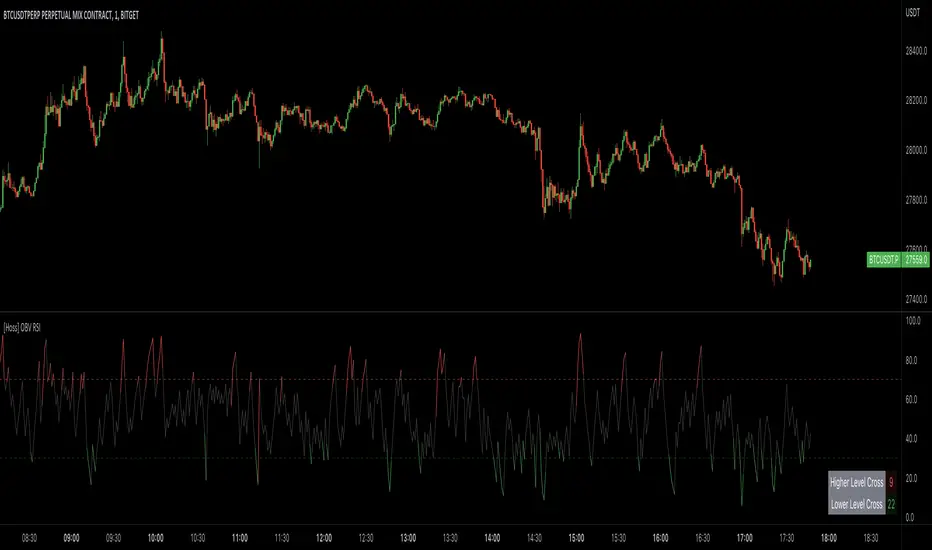
[Hoss] OBV RSIThe OBV ( On Balance Volume ) RSI ( Relative Strength Index ) indicator is an innovative tool that combines the power of OBV and RSI to provide traders with a comprehensive view of the market's momentum and volume dynamics. This combination enables users to make better-informed trading decisions by analyzing the relationship between price, volume , and relative strength .
The script starts by calculating the On Balance Volume , which is a cumulative volume-based indicator that measures buying and selling pressure. The OBV increases when the closing price is higher than the previous closing price and decreases when the closing price is lower than the previous closing price. This helps traders identify potential price trend reversals based on volume accumulation or distribution.
Next, the script computes the Relative Strength Index ( RSI ) based on the OBV values, offering a unique perspective on the market's momentum through the lens of volume . The RSI is a popular momentum indicator that ranges from 0 to 100 and helps traders identify overbought and oversold conditions. In this script, the user can define the RSI length and the higher and lower levels (default values are 70 and 30, respectively).
A distinctive feature of this OBV RSI indicator is the addition of a monitor that counts the number of times the RSI crosses above the higher level and below the lower level within a user-defined lookback period. This monitor is displayed as a table in the bottom right corner of the chart and can be enabled or disabled through an input option.
The cross count monitor provides valuable insights into the historical frequency of RSI crossings, helping traders to identify potential trading opportunities based on historical price behavior around these levels.
Anchored OBVThe On Balance Volume indicator (OBV) is used in technical analysis to measure buying and selling pressure.
It is a cumulative indicator meaning that on days where price went up, that day's volume is added to the cumulative OBV total.
If price went down, then that day's volume is subtracted from the OBV total.
The OBV value is then plotted as a line for easy interpretation.
On Balance Volume is primarily used to confirm or identify overall price trends or to anticipate price movements after divergences.
If On Balance Volume crosses over or under the zero line, it adds confluence to a bull/bear bias respectively.
Anchored On Balance Volume unlike traditional OBV, resets on your specified date and/or bar (clickable).

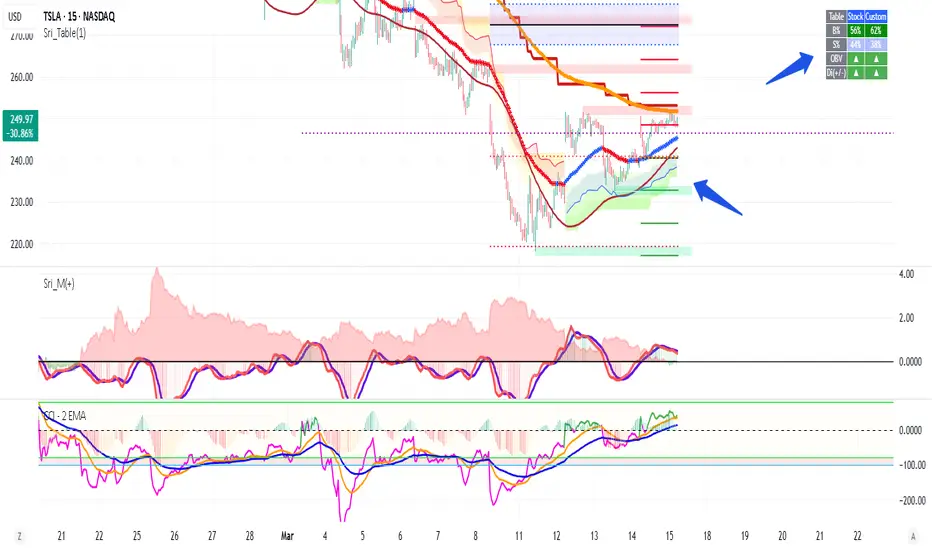
Hotch DMI+OBV+RSI ConfluenceThis Indicator uses the Relative Strength Index, On Balance Volume, and ADX to identify viable trading trends.
A quick description of what is on display:
1.) Green Triangle = OBV crossing over OBV MA
2.)Red Triangle = OBV Crossing under OBV SMA
3.) The background coloring between the RSI Oversold and Overbought Values has multiple conditions.
----It is green when the DI+ > DI-
----It is purple when the DI+ < DI-
----the brightness represents the ADX value. Darker areas(or more transparent) show a weak ADX value(4). Brighter (or less transparent) show a stronger ADX value(3)
5.) RSI and RSI moving average, including a divergence indicator.
6.) A histogram representing the normalized value of OBV-OBVMA to show changes in value while remaining readably in range on the chart with other indicators.
In the included chart screen shot is an example of an applicable strategy. This example is no guaranteed success and is also not the only strategy applicable to the indicator.

Triple OBVThe on-balance volume (OBV) is a momentum indicator reflecting the volume inflow or outflow based on the price changes. Here I further develop this indicator as a triple OBV indicator, in which I apply obv10, obv20, and obv40 as the short-, intermediate-, and long-term OBVs.
To better visualize the triple OBV movement, three OBV lines are colored-coded based on the trends (uptrend: blue; no trend: gray; downtrend: red). Also, I use obv180 as a noise filter to show the reversal signals. Note that for any given trend reversals, three OBV lines must go through a convergent phase.

[A618] Liquidity Levels Based OBV SR with KAMAWe all know OBV plays a very important role in figuring out price volume divergences and it can help anyone analyse the directivity force of the market and has a very good tradeoff if applied correctly
In this Experiment i have derived liquidity levels for OBV using volume jumps inside the market
A volume jump is classified as:
Good Volume Jump = 1.618 times the Average Volume (WMA or 2pole ButterWorth's Filter of Volume)
Great Volume Jump = 2 times the Average Volume (WMA or 2pole ButterWorth's Filter of Volume)
Extreme Volume Jump = 3 times the Average Volume (WMA or 2pole ButterWorth's Filter of Volume)
So the horizontal levels which you see on the indicator (colored in red/ blue / gray lines) are the derived Liquidity Levels for OBV in the Market, these are the levels where OBV is most likely to perform a movement or come back
Also I have applied KAMA indicator on top of OBV for better Directive guidance, as of my experiments KAMA seems to be most stable and consistence of all the other moving averages,
KAMA's Length inculde:
KAMA - 8
KAMA - 34
KAMA - 200
Hope this Script help you guys!
Thanks to Tradingview for providing such an awesome platform
##Note for Credits ::
The Ehlers 2 pole butterworth Filter function is derived from @cheatcountry script ()

FTR, WMA, OBV & RSI StrategyThis Pine Script code is a trading strategy that uses several indicators such as Fisher Transform (FTR), On-Balance Volume (OBV), Relative Strength Index (RSI), and a Weighted Moving Average (WMA). The strategy generates buy and sell signals based on the conditions of these indicators.
The Fisher Transform function is a technical indicator that uses past prices to determine whether the current market is bullish or bearish. The Fisher Transform function takes in four multipliers and a length parameter. The four multipliers are used to calculate four Fisher Transform values, and these values are used in combination to determine if the market is bullish or bearish.
The Weighted Moving Average (WMA) is a technical indicator that smooths out the price data by giving more weight to the most recent prices.
The Relative Strength Index (RSI) is a momentum indicator that measures the strength of a security's price action. The RSI ranges from 0 to 100 and is typically used to identify overbought or oversold conditions in the market.
The On-Balance Volume (OBV) is a technical indicator that uses volume to predict changes in the stock price. OBV values are calculated by adding volume on up days and subtracting volume on down days.
The strategy uses the Fisher Transform values to generate buy and sell signals when all four Fisher Transform values change color. It also uses the WMA to determine if the trend is bullish or bearish, the OBV to confirm the trend, and the RSI to filter out false signals.
The red and green triangular arrows attempt to indicate that the trend is bullish or bearish and should not be traded against in the opposite direction. This helps with my FOMO :)
All comments welcome!
The script should not be relied upon alone, there are no stop loss or take profit filters. The best results have been back-tested using Tradingview on the 45m - 3 hour timeframes.

On Balance Volume Scaled - OBV ScaledThe main idea of this oscillator is to place the OBV oscillator and its oscillation around the range of 0 and around -50 to +50 and for this scaling of the "On Balance Volume" oscillator, I have used Min-max normalization.
Since this oscillator does not have a specific minimum and maximum, just setting the maximum and minimum does not seem the best thing to do. As in this case, we will constantly observe sudden changes and we will have problems such as volatility. On the one hand, we will constantly deal with sudden changes and problems such as volatility. Also on the other hand, the continuous collisions of the high/low(+50 & -50) and index and returning from that is another thing that we are going to deal with.
Therefore, to solve these problems and create more flexible maximum and minimum ranges, another similar method has been used. Choosing the maximum of our normalization to the size of the moving average of 100 candles of the index maximum and choosing the minimum of normalization to the size of the moving average of 100 candles of the minimums of the OBV index, and then normalizing the OBV index with the Min-max method with those ranges, is the recommended method ,which has been used to eliminate problems. In this case, we will not have any problem hitting 50 and returning or hitting -50 and returning. Also, our scaled OBV index will have the ability to touch and cross 50 and -50 and can fluctuate without problems.
Stochastic OBV IIUses OBV to plot a stochastic graph. Incorporates the macd of obv and plots a stochastic of this macd. Additionally stochastic rsi of OBV is plotted in histograms.
The stochastic OBV is in the higher timeframe(current time frame * 4).
Cryptohopper OBVCryptohopper is an automated trading platform where you can automate your strategy based on technical indicators and candlestick patterns. OBV is one the indicators that you can automate with Cryptohopper.
How can you automate it? OBV gives a Buy signal when the OBV value crosses up its moving average (default: EMA) and a Sell signal when it crosses down its moving average.
If you include volume analyses in your trading strategy, automating OBV will give buy signals whenever volume and price are rising altogether.
Start automating your trading in Cryptohopper.com
--CRYPTOHOPPER--
