Crypto Narratives: Relative Strength V2Simple Indicator that displays the relative strength of 8 Key narratives against BTC as "Spaghetti" chart. The chart plots an aggregated RSI value for the 5 highest Market Cap cryopto's within each relevant narrative. The chart plots a 14 period SMA RSI for each narrative.
Functionality:
The indicator calculates the average RSI values for the current leading tokens associated with ten different crypto narratives:
- AI (Artificial Intelligence)
- DeFi (Decentralized Finance)
- Memes
- Gaming
- Level 1 (Layer 1 Protocols)
- AI Agents
- Storage/DePin
- RWA (Real-World Assets)
- BTC
Usage Notes:
The 5 crypto coins should be regularly checked and updated (in the script) by overtyping the current values from Rows 24 - 92 to ensure that you are using the up to date list of highest marketcap coins (or coins of your choosing).
The 14 period SMA can be changed in the indicator settings.
The indicator resets every 24 hours and is set to UTC+10. This can be changed by editing the script line 19 and changing the value of "resetHour = 1" to whatever value works for your timezone.
There is also a Rate of Change table that details the % rate of change of each narrative against BTC
Horizontal lines have been included to provide an indication of overbought and oversold levels.
The upper and lower horizontal line (overbought and oversold) can be adjusted through the settings.
The line width, and label offset can be customised through the input options.
Alerts can be set to triggered when a narrative's RSI crosses above the overbought level or below the oversold level. The alerts include the narrative name, RSI value, and the RSI level.
Cerca negli script per "Relative"

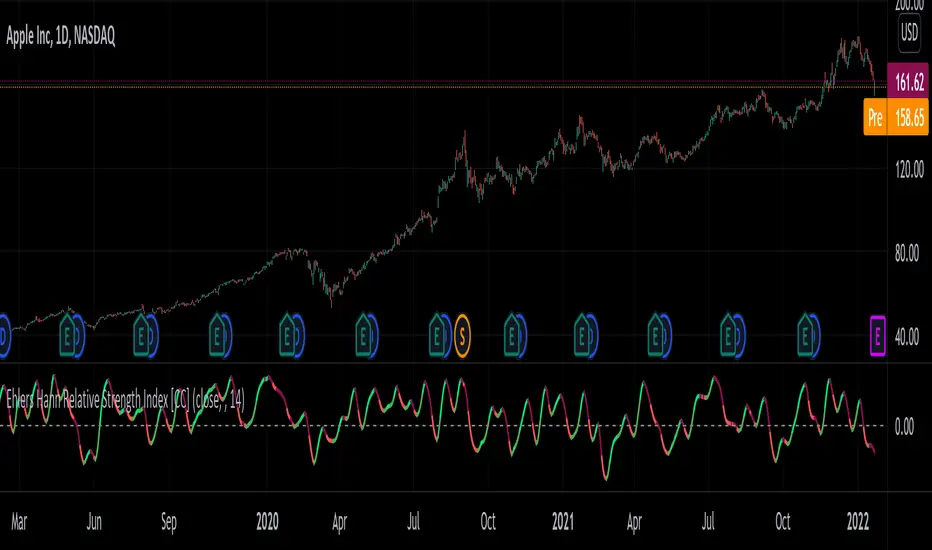
Ehlers Hann Relative Strength Index [CC]The Hann Relative Strength Index was created by John Ehlers (Stocks and Commodities Jan 2022 pgs 26-28) and this indicator builds upon his Hann Window Indicator to create an unique rsi indicator that doesn't rely on overbought or oversold levels to determine a reversal point and also provides a very superior smoothing without any of the lag associated with traditional smoothing. A much more useful RSI than the standard version in my honest opinion. Short term you buy when the line turns green and sell when it turns red. Medium to long term you buy when the indicator rises above the 0 line and sell when it falls below the 0 line. I have included strong buy and sell signals in addition to normal ones so strong signals are darker in color and normal signals are lighter in color.
Let me know if there are any other indicators or scripts you would like to see me publish!
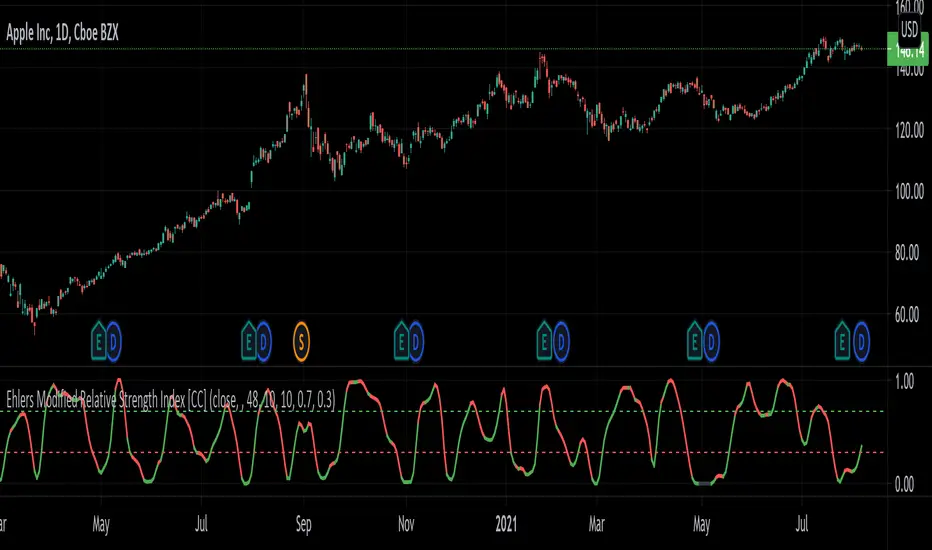
Ehlers Modified Relative Strength Index [CC]The Modified Relative Strength Index was created by John Ehlers (Cycle Analytics For Traders pgs 87-88) and this is a typical RSI that uses his roofing filter as the input. He smooths it with his own super smoother filter to provide signals. This indicator is extremely reactive and works in cycles so keep that in mind. I haven't been able to come up with clear buy and sell signals at this point so let me know if you any suggestions but I'm publishing the code to complete my goal of publishing all of his work one day. I will be publishing a bunch of Ehlers scripts in the next few weeks so stay tuned. What I recommend for buy and sell signals at this point are to buy when the indicator goes below the oversold line and starts going up and sell when the indicator goes below the oversold line a second time. Vice versa for sell signals.
Let me know if there are any other scripts you would like to see me publish!
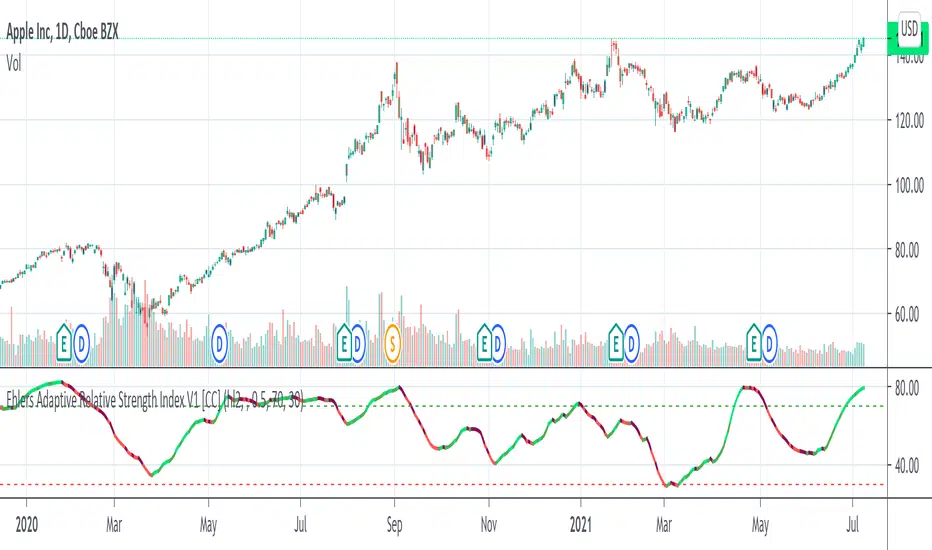
Ehlers Adaptive Relative Strength Index V1 [CC]The Adaptive Relative Strength Index was created by John Ehlers and this is his first version. I will of course publish his updated version at a later date along with publishing the final script from Jim Sloman's Ocean Theory book. I have changed his script to include extra smoothing to provide clear buy and sell signals. This is a version of a RSI that is very adaptive to changes by finding the length of the current cycle and using that to calculate the rsi and I use this same basic process to provide extra smoothing. A great strategy of course is to buy right after the indicator goes from below the oversold level to right above it and stay in until the indicator turns red or when it reaches the overbought level. I have included strong buy and sell signals in addition to normal ones and the darker colors mean strong signals and lighter colors are normal signals.
Let me know what other indicators you would like to see me publish!
Folded Relative Strength Index [CC]The Folded Relative Strength Index was created by Richard Poster (Stocks and Commodities July 2021 pg 21) and this indicator provides both trend strength but also momentum and of course reversal points using the overbought and oversold markers. If the indicator line is above the mid line then this shows upward momentum and when it falls below the midline then this means it is losing momentum. When the indicator rises above the signal line then this shows upward trend strength and vice versa. Buy when the indicator line turns green and sell when it turns red.
Let me know if there are any other indicators you would like to see me publish!

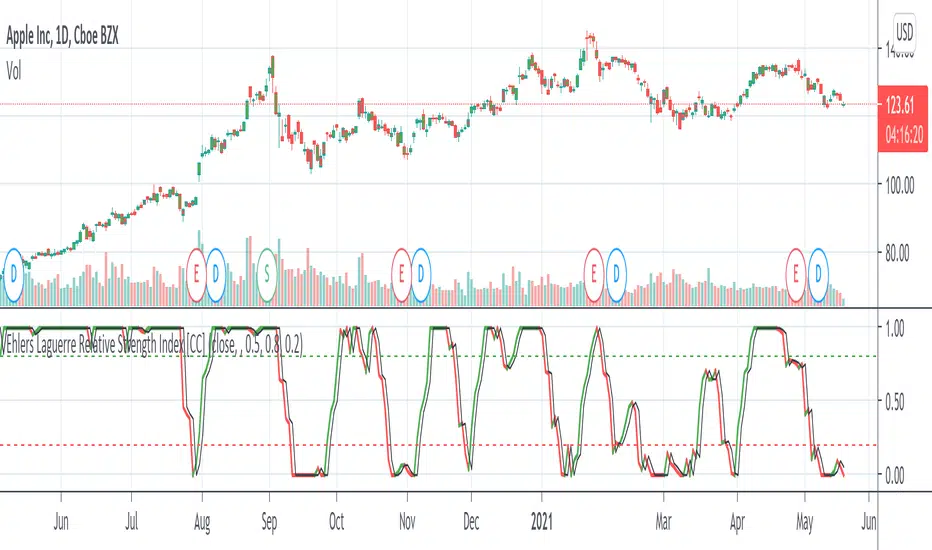
Ehlers Laguerre Relative Strength Index [CC]The Laguerre Relative Strength Index was created by John Ehlers and this is essentially his version of the RSI but I find that the buy and sell signals work better with his version as you can see. Buy when the line turns green and sell when the line turns red.
Let me know if there are any other indicators you want me to publish!
VWAP Relative Strength Index [CC]This is a custom indicator of mine that uses the volume weighted average price instead of the close price as the source for calculations of the relative strength index. Buy when the indicator line is green and sell when it is red.
This was a custom request so let me know if there are any other scripts you would like to see me do or if you want something custom done!

Normalized Relative Strength Index with Bollinger band This Relative Strength Index with Bollinger band is to determine strength of momentum of certain price.

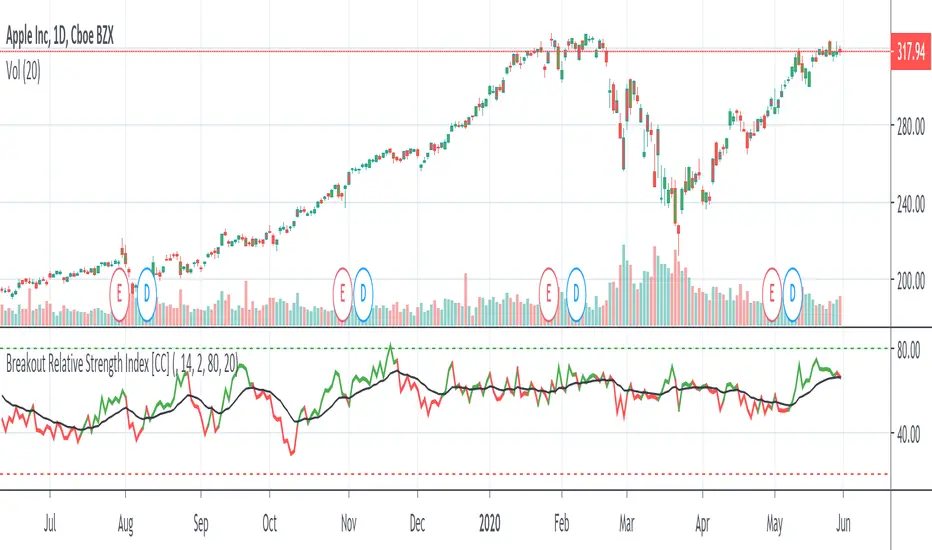
Breakout Relative Strength IndexIt isn't easy to determine if the price of a stock is about to break out. Here’s one way you can determine the relative strength of a breakout, enabling you to act early and realize higher profits.
This indicator was originally developed by Howard Wang Stocks & Commodities V. 33:09 (60–62)
Function : Relative Strength Index The relative strength index function is defined.
Now you can easily use length with mutable variables !!

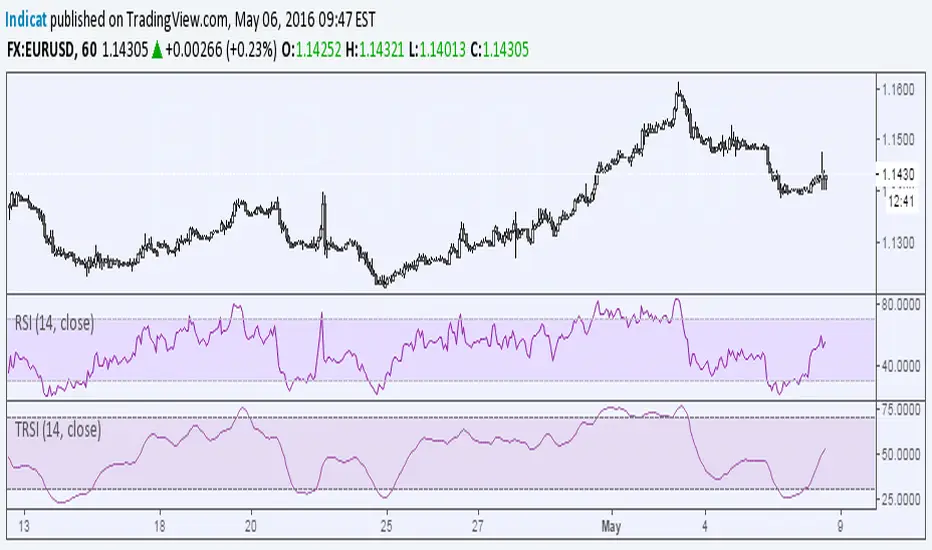
Relative Strength Index on TranquilizersSome weeks ago, I had a patient in my practice who suffered from internal stability disorders.
Certainly not a case of disordered thinking or schizophrenic behaviour, because his general sense of direction wasn’t the problem.
He just couldn’t find the right overall balance, an ailment he struggled with for years.
Straight away I could diagnose that surgery wasn’t an option, so I gave him a medicine he would clearly benefit from.
I never heard from him again…. He must be doing just fine.
Cheers, Indicat...
[LAVA] Relative Price DifferenceThis script shows the relative price difference based off the last high and low, so many bars ago. Bollinger bands are also included by default for closer inspection on the intensity of the movement or the lack thereof. Bollinger bands will follow the smoothed line which will allow the reactionary line to cross the boundary during an intense movement. With the colors selected, a gray color will appear after the color to the zero line to announce a deep correction is possible. Buy/Sell indicators show up as crosses to indicate when the price is moving in a certain direction. Sideways stagnation will have several crosses due to the close proximity to the zero line.
I use 21 in the demo here without the bollinger bands or buy/sell indicators to show the power of the script to identify bottoms and tops using the tips and hand drawn trendlines.
(This script is actually the same script as before, but listed here as the final version. Hopefully this will be my last update with this script.)
If you use and enjoy this script, please like it!

Relative Strength Index 2 buy a sellThis is my tool, I wanted to publish it so that my friend can easily find my tool
Relative Strength Index - Divergences - LibertusHello all,
To ease everyone's trading experience I made this script which colors RSI overbought and oversold conditions and as a bonus displays bullish or bearish divergences in last 50 candles (by default, you can change it).
Script is open source, part of code is from Trading View examples. If you have suggestions or you already made some improvements, please report in comment.
Happy trading and good luck!

Relative Strength Index (OSC)Hello everyone, I'm sorry that the previous open-source version was hidden due to the house rules, I've re-edited the description and re-posted it
(1) Indicator introduction
This is RSI indicator with original divergence algorithm
This indicator is plotted on the RSI and can display the divergence locations and corresponding divergence intensity
The tolerance of N Klines at the top or bottom positions for price and indicator is supported, which is set by the "Tolerant Kline Number"
Support the display of divergence intensity, that is, the REG/HID value displayed on the label, which is less than 0. The smaller the intensity value, the more obvious divergence
Support the filtering of divergence intensity, which is set by "Cov Threshold". The divergence that REG/HID divergence intensity greater than this value will be ignored
In the label, REG indicates regular top/bottom divergence while HID indicates hidden top/bottom divergence
In the label, SRC(x-y) indicates a divergence occurred from the x-th kline to the y-th kline
In the label, OSC(x-y) indicates a divergence occurred from the indicator corresponding to the x-th kline to the y-th kline
(2) Parameter introduction
- RSI Settings
Source: The source to calculate RSI, close by default
RSI Length: The length of RSI, 14 by default
- RSI Divergence
Pivot Lookback Right: Number of K-line bars recalling the pivot top/bottom point to the right
Pivot Lookback Left: Number of K-line bars recalling the pivot top/bottom point to the left
Max of Lookback Range: Maximum number of retracing K-line bars to find the pivot top/bottom point
Min of Lookback Range: Minimum number of retracing K-line bars to find the pivot top/bottom point
Tolerant Kline Number: Maximum tolerance in indexing top/bottom points of Klines and indicators
Cov Threshold: Divergence intensity, which is less than 0. The smaller the intensity value, the more obvious divergence
Plot Bullish: Whether to draw regular bullish divergence label
Plot Hidden Bullish: Whether to draw hidden bullish divergence label
Plot Bearish: Whether to draw regular bearish divergence label
Plot Hidden Bearish: Whether to draw hidden bearish divergence label
Happy trading and enjoy your life!
————————————————————————————————————————
各位朋友大家好,很抱歉之前的开源版本因为规则原因被隐藏,我已经重新编辑了说明并重新发布
(1) 指标说明
该指标绘制于 RSI 上,并在对应位置显示背离点以及背离程度
支持顶底位置 N 根K线的容差,由 Tolerant Kline Number 参数设置
支持背离强度的显示,即标签上显示的 REG/HID 值,该值小于 0,且越小说明背离程度越大
支持背离强度的过滤,由 Cov Threshold 参数设置, REG/HID 值大于这个值的背离会被忽略
标签中,REG 表示常规顶/低背离,而 HID 表示隐藏顶/底背离
标签中,SRC(x-y) 表示从当前第 x 根 bar 开始到第 y 跟 bar 出现背离
标签中,OSC(x-y) 表示从当前第 x 根 bar 所对应的指标开始到第 y 跟 bar 所对应的指标出现背离
(2) 参数说明
- RSI Settings
Source: 计算 RSI 指标的 source,默认为 close
RSI Length: 计算 RSI 指标的长度,默认为 14
- RSI Divergence
Pivot Lookback Right: 枢纽顶/底点往右回顾的 K线 bar 数量
Pivot Lookback Left: 枢纽顶/底点往左回顾的 K线 bar 数量
Max of Lookback Range: 回寻找枢纽顶/底点的最大回溯 K线 bar 数量
Min of Lookback Range: 回寻找枢纽顶/底点的最小回溯 K线 bar 数量
Tolerant Kline Number: K线和指标的顶/底点索引的最大误差
Cov Threshold: 背离程度,该值小于 0,且越小说明背离程度越大
Plot Bullish: 是否绘制常规底背离提示
Plot Hidden Bullish: 是否绘制隐藏底背离提示
Plot Bearish: 是否绘制常规顶背离提示
Plot Hidden Bearish: 是否绘制隐藏顶背离提示
祝大家交易愉快

Relative Strength Index (SRC)Hello everyone, I'm sorry that the previous open-source version was hidden due to the house rules, I've re-edited the description and re-posted it
(1) Indicator introduction
This is RSI indicator with original divergence algorithm
This indicator is plotted on the klines and can display the divergence locations and corresponding divergence intensity
The tolerance of N Klines at the top or bottom positions for price and indicator is supported, which is set by the "Tolerant Kline Number"
Support the display of divergence intensity, that is, the REG/HID value displayed on the label, which is less than 0. The smaller the intensity value, the more obvious divergence
Support the filtering of divergence intensity, which is set by "Cov Threshold". The divergence that REG/HID divergence intensity greater than this value will be ignored
In the label, REG indicates regular top/bottom divergence while HID indicates hidden top/bottom divergence
In the label, SRC(x-y) indicates a divergence occurred from the x-th kline to the y-th kline
In the label, OSC(x-y) indicates a divergence occurred from the indicator corresponding to the x-th kline to the y-th kline
(2) Parameter introduction
- RSI Settings
Source: The source to calculate RSI, close by default
RSI Length: The length of RSI, 14 by default
- RSI Divergence
Pivot Lookback Right: Number of K-line bars recalling the pivot top/bottom point to the right
Pivot Lookback Left: Number of K-line bars recalling the pivot top/bottom point to the left
Max of Lookback Range: Maximum number of retracing K-line bars to find the pivot top/bottom point
Min of Lookback Range: Minimum number of retracing K-line bars to find the pivot top/bottom point
Tolerant Kline Number: Maximum tolerance in indexing top/bottom points of Klines and indicators
Cov Threshold: Divergence intensity, which is less than 0. The smaller the intensity value, the more obvious divergence
Plot Bullish: Whether to draw regular bullish divergence label
Plot Hidden Bullish: Whether to draw hidden bullish divergence label
Plot Bearish: Whether to draw regular bearish divergence label
Plot Hidden Bearish: Whether to draw hidden bearish divergence label
Happy trading and enjoy your life!
————————————————————————————————————————
各位朋友大家好,很抱歉之前的开源版本因为规则原因被隐藏,我已经重新编辑了说明并重新发布
(1) 指标说明
该指标绘制于 K线 上,并在对应位置显示背离点以及背离程度
支持顶底位置 N 根K线的容差,由 Tolerant Kline Number 参数设置
支持背离强度的显示,即标签上显示的 REG/HID 值,该值小于 0,且越小说明背离程度越大
支持背离强度的过滤,由 Cov Threshold 参数设置, REG/HID 值大于这个值的背离会被忽略
标签中,REG 表示常规顶/低背离,而 HID 表示隐藏顶/底背离
标签中,SRC(x-y) 表示从当前第 x 根 bar 开始到第 y 跟 bar 出现背离
标签中,OSC(x-y) 表示从当前第 x 根 bar 所对应的指标开始到第 y 跟 bar 所对应的指标出现背离
(2) 参数说明
- RSI Settings
Source: 计算 RSI 指标的 source,默认为 close
RSI Length: 计算 RSI 指标的长度,默认为 14
- RSI Divergence
Pivot Lookback Right: 枢纽顶/底点往右回顾的 K线 bar 数量
Pivot Lookback Left: 枢纽顶/底点往左回顾的 K线 bar 数量
Max of Lookback Range: 回寻找枢纽顶/底点的最大回溯 K线 bar 数量
Min of Lookback Range: 回寻找枢纽顶/底点的最小回溯 K线 bar 数量
Tolerant Kline Number: K线和指标的顶/底点索引的最大误差
Cov Threshold: 背离程度,该值小于 0,且越小说明背离程度越大
Plot Bullish: 是否绘制常规底背离提示
Plot Hidden Bullish: 是否绘制隐藏底背离提示
Plot Bearish: 是否绘制常规顶背离提示
Plot Hidden Bearish: 是否绘制隐藏顶背离提示
祝大家交易愉快

Relative Strength Index - MayurRSI backtesting long only portfolio builder.
only for investing at cheap valuations

Relative Strength Index - Divergences, Stoch, Reverse StochThis is aggregation of RSI indicators - RSI, Divergences, Reverse & Stochastic RSI
Thanks to ©JayTradingCharts and ©mohanee for the RSI Divergences code
Thanks to BApig - Motgench, balipour and Wugamlo for the reverse stoch code
Changes:
1. Add option to calc divs based on close or wicks or both (RSI is close based)
2. Add pivots (marking local high/low)
3. Update to Pine v5
4. Cleanup of unused code

Relative Strength Index (RSI) - MotiveWave versionThis is an updated RSI version of the original RSI built-in indicator where the oversold and overbought areas are highlighted.
People who are familiar with MotiveWave, this RSI updated version has a similar look as the RSI indicator in MotiveWave.
Enjoy it!
RSI Signals by HBRELATIVE STRENGTH INDEX (RSI)
This is a tool that is widely used
Especially for Overbought and Oversold systems, but I have made some changes in this indicator,
How to use it...!
I have set it as the default setting
- RSI Length: 7
- Overbought: 70
- Oversold: 30
What is unique about this tool?
we can see 3 conditions:
1) RSI Overbought / Oversold with Bullish Engulfing / Bearish Engulfing
2) RSI Overbought / Oversold with Hammer and Shooting Star
3) RSI Overbought / Oversold with 2 Bullish Bars / 2 Bearish Bars
4) RSI Overbought / Oversold with All Patterns at the same time
When the RSI reaches its Oversold line, the code will wait for Bullish Engulfing pattren , when oversold and Bullish engulfing matched, This indicator will generate a buy signal when the condition is met,
and same as for Bear market, When the RSI reaches its Overbought line, the code will wait for Bearish Engulfing pattren , This indicator will generate a sell/exit signal when the condition is met,
2nd condition is that a Hammer candle will be waited for when RSI touches the Overbought line, for Bullish Move
and Shooting Star candle will be waited for when RSI touches the Overbought line, for Bullish Move, for Bearish Move
3rd Condition is also the same as Condition 1 and Condition 2,
When the RSI reaches its Oversold line, the code will wait for 2 Bullish Bars , when oversold and 2 Bullish Bars matched then this indicator will generate a buy signal, and same as for Bear market,
When the RSI reaches its Overbought line, the code will wait for 2 Bearish Bars , when overbought and 2 Bearish Bars matched then this indicator will generate a Sell signal,
4th Condition is that we can use All Conditions at the same time,
- Bullish Engulfing / Bearish Engulfing
- Hammer and Shooting Star
- 2 Bullish Bars / 2 Bearish Bars

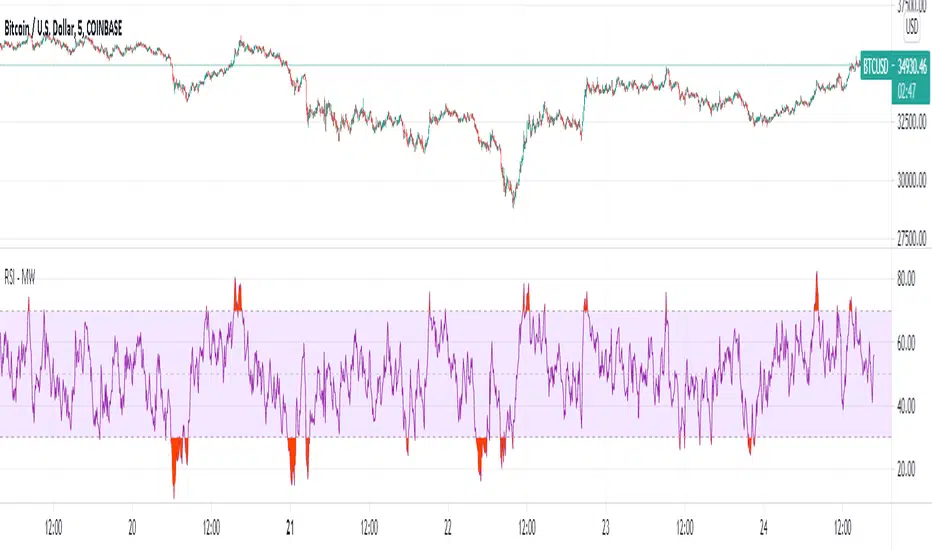
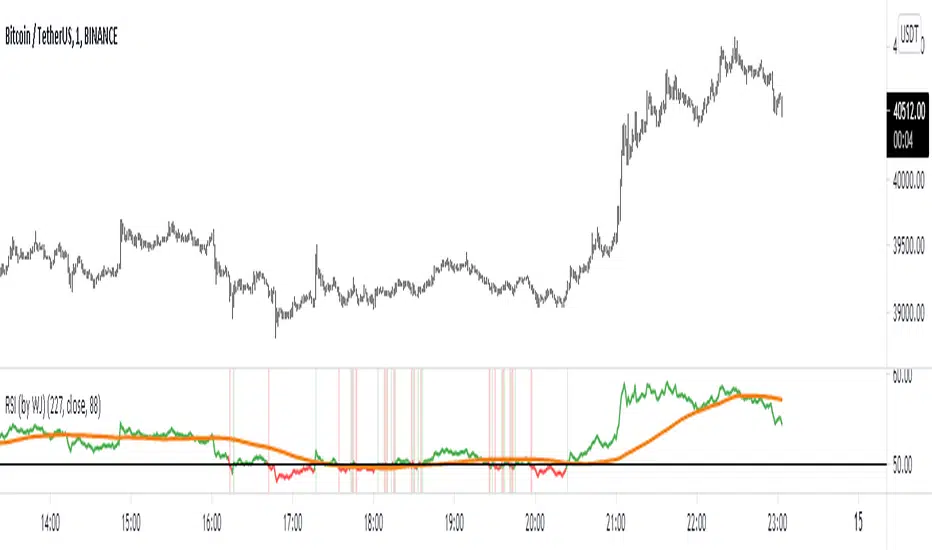
Relative Strength Index w/ 3 Levels & 0 Line Colour (by WJ)NOTE:
// RSI CODE TAKEN FROM DEFAULT INDICATOR
// I HAVE ONLY MADE SOME ADJUSTMENTS FOR VISUAL AID
// I MADE THIS FOR MY OWN USE BUT HAVE DECIDED TO PUBLISH AND SHARE IN CASE ANYBODY WANTS TO USE IT
This is the normal default built-in RSI indicator which I have added some stuff for visual aid:
Added middle line (50)
RSI turns green when crossed above 50
RSI turns red when crossed below 50
RSI background turns green and red on crossover candle based on whether RSI just crossed over or below 50 respectively
Alert notification on the crossover candle
Relative Strength Index; expertHow to use
Uptrend
Buy or Long on dip when RSI>50 or similar, RSI>Signal line and Divergence.
Downtrend
Short on dip(for a downtrend) when RSI<50 or similar, RSI
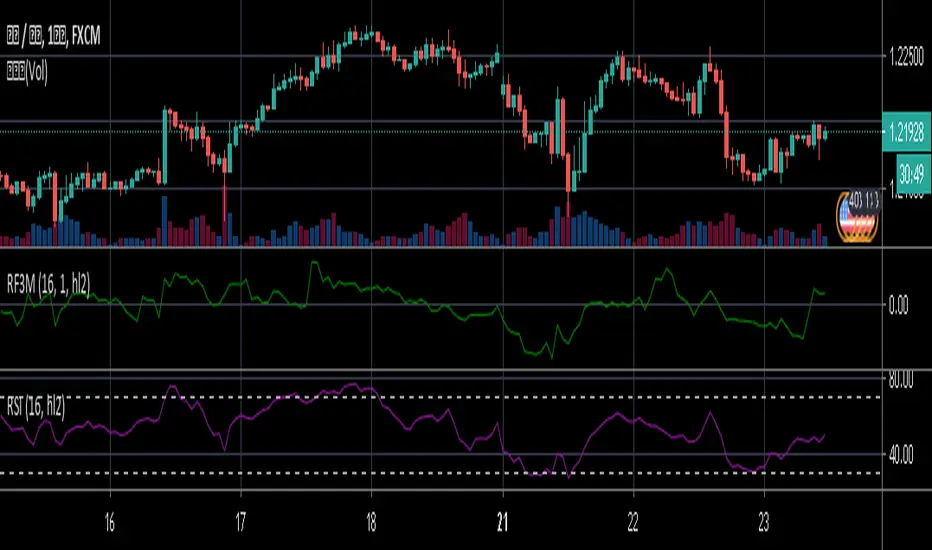
Relative Falling three Methods IndicatorAbstract
This script measure the related speed between rising and falling.
This script can replace binary Falling Three Methods detector and, report continuous value and estimate potential trend direction.
My suggestion of using this script is combining it with trading emotion.
Introduction
Falling Three Methods (F3M) is a candlestick pattern.
Many trading courses say traders can regard it as predicting falling will continue.
However, it is not easy to see perfect Falling Three Methods pattern from charts.
Therefore, we need an alternative method to measure it.
We can use the observation that falling is faster than rising during those time.
When falling is faster than rising, some long ( buy , call , higher , upper ) position owners may worry the price will fall very much suddenly.
When rising is faster than falling, some traders may worry they may miss buy opportunities.
Computing Related Falling Three Methods Indicator
(1) The value of rising and falling
In this script, open price is replaced with previous close price.
If the previous price is equal to the close price, than both rising and falling are equal to high-low.
If the previous price is lower than the close price, than the falling value becomes smaller, high-close+previous-low.
If the previous price is higher than the close price, than the rising value becomes smaller, high-previous+close-low.
(2) Area of value (aov)
Area of value is equal to highest-lowest. The previous close price is included.
(3) Compute weight and filter noise
We need a threshold for the noise filter. The default setting is aov/length, where length means how many days are counted.
When a rising or falling value <= threshold, it is not counted.
When a rising or falling value > threshold, the counted value = original value - threshold
and its weight = min ( counted value , threshold )
(4) compute speed
Rising speed = sum ( counted rising value ) / sum ( rising weight )
Falling speed = sum ( counted falling value ) / sum ( falling weight )
(5) Final result
Final result = Rising speed / ( Rising speed + Falling speed ) * 100 - 50
I move the middle level to 0 because 0 axis is always visible unless you cannot see negative values or you cannot see positive values.
Parameters
Length : how many days are counted. The default value is 16 just because 16=4*4, using binary characteristic.
Multi : the multiplier of noise threshold. Threshold applied = default threshold * multi
src : current not used
Conclusion
Related Falling Three Methods Indicator can measure the related speed between rising and falling.
I hope this indicator can help us to evaluate the possibility of trend continue or reversal and potential breakout direction.
After all, we care how trading emotion control the price movement and therefore we can take advantage to it.
Reference
How to trade with Falling Three Methods pattern
How to trade with Related Strength Indicator