RSI Supreme Multi-Method [MyTradingCoder]Introducing the "RSI Supreme Multi-Method" indicator, a powerful tool that combines the Relative Strength Index (RSI) with selectable manipulation methods to identify overbought and oversold conditions in the market, along with the ability to detect divergences for enhanced trading insights.
The indicator features four distinct manipulation methods for the RSI, each providing valuable insights into market conditions:
1. Standard RSI Method: The indicator uses the traditional RSI calculation to identify overbought and oversold areas.
2. Volatility Weighted RSI Method: This method applies a volatility formula to the RSI calculation, allowing for a more responsive indication of market conditions during periods of heightened volatility. Users can adjust the length of the volatility formula to fine-tune this method.
3. Smoothed RSI Method: The smoothed RSI method utilizes a smoothing algorithm to reduce noise in the RSI values, presenting a clearer representation of overbought and oversold conditions. The length of the smoothing can be adjusted to match your trading preferences.
4. Session Weighted RSI Method: With this innovative method, users can specify multipliers for different time sessions throughout the day to manipulate the base RSI. Each session can be customized with start and end times, enabling or disabling specific sessions, and specifying the multiplier for each session. This feature allows traders to adapt the RSI to different market sessions dynamically.
Additionally, the "RSI Supreme Multi-Method" indicator draws divergences on the oscillator, providing an extra layer of analysis for traders. Divergences occur when the direction of the RSI differs from the direction of the price movement, potentially signaling trend reversals.
Key Settings:
RSI Length: Adjust the length of the base RSI before applying any manipulation.
RSI Source: Determine the data source for the base RSI calculation.
Overbought Value: Set the RSI value at which overbought conditions are indicated.
Oversold Value: Set the RSI value at which oversold conditions are indicated.
RSI Type: Choose from four options: Standard, Smoothed, Volatility Manipulated, or Session Manipulated.
Volatility Manipulated Settings: Adjust the length of the volatility formula (applicable to Volatility Manipulated method).
Smoothed Settings: Adjust the length of the smoothing (applicable to Smoothed method).
Session Manipulated Settings: Customize six different time sessions with start and end times, enable or disable specific sessions, and specify multipliers for each session.
Divergence Color: Adjust the color of the drawn divergences to suit your chart's aesthetics.
Divergence Tuning: Fine-tune the sensitivity of the divergence detection for more accurate signals.
The "RSI Supreme Multi-Method" indicator is a versatile and comprehensive tool that can be used to identify overbought and oversold areas, as well as to spot potential trend reversals through divergences. However, like all technical analysis tools, it should be used in conjunction with other indicators and analysis methods to make well-informed trading decisions.
Enhance your trading insights with the "RSI Supreme Multi-Method" indicator and gain an edge in identifying critical market conditions and divergences with precision.
Cerca negli script per "Relative"

RSI Momentum TrendThe "RSI Momentum Trend" indicator is a valuable tool for traders seeking to identify momentum trends.
By utilizing the Relative Strength Index (RSI) and customizable momentum thresholds, this indicator helps traders spot potential bullish and bearish signals.
you can adjust input parameters such as the RSI period, positive and negative momentum thresholds, and visual settings to align with their trading strategies.
The indicator calculates the RSI and evaluates two momentum conditions: positive and negative.
The positive condition considers the previous RSI value, current RSI value, and positive change in the 5-period exponential moving average (EMA) of the closing price.
The negative condition looks at the current RSI value and negative change in the 5-period EMA.
Once a momentum condition is met, the indicator visually represents the signal on the chart.
The "RSI Momentum Trend" indicator provides you with a quick and effective way to identify momentum trends using RSI calculations.
By incorporating visual cues and customizable parameters, it assists traders in making informed decisions about potential market movements.

Volume DockThis oscillator has two different modes:
The first one called RSIs is a comparison between the Relative strength index of the Accumulation/Distribution (and the On Balance Volume) and the normal price, to analyze the differences in momentum between the price with volume and without.
The second one, called Dock, is similar except for the fact that the lines are smoothed using the hull moving average formula, this mode is great to signal entries and for reversal analyzing.

RSI and MA with Trailing Stop Loss and Take Profit (by Coinrule)The relative strength index is a momentum indicator used in technical analysis. It measures the speed and magnitude of a coin's recent price changes to evaluate overvalued or undervalued conditions in the price of that coin. The RSI is displayed as an oscillator (a line graph essentially) on a scale of zero to 100. When the RSI reaches oversold levels, it can provide a signal to go long. When the RSI reaches overbought levels, it can mark a good exit point or alternatively, an entry for a short position. Traditionally, an RSI reading of 70 or above indicates an overbought situation. A reading of 30 or below indicates an oversold condition.
A moving average (MA) calculates the average of a selected range of prices, usually closing prices, by the number of periods in that range. Essentially it is used to help smooth out price data by creating a constantly updated average price.
The Strategy enters and closes trades when the following conditions are met:
Entry Conditions:
RSI is greater than 50
MA9 is greater than MA50
RSI increases by 5
Exit Conditions:
Price increases by 1% trailing
Price decreases by 2% trailing
This strategy is back-tested from 1 January 2022 to simulate how the strategy would work in a bear market. The strategy provides good returns.
The strategy assumes each order is using 30% of the available coins to make the results more realistic and to simulate you only ran this strategy on 30% of your holdings. A trading fee of 0.1% is also taken into account and is aligned to the base fee applied on Binance.

Simple RSI and SMA Long and Short (by Coinrule)The relative strength index ( RSI ) is a momentum indicator used in technical analysis . RSI measures the speed and magnitude of a security's recent price changes to evaluate overvalued or undervalued conditions in the price of that security. The RSI is displayed as an oscillator (a line graph) on a scale of zero to 100. The RSI can do more than point to overbought and oversold securities. It can also indicate securities that may be primed for a trend reversal or corrective pullback in price. It can signal when to buy and sell. Traditionally, an RSI reading of 70 or above indicates an overbought situation. A reading of 30 or below indicates an oversold condition.
A simple moving average ( SMA ) calculates the average of a selected range of prices, usually closing prices, by the number of periods in that range.
The Strategy enters and closes the trade when the following conditions are met:
LONG
SMA100 is greater than SMA150
RSI is greater than 50
SHORT
SMA100 is less than SMA150
RSI is less than 50
When a long position is opened, it remains open until the conditions for a short are met at which point the long position is closed and the short position is opened. Then, when the conditions for the long position are met, the short will be closed and a long will be opened.
This strategy is back tested from 1 January 2022 to simulate how the strategy would work in a bear market. The strategy provides good returns.
The strategy assumes each order is using 30% of the available coins to make the results more realistic and to simulate you only ran this strategy on 30% of your holdings. A trading fee of 0.1% is also taken into account and is aligned to the base fee applied on Binance.

Oversold RSI with Tight Stop-Loss Strategy (by Coinrule)KRAKEN:LINKUSD
This is one of the best strategies that can be used to get familiar with technical indicators and start to include them in your rules on Coinrule .
ENTRY
1. This trading system uses the RSI (Relative Strength Index) to anticipate good points to enter positions. RSI is a technical indicator frequently used in trading. It works by measuring the speed and change of price movements to determine whether a coin is oversold (indicating a good entry point) or overbought (indicating a point of exit/entry for a short position). The RSI oscillates between 0 and 100 and is traditionally considered overbought when over 70 and oversold when below 30.
2. To pick the right moment to buy, the strategy enters a trade when the RSI falls below 30 indicating the coin is oversold and primed for a trend reversal.
EXIT
The strategy then exits the position when the price appreciates 7% from the point of entry. The position also maintains a tight stop-loss and closes the position if the price depreciates 1% from the entry price. The idea behind this is to cut your losing trades fast and let your winners ride.
The best time frame for this strategy based on our back testing data is the daily. Shorter time frames can also work well on certain coins, however in our experience, the daily works best. Feel free to experiment with this script and test it on a variety of your coins! With our back testing data a trading fee of 0.1% is taken into account. The fee is aligned to the base fee applied on Binance, which is the largest cryptocurrency exchange by volume. In the example shown, this strategy made a handsome net profit of 52.6% on Chainlink with 66.67% of trades being profitable.
You can execute this strategy on your favorite exchanges with Coinrule .

Volume Pulse Dots Relative Volume at a Glance
Volume Pulse Dots is a lightweight, price-overlay indicator designed to highlight unusual volume activity directly on the chart, without adding clutter or a separate volume pane.
Instead of raw volume bars, this script uses relative volume (rVol) — current volume compared to a moving average of recent volume — to visually flag moments when participation meaningfully deviates from normal.
How It Works
Relative volume is calculated as:
Current volume ÷ Volume moving average (user-defined length)
Based on this ratio, small dots are plotted on the chart:
• High relative volume (green dot below bar)
Signals increased participation compared to recent activity. Often appears during momentum moves, breakouts, or strong continuation candles.
• Very high relative volume (larger cyan dot below bar)
Indicates extreme participation. Common near major breakouts, capitulation candles, or key inflection points.
• Low relative volume (gray dot above bar)
Highlights weak participation. These candles often represent fake moves, fading momentum, or price drifting without conviction.
Dots are intentionally subtle and plotted directly on price to keep context clear while staying out of the way.
How to Use It
This indicator is not a standalone signal generator. It works best when combined with:
• VWAP and EMA structure
• Key support and resistance levels
• Candlestick context (range, wicks, follow-through)
• Price location relative to the open, highs, or prior day levels
Examples:
• High rVol dots near VWAP can confirm real participation
• Very high rVol dots at extended levels may signal exhaustion
• Low rVol dots during breakouts often warn of weak follow-through
Customization
You can adjust:
• Volume moving average length
• Thresholds for high, very high, and low relative volume
• Optional display of the rVol value in the status line (no extra pane)
Design Philosophy
• No separate volume pane
• No alerts or signals
• No repainting
• Minimal visual footprint
This tool is meant to quietly surface information that experienced traders already look for, without distracting from price.

Simple RSI stock Strategy [1D] The "Simple RSI Stock Strategy " is designed to long-term traders. Strategy uses a daily time frame to capitalize on signals generated by the Relative Strength Index (RSI) and the Simple Moving Average (SMA). This strategy is suitable for low-leverage trading environments and focuses on identifying potential buy opportunities when the market is oversold, while incorporating strong risk management with both dynamic and static Stop Loss mechanisms.
This strategy is recommended for use with a relatively small amount of capital and is best applied by diversifying across multiple stocks in a strong uptrend, particularly in the S&P 500 stock market. It is specifically designed for equities, and may not perform well in other markets such as commodities, forex, or cryptocurrencies, where different market dynamics and volatility patterns apply.
Indicators Used in the Strategy:
1. RSI (Relative Strength Index):
- The RSI is a momentum oscillator used to identify overbought and oversold conditions in the market.
- This strategy enters long positions when the RSI drops below the oversold level (default: 30), indicating a potential buying opportunity.
- It focuses on oversold conditions but uses a filter (SMA 200) to ensure trades are only made in the context of an overall uptrend.
2. SMA 200 (Simple Moving Average):
- The 200-period SMA serves as a trend filter, ensuring that trades are only executed when the price is above the SMA, signaling a bullish market.
- This filter helps to avoid entering trades in a downtrend, thereby reducing the risk of holding positions in a declining market.
3. ATR (Average True Range):
- The ATR is used to measure market volatility and is instrumental in setting the Stop Loss.
- By multiplying the ATR value by a custom multiplier (default: 1.5), the strategy dynamically adjusts the Stop Loss level based on market volatility, allowing for flexibility in risk management.
How the Strategy Works:
Entry Signals:
The strategy opens long positions when RSI indicates that the market is oversold (below 30), and the price is above the 200-period SMA. This ensures that the strategy buys into potential market bottoms within the context of a long-term uptrend.
Take Profit Levels:
The strategy defines three distinct Take Profit (TP) levels:
TP 1: A 5% from the entry price.
TP 2: A 10% from the entry price.
TP 3: A 15% from the entry price.
As each TP level is reached, the strategy closes portions of the position to secure profits: 33% of the position is closed at TP 1, 66% at TP 2, and 100% at TP 3.
Visualizing Target Points:
The strategy provides visual feedback by plotting plotshapes at each Take Profit level (TP 1, TP 2, TP 3). This allows traders to easily see the target profit levels on the chart, making it easier to monitor and manage positions as they approach key profit-taking areas.
Stop Loss Mechanism:
The strategy uses a dual Stop Loss system to effectively manage risk:
ATR Trailing Stop: This dynamic Stop Loss adjusts based on the ATR value and trails the price as the position moves in the trader’s favor. If a price reversal occurs and the market begins to trend downward, the trailing stop closes the position, locking in gains or minimizing losses.
Basic Stop Loss: Additionally, a fixed Stop Loss is set at 25%, limiting potential losses. This basic Stop Loss serves as a safeguard, automatically closing the position if the price drops 25% from the entry point. This higher Stop Loss is designed specifically for low-leverage trading, allowing more room for market fluctuations without prematurely closing positions.
to determine the level of stop loss and target point I used a piece of code by RafaelZioni, here is the script from which a piece of code was taken
Together, these mechanisms ensure that the strategy dynamically manages risk while offering robust protection against significant losses in case of sharp market downturns.
The position size has been estimated by me at 75% of the total capital. For optimal capital allocation, a recommended value based on the Kelly Criterion, which is calculated to be 59.13% of the total capital per trade, can also be considered.
Enjoy !

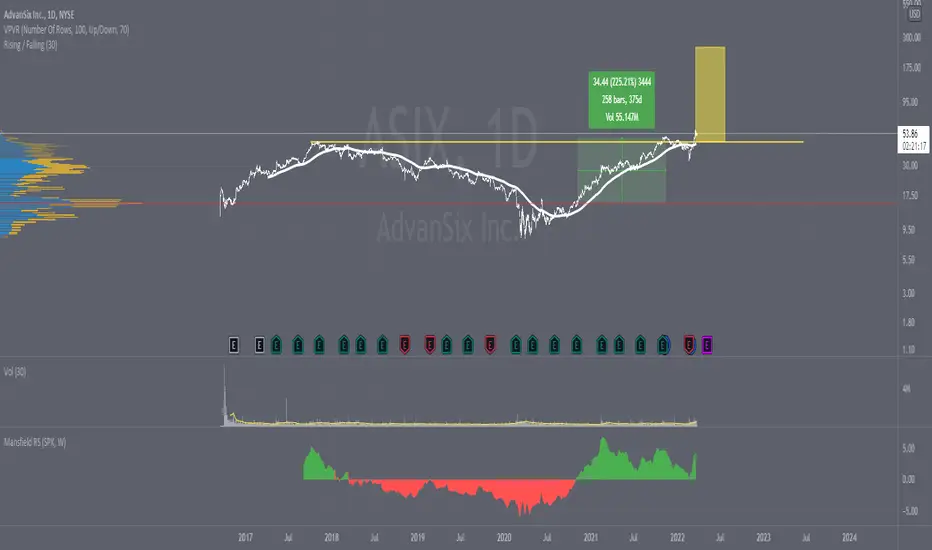
Weis V5 zigzag jayySomehow, I deleted version 5 of the zigzag script. Same name. I have added some older notes describing how the Weis Wave works.
I have also changed the date restriction that stopped the script from working after Dec 31, 2022.
What you see here is the Weis zigzag wave plotted directly on the price chart. This script is the companion to the Weis cumulative wave volume script.
What is a Weis wave? David Weis has been recognized as a Wyckoff method analyst he has written two books one of which, Trades About to Happen, describes the evolution of the now-popular Weis wave. The method employed by Weis is to identify waves of price action and to compare the strength of the waves on characteristics of wave strength. Chief among the characteristics of strength is the cumulative volume of the wave. There are other markers that Weis uses as well for example how the actual price difference between the start of the Weis wave from start to finish. Weis also uses time, particularly when using a Renko chart
David Weis did a futures io video which is a popular source of information about his method. (Search David Weis and futures.io. I strongly suggest you also read “Trades About to Happen” by David Weis.
This will get you up and running more quickly when studying charts. However, you should choose the Traditional method to be true to David Weis technique as described in his book "Trades About to Happen" and in the Futures IO Webcast featuring David Weis
. The Weis pip zigzag wave shows how far in terms of bar close price a Weis wave has traveled through the duration of a Weis wave. The Weis zigzag wave is used in combination with the Weis cumulative volume wave. The two waves should be set to the same "wave size".
To use this script, you must set the wave size: Using the traditional Weis method simply enter the desired wave size in the box "How should wave size be calculated", in this example I am using a traditional wave size of .25. Each wave for each security and each timeframe requires its own wave size. Although not the traditional method devised by David Weis a more automatic way to set wave size would be to use Average True Range (ATR). Using ATR is not the true Weis method but it does give you similar waves and, importantly, without the hassle described above. Once the Weis wave size is set then the zigzag wave will be shown with volume. Because Weis used the closing price of a wave to define waves a line Bar highs and bar lows are not captured by the Weis Wave. The default script setting is now cumulative volume waves using an ATR of 7 and a multiplication factor of .5.
To display volume in a way that does not crowd out neighbouring volumes Weis displayed volume as a maximum of 3 digits (usually). Consider two Weis Wave volumes 176,895,570 and 2,654,763,889. To display wave volume as three digits it is necessary to take a number such as 176,895,570 and truncate it. 176,895,570 can be represented as 177 X 10 to the power of 6. The number displayed must also be relative to other numbers in the field. If the highest volume on the page is: 2,654,763,889 and with only three numbers available to display the result the value shown must be 265 (265 X 10 to the power of 7). Since 176,895,570 is an order of magnitude smaller than 2,654,763,889 therefore 175,895,570 must be shown as 18 instead of 177. In this way, the relative magnitudes of the two volumes can be understood. All numbers in the field of view must be truncated by the same order of magnitude to make the relative volumes understandable. The script attempts to calculate the order of magnitude value automatically. If you see a red number in the field of view it means the script has failed to do the calculation automatically and you should use the manual method – use the dialogue box “Calculate truncated wave value automatically or manually”. Scroll down from the automatic method and select manual. Once "manual" is selected the values displayed become the power values or multipliers for each wave.
Using the manual method you will select a “Multiplier” in the next dialogue box. Scan the field and select the largest value in the field of view (visible chart) is the multiplier of interest. If you select a lower number than the maximum value will see at least one red “up”. If you are too high you will see at least one red “down”. Scroll in the direction recommended or the values on the screen will be totally incorrect. With volume truncated to the highest order values, the eye can quickly get a feel for relative volumes. It also reduces the crowding and overlapping of values on the screen. You can opt to show the full volume to help get a sense of the magnitude of the true volumes.
How does the script determine if a Weis wave is continuing to grow or not?
The script evaluates the closing price of each new bar relative to the "Weis wave size". Suppose the current bar closes at a new low close, within the current down wave, at $30.00. If the Weis wave size is $0.10 then the algorithm will remember the $30.00 close and compare it to the close of the next bar. If the bar close price does not close equal to or lower than $30.00 or close equal to or higher than $30.10 then the wave is still a down wave with a current low of $30.00. This is true even if the bar low is less than $30.00 or the bar high is greater than 30.10 – only the bar’s closing price matters. If a bar's closing price climbs back up to a close of $30.11 then because the closing price has moved more than $0.10 (the Weis wave size) then that is a wave reversal with a new up-trending wave. In the above example if there was currently a downward trending wave and the bar closes were as follows $30.00, $30.09, $30.01, $30.05, $30.10 The wave direction would continue to stay downward trending until the close of $30.10 was achieved. As such $30.00 would be the low and the following closes $30.09, $30.01, $30.05 would be allocated to the new upward-trending wave. If however There was a series of bar closes like this $30.00, $30.09, $30.01, $30.05, $29.99 since none of the closes was equal to above the 10-cent reversal target of $30.10 but instead, a new Weis wave low was achieved ($29.99). As such the closes of $30.09, $30.01, $30.05 would all be attributed to the continued down-trending wave with a current low of $29.99, even though the closing price for the interim bars was above $30.00. Now that the Weis Wave low is now 429.99 then, in order to reverse this continued downtrend price will need to close at or above $30.09 on subsequent bar closes assuming now new low bar close is achieved. With large wave sizes, wave direction can be in limbo for many bars before a close either renews wave direction or reverses it and confirms wave direction as either a reversal or a continuation. On the zig-zag, a wave line and its volume will not be "printed" until a wave reversal is confirmed.
The wave attribution is similar when using other methods to define wave size. If ATR is used for wave size instead of a traditional wave constant size such as $0.10 or $2 or 2000 pips or ... then the wave size is calculated based on current ATR instead of the Weis wave constant (Traditional selected value).
I have the option to display pseudo-Ord volume. In truth, Ord used more traditional zig-zag pivots of bar highs and lows. Waves using closes as pivots can have some significant differences. This difference can be lessened by using smaller time frames and larger wave sizes.
There are other options such to display the delta price or pip size of a Weis Wave, the number of bars in a wave, and a few other options.

Stock versus IndustryStock vs. Industry Indicator
The Stock vs. Industry Indicator is designed to help traders assess the performance of individual stocks relative to their respective industries. This tool automatically identifies the industry classification of a stock, compares it to a relevant industry ETF, and calculates the stock-to-industry performance ratio in real-time.
Key Features:
Real-Time Performance Comparison: The indicator tracks and compares the price movement of an individual stock against the most relevant ETF for its industry, providing a dynamic view of relative strength.
Stock-to-Industry Ratio: Displays the ratio of stock performance versus industry performance, allowing traders to easily identify outperforming and underperforming stocks within their industry.
SMA Trend Line: The indicator includes a simple moving average (SMA) trend line to assist with visual trend analysis, offering additional context to the stock’s movement in relation to the broader industry.
Customizable Parameters: Users can customize SMA periods, adjust comparison overrides, and use color highlighting to suit their trading preferences and strategies.
Industry Classification: Automatically assigns the correct industry classification to any stock, providing a reliable and automated method for comparing stocks within the same industry.
Benefits:
Identify Leaders and Laggards: Easily distinguish which stocks are outperforming their industry and which are underperforming. This allows traders to make more informed decisions based on relative strength.
Sector Rotation Detection: The indicator helps detect when a stock begins to underperform its industry, which can signal a shift in sector strength. This allows traders to adjust their positions and strategies accordingly.
Breakout Confirmation: When a stock breaks out while outperforming its industry, the indicator provides additional confidence in the breakout’s validity and potential for continued performance.
Avoid Value Traps: By comparing a stock’s performance against its industry, the indicator helps avoid investing in stocks that appear undervalued but are underperforming relative to their peers, reducing the risk of falling into value traps.
Usage:
Timeframes: The indicator works across various timeframes and is adaptable for both short-term and long-term traders.
Customization: Users can modify the parameters and settings to align with their specific trading style, whether day trading or position trading.
Visual Aid: The indicator provides an intuitive chart display, making it easy to understand a stock’s performance relative to its industry at a glance.
Disclaimer:
This indicator does not guarantee future performance or predict market movements. The information provided is based on historical data and current market conditions, which can change rapidly. It is important to use this tool as part of a broader trading strategy, taking into account other market factors and risk management techniques.

Mansfield RSHello,
I hope you like this representation of the Mansfield Relative Strength Indicator.
The calculations have been made based on the following formulas:
Standard Relative Performance indicator
RP = ( stock_close / index_close ) * 100
Mansfield Relative Performance indicator
MRP = (( RP (today) / sma ( RP (today), n)) - 1 ) * 100
Where:
RP = Standard Relative Performance indicator (see above)
SMA = Simple moving average over n days.
n = 52 for weekly charts, and n = 200 on daily charts
Thanks,
RVOL - R4RocketRelative volume or RVOL for short is an indicator that is used to measure how 'In Play' the stock is. Simply put, it helps to quantify how interested everybody is in the given stock - higher the value, higher the interest and hence higher is the probability for movement in the stock.
I have tried to create RVOL (Relative Volume ) Indicator as per the description that I read on SMB Capital blog. The blog is a great resource.
...................................................................................................................................................................................
How to use the indicator - The indicator is meant for INTRADAY ONLY.
The indicator has following inputs -
1. RVOL Period - Value from 3 to 14 (Default Value = 4)
This is used to calculate the average volume over the given period of days. e.g. average volume for the last 5 days, last 3 days, last 10 days etc. NOTE - If you use higher RVOL Period on smaller timeframes, the code will give an error. So I recommend using 4 or lower for 5 min timeframe. (Nothing will work on 1 min chart and you can experiment for other timeframes.)
2. RVOL Sectional - True / False (Default Value = False)
If you check this box then you will be able to calculate the RVOL for a particular session (or between particular sessions) in that trading day.
What do I mean by session?
Well I have divided the trading day into 6 (almost) equally spaced sessions in time, i.e. 6 hours and 15 mins (for NSE - India) of trading day is divided into 1 hr - 1st session, 1 hr - 2nd session, 1 hr - 3rd session, 1 hr - 4th session, 1 hr - 5th session, 1 hr and 15 min - 6th session.
Before using 3rd and 4th inputs of indicator, RVOL Sectional box MUST BE CHECKED FIRST.
3. RVOL From Session - 1 to 6 (Default Value = 1)
4. RVOL To Session - 1 to 6 (Default Value = 2)
Now if you select 2 in "RVOL From Session" input and 3 in "RVOL To Session" input, the indicator will calculate RVOL for the 2nd and 3rd hour of the trading day. If you select 3 in both the inputs, then the indicator will give RVOL for the 3rd hour of the trading day.
5. RVOL Trigger - 0.2 to 10 (Default Value = 2)
Filter to find days having RVOL above that value. The indicator turns green (or colour of your choice) when RVOL is more than "RVOL Trigger".
...................................................................................................................................................................................
Hope this indicator will add some value in your trading endeavor.
“Only The Game, Can Teach You The Game” – Jesse Livermore
Yours sincerely,
R4Rocket
**If you have some awesome idea for improvement of the indicator - request you to update the code and share the same.

RS Score (1-100) vs NQ/ES/YM - TP# RS Score (1–100) vs NQ/ES/YM — How to Use & Interpret
## What this indicator is doing
It gives you a **single score from 1 to 100** that tells you whether a stock is acting like a **leader** or a **laggard** compared to the **overall U.S. market** (Nasdaq + S&P + Dow), using about **1 year of data**.
---
## The core idea: “Is this stock beating the market?”
This script compares your stock to a blended benchmark of:
* **Nasdaq futures (NQ)**
* **S&P futures (ES)**
* **Dow futures (YM)**
### Why that matters
A stock can be going up, but if the market is going up faster, the stock is **not a leader**.
This tool answers:
* “Is this stock outperforming the big market?”
* “Is it doing it consistently, or is it just wild and noisy?”
---
## What the 1–100 score means
Think of **50** as the “middle line.”
### The most important rule
* **Above 50 = outperforming the market blend**
* **Below 50 = underperforming**
* **Around 50 = roughly market-like**
### Easy interpretation bands
* **80–100 (Strong Leader):** stock is outperforming the market clearly and consistently
* **60–80 (Healthy):** generally outperforming, decent leadership
* **45–60 (Neutral-ish):** not special, close to market performance
* **30–45 (Weak):** lagging the market
* **1–30 (Very Weak):** strong underperformance
**Think “leaders live above 50,” and “real leaders tend to stay 70+.”**
---
## Why this score is “smarter” than just comparing returns
This script doesn’t just ask *“did it outperform?”*
It also asks *“did it outperform in a clean, steady way?”*
So it penalizes:
* choppy, unstable performance
* “one lucky spike” moves
That’s why it’s great for finding **higher-quality leadership**.
---
## Timeframe consistency: why it works on Daily, Weekly, Monthly
You added **Lock to last completed Daily bar**.
That means:
* it uses the **same daily reference point** no matter what chart timeframe you switch to
* your RS score won’t “walk around” just because the current day/week/month is still forming
**Practical meaning:**
If your score says 72, it should be 72 whether you’re looking at Daily, Weekly, or Monthly (as of the last completed day).
---
## The “RS New High” marker (NH) — what it’s telling you
The marker shows when your RS score hits a **new high** over your chosen lookback period (default ~252 trading days).
### In plain terms:
> “This stock is now showing its strongest relative performance vs the market (in about a year).”
### Why it’s powerful
A lot of the best leaders:
* show RS new highs **before** price breaks out
* or show RS new highs **during** breakouts
**So NH is a “leadership confirmation” signal.**
### How to use NH in real life
* **Best case:** RS hits a new high **while price is near breakout levels**
→ this often means institutions are accumulating and the stock is acting like a leader
* **Okay case:** price makes new highs but RS does not
→ stock is rising, but it’s not leading (could still work, but less attractive)
---
## Divergences: when RS and price disagree
This is one of the most useful ways to use RS.
### Bearish divergence (warning)
**Price makes a higher high, but RS makes a lower high.**
In simple terms:
> “The stock is still going up, but it’s losing leadership versus the market.”
This often shows up before:
* pullbacks
* breakout failures
* trend weakening
* rotation into stronger names
**It’s a caution sign, not an automatic sell.**
### Bullish divergence (early strength)
**Price makes a lower low, but RS makes a higher low.**
In simple terms:
> “The stock is holding up better than the market — strength is building underneath.”
This can happen before:
* reversals
* strong bounce setups
* early leadership emergence
---
## How to use this indicator in a simple trading workflow
### 1) Screening (finding leaders)
When scanning charts:
* Prefer stocks **above 50**
* Strong candidates are typically **70+**
* Bonus points if you see **NH markers** recently
**Quick rule:**
If RS < 50, it’s usually not worth your time unless you’re hunting deep value turnarounds.
---
### 2) Breakouts (confirming quality)
When a stock is near a breakout point:
* You want RS to be **rising**
* Ideally RS is near highs or prints **NH**
If price breaks out but RS is weak:
* it’s more likely to be a “meh breakout”
* sometimes it works, but it’s less “leader-like”
---
### 3) Managing positions (leadership health check)
If you’re already holding:
* RS staying high and rising = healthy leadership
* RS rolling over while price still rises = **possible early warning**
* RS plunging under 50 = the stock is now **lagging the market** (big red flag)
---
## Common “mistakes” and how to avoid them
### Mistake 1: Thinking RS > 50 means “guaranteed winner”
No — it means it’s acting **stronger than the market**, but price action still matters.
Use it with:
* trend structure
* volume/accumulation
* breakout levels
### Mistake 2: Overreacting to one divergence
One divergence is a warning.
You want confirmation like:
* failed breakout
* heavy sell volume
* loss of key moving averages
* repeated RS lower highs
### Mistake 3: Comparing RS values across totally different markets without context
RS works best when:
* comparing stocks within the same broad market environment
* keeping the same benchmark blend and same lookback
---
## Simple cheat sheet
* **RS > 50:** outperforming market (good)
* **RS 70–100:** leader zone
* **NH marker:** strongest relative strength in lookback window (leadership confirmation)
* **Price HH + RS LH:** bearish divergence (leadership weakening)
* **Price LL + RS HL:** bullish divergence (strength building)
Thank you!

Stock vs Custom Symbol OutperformanceStock vs Custom Symbol Outperformance" is a powerful technical analysis indicator designed to help traders and investors gauge the relative performance of a stock against a selected benchmark symbol. This tool enables users to easily visualize how a stock is performing in comparison to another asset, such as an index or another stock.
Key Features:
Custom Symbol Comparison: Input any symbol to compare against the stock of interest, allowing for flexible analysis tailored to specific market conditions.
Outperformance Calculation: The indicator calculates the percentage change in price for both the stock and the selected benchmark, providing a clear view of relative performance.
Moving Average Smoothing: A customizable moving average smooths the outperformance data, helping to identify trends and reduce noise in the signals.
Threshold Lines: Set upper and lower threshold lines to visualize significant levels of outperformance or underperformance, aiding in decision-making.
Dynamic Color Coding: The outperformance bars are color-coded—green indicates that the stock is outperforming the benchmark, while red indicates underperformance.
How to Use:
Select a Benchmark: Use the input field to choose the symbol against which you want to compare the stock.
Adjust Parameters: Modify the moving average length and set your desired thresholds for easier identification of performance metrics.
Interpret Results: Analyze the plot for insights into the stock's performance relative to the benchmark, with the moving average providing additional context for trends.
This indicator is ideal for traders looking to refine their strategies by understanding how individual stocks measure up against key benchmarks in the market.

Ratio Chart with GMMA■About this indicator
This indicator divides the selected stocks by any stocks you specify and plots the result in a new pane.
At the same time, it plots the GMMA against the result of the division.
This allows you to see the relative chart and trend of the selected stock and the arbitrary stock.
Quote Symbol: Specify the denominator of the division. The default is TOPIX. Feel free to change it.
EMA Days: 5 to 30 days are indicated in green, and 75 to 200 days in red. Change the number of days and color freely.
Explanation of Effective Usage
It is recommended to enter an index for stocks specified in the Quote Symbol.
By entering the index, you can check the superiority of the selected issue and the index at a glance.
Example: By dividing AAPL by SP500, you can see on the chart whether AAPL is stronger or weaker relative to SP500.
(Similar concept to the Relative Strength Comparison RSC.)
At the same time, by plotting GMMA, you can confirm the trend of strength or weakness of the selected issue divided by the index. This is useful for swing trading and mid- to long-term trading.
The greater the distance between the short-term and long-term EMAs of the GMMA, the more the selected stocks outperform the index, and when the short-term and long-term EMAs cross, the trend ends and the stock underperforms the index.
■About the Chart
The screen below shows a chart plotted using this indicator.
For comparison with the regular chart, the upper screen shows only the GMMA plotted for the selected stocks.
From the red circle in the lower screen, a trend begins where the selected stocks outperform the index, and the trend ends at the blue circle.
When the trend ends, the selected stocks will underperform the index and it can be determined that it is more efficient to invest in another stock.
■このインジケーターについて
このインジケーターは選択している銘柄を、指定した任意の銘柄で割り算し、その結果を新規ペインにプロットします。
同時に、割り算の結果に対してGMMAをプロットします。
これにより選択した銘柄と、任意の銘柄の相対チャートとトレンドを把握することが出来ます。
Quote Symbol:割り算の分母を指定します。デフォルトはTOPIXです。自由に変更して下さい。
EMA日数:5~30日が緑、75~200日を赤で表記しています。日数と色は自由に変更して下さい。
■有効な使い方の説明
Quote Symbolで指定する銘柄は、指数を入力することを推奨します。
指数を入力することによって、選択した銘柄と指数の優位性を一目で確認出来ます。
例)AAPLをSP500で割ることで、SP500に比べてAAPLが相対的に強いのか、弱いのかをチャートで把握できます。
(相対力比較RSCと似たような考え方です。)
同時にGMMAをプロットすることで、選択した銘柄÷指数の強弱のトレンドを確認できます。これはスイングトレードや中長期トレードに役立ちます。
GMMAの短期EMAと長期EMAの距離が開いていくほど、指数より選択した銘柄がアウトパフォームしていると考えられ、短期EMAと長期EMAが交わるとトレンドは終了し、指数をアンダーパフォームします。
■チャートについて
下の画面がこのインジケーターを使用してプロットしたチャートです。
通常のチャートとの比較のため、上画面には選択した銘柄にGMMAだけをプロットしたものを表示しています。
下の画面の赤い丸から、選択した銘柄が指数をアウトパフォームするトレンドが始まり、青い〇でトレンドは終了します。
トレンドが終了した場合、選択した銘柄は指数をアンダーパフォームするので、別の銘柄に投資する方が効率的と判断できます。

RelativeVolatilityIndicator with Trend FilterGuide to the Relative Volatility Indicator with Trend Filter (RVI_TF)
Introduction
The Relative Volatility Indicator with Trend Filter (RVI_TF) aims to provide traders with a comprehensive tool to analyze market volatility and trend direction. This unique indicator combines volatility ratio calculations with a trend filter to help you make more informed trading decisions.
Key Components
Scaled Volatility Ratio: This measures the current market volatility relative to historical volatility and scales the values for better visualization.
Fast and Slow Moving Averages for Volatility: These provide a smoothed representation of the scaled volatility ratio, making it easier to spot trends in market volatility.
Trend Filter: An additional line representing a long-term Simple Moving Average (SMA) to help you identify the prevailing market trend.
User Inputs
Short and Long ATR Period: These allow you to define the length for calculating the Average True Range (ATR), used in the volatility ratio.
Short and Long StdDev Period: Periods for short-term and long-term standard deviation calculations.
Min and Max Volatility Ratio for Scaling: Scale the volatility ratio between these min and max values.
Fast and Slow SMA Period for Volatility Ratio: Periods for the fast and slow Simple Moving Averages of the scaled volatility ratio.
Trend Filter Period: Period for the long-term SMA, used in the trend filter.
Show Trend Filter: Toggle to show/hide the trend filter line.
Trend Filter Opacity: Adjust the opacity of the trend filter line.
Visual Components
Histogram: The scaled volatility ratio is displayed as a histogram. It changes color based on the ratio value.
Fast and Slow Moving Averages: These are plotted over the histogram for additional context.
Trend Filter Line: Shown when the corresponding toggle is enabled, this line gives an indication of the general market trend.
How to Use
Volatility Analysis: Look for divergences between the fast and slow MAs of the scaled volatility ratio. It can signal potential reversals or continuation of trends.
Trend Confirmation: Use the Trend Filter line to confirm the direction of the current trend.
Conclusion
The RVI_TF is a multi-faceted indicator designed for traders who seek to integrate both volatility and trend analysis into their trading strategies. By providing a clearer understanding of market conditions, this indicator can be a valuable asset in a trader's toolkit.

Volume-Based Candle ShadingThe Volume Shading indicator dynamically adjusts the color brightness of each price bar based on relative volume levels. It helps traders quickly identify whether a candle formed on low, average, or high volume without needing to reference a separate volume pane.
Candles are shaded dynamically as they form, so you can watch volume flow into them in real time. This indicator is designed to be as minimally intrusive as possible, allowing you to visualize volume levels without extra clutter on your charts.
The additional volume indicator in the preview above is there just for a point of reference to allow you to see how the shading on the bars correlates to the volume.
⸻
SETTINGS:
Bullish and bearish base colors — These serve as the midpoint (average volume) for shading.
Brightness mapping direction — Optionally invert the shading so that either high volume appears darker or lighter.
Volume smoothing length — Defines how many bars are averaged to determine what constitutes “normal” volume.
Candles with volume above average will appear darker or lighter depending on user preference, while those with average volume will be painted the chosen colors, giving an intuitive gradient that enhances volume awareness directly on the chart.
⸻
USES:
Confirming price action: Highlight when breakout candles or reversal bars occur with high relative volume, strengthening signal conviction.
Spotting low-volume moves: Identify candles that lack volume support, potentially signaling weak continuation or false breakouts.
Enhancing visual analysis: Overlay volume dynamics directly onto price bars, reducing screen clutter and aiding faster decision-making.
Custom visual workflows: Adapt the visual behavior of candles to your trading style by choosing color direction and base tones.

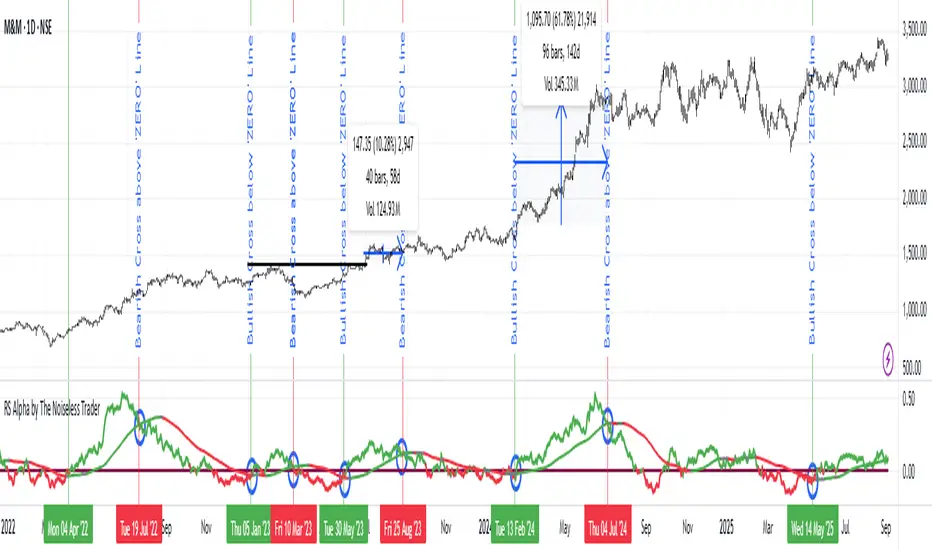
RS Alpha by The Noiseless TraderRS Alpha by The Noiseless Trader plots a clean, benchmark‑relative strength line for any symbol and (optionally) a mean line to assess trend and momentum in relative performance. It’s designed for uncluttered, professional RS analysis and works across any timeframe.
Compare any symbol vs a benchmark (default: NSE:NIFTY).
Optional log‑normalized RS for return‑aware comparisons.
Optional RS Mean with trend coloring (rising/falling).
Optional RS Trend zero‑line coloring based on short‑range slope.
Lightweight alerts for rising/falling RS mean.
Tip: Use RS to identify leaders (RS > 0 with rising mean) and laggards (RS < 0 with falling mean), then align setups with your price action rules.
Reading the indicator
Leadership: RS > 0 and RS Mean rising → outperformance vs benchmark.
Weakness: RS < 0 and RS Mean falling → underperformance vs benchmark.
Inflections: Watch RS crossing above/below its Mean for early shifts.
Zero‑line context: With RS Trend on, the zero line subtly reflects short‑term slope (green for positive, maroon for negative).
Alerts
Rising Strength – RS Mean turning/remaining upward.
Declining Strength – RS Mean turning/remaining downward.
(Use these as context; execute entries on your price‑action rules.)
Best practices
Pair RS with your trend/structure rules (e.g., higher highs + RS leadership).
For sectors/baskets, keep the Comparative Symbol consistent to rank peers.
Log‑normalized RS helps when comparing assets with very different volatilities or large base effects.
Test multiple length and Mean settings; 60 is a balanced default for swing/positional work.
Credits
Original concept & code: © bharatTrader
Modifications & refinements: The Noiseless Trader
Relative Range at Time/ Relative volatility / High−Low This script is designed to help you compare the size of the current price candle (the difference between the highest and lowest prices in a given time period) to the average size of the last several candles. It does this by calculating the average range of a certain number of previous candles (you can set how many with the "Length" input) and then dividing the current candle's range by this average. The result is plotted on the chart as a bar: if the current candle's range is larger than the average, the bar is green; if it's smaller, the bar is red. A horizontal line is also drawn at the value of 1, so you can easily see whether the current candle's range is above or below the average. If there’s an issue with the data, the script will show an error message to let you know.

RSI Bollinger Bands [DCAUT]█ RSI Bollinger Bands
📊 ORIGINALITY & INNOVATION
The RSI Bollinger Bands indicator represents a meaningful advancement in momentum analysis by combining two proven technical tools: the Relative Strength Index (RSI) and Bollinger Bands. This combination addresses a significant limitation in traditional RSI analysis - the use of fixed overbought/oversold thresholds (typically 70/30) that fail to adapt to changing market volatility conditions.
Core Innovation:
Rather than relying on static threshold levels, this indicator applies Bollinger Bands statistical analysis directly to RSI values, creating dynamic zones that automatically adjust based on recent momentum volatility. This approach helps reduce false signals during low volatility periods while remaining sensitive to genuine extremes during high volatility conditions.
Key Enhancements Over Traditional RSI:
Dynamic Thresholds: Overbought/oversold zones adapt to market conditions automatically, eliminating the need for manual threshold adjustments across different instruments and timeframes
Volatility Context: Band width provides immediate visual feedback about momentum volatility, helping traders distinguish between stable trends and erratic movements
Reduced False Signals: During ranging markets, narrower bands filter out minor RSI fluctuations that would trigger traditional fixed-threshold signals
Breakout Preparation: Band squeeze patterns (similar to price-based BB) signal potential momentum regime changes before they occur
Self-Referencing Analysis: By measuring RSI against its own statistical behavior rather than arbitrary levels, the indicator provides more relevant context
📐 MATHEMATICAL FOUNDATION
Two-Stage Calculation Process:
Stage 1: RSI Calculation
RSI = 100 - (100 / (1 + RS))
where RS = Average Gain / Average Loss over specified period
The RSI normalizes price momentum into a bounded 0-100 scale, making it ideal for statistical band analysis.
Stage 2: Bollinger Bands on RSI
Basis = MA(RSI, BB Length)
Upper Band = Basis + (StdDev(RSI, BB Length) × Multiplier)
Lower Band = Basis - (StdDev(RSI, BB Length) × Multiplier)
Band Width = Upper Band - Lower Band
The Bollinger Bands measure RSI's standard deviation from its own moving average, creating statistically-derived dynamic zones.
Statistical Interpretation:
Under normal distribution assumptions with default 2.0 multiplier, approximately 95% of RSI values should fall within the bands
Band touches represent statistically significant momentum extremes relative to recent behavior
Band width expansion indicates increasing momentum volatility (strengthening trend or increasing uncertainty)
Band width contraction signals momentum consolidation and potential regime change preparation
📊 COMPREHENSIVE SIGNAL ANALYSIS
Visual Color Signals:
This indicator features dynamic color fills that highlight extreme momentum conditions:
Green Fill (Above Upper Band):
Appears when RSI breaks above the upper band, indicating exceptionally strong bullish momentum
Represents dynamic overbought zone - not necessarily a reversal signal but a warning of extreme conditions
In strong uptrends, green fills can persist as RSI "rides the band" - this indicates sustained momentum strength
Exit of green zone (RSI falling back below upper band) often signals initial momentum weakening
Red Fill (Below Lower Band):
Appears when RSI breaks below the lower band, indicating exceptionally weak bearish momentum
Represents dynamic oversold zone - potential reversal or continuation signal depending on trend context
In strong downtrends, red fills can persist as RSI "rides the band" - this indicates sustained selling pressure
Exit of red zone (RSI rising back above lower band) often signals initial momentum recovery
Position-Based Signals:
Upper Band Interactions:
RSI Touching Upper Band: Dynamic overbought condition - momentum is extremely strong relative to recent volatility, potential exhaustion or continuation depending on trend context
RSI Riding Upper Band: Sustained strong momentum, often seen in powerful trends, not necessarily an immediate reversal signal but warrants monitoring for exhaustion
RSI Crossing Below Upper Band: Initial momentum weakening signal, particularly significant if accompanied by price divergence
Lower Band Interactions:
RSI Touching Lower Band: Dynamic oversold condition - momentum is extremely weak relative to recent volatility, potential reversal or continuation of downtrend
RSI Riding Lower Band: Sustained weak momentum, common in strong downtrends, monitor for potential exhaustion
RSI Crossing Above Lower Band: Initial momentum strengthening signal, early indication of potential reversal or consolidation
Basis Line Signals:
RSI Above Basis: Bullish momentum regime - upward pressure dominant
RSI Below Basis: Bearish momentum regime - downward pressure dominant
Basis Crossovers: Momentum regime shifts, more significant when accompanied by band width changes
RSI Oscillating Around Basis: Balanced momentum, often indicates ranging market conditions
Volatility-Based Signals:
Band Width Patterns:
Narrow Bands (Squeeze): Momentum volatility compression, often precedes significant directional moves, similar to price coiling patterns
Expanding Bands: Increasing momentum volatility, indicates trend acceleration or growing uncertainty
Narrowest Band in 100 Bars: Extreme compression alert, high probability of upcoming volatility expansion
Advanced Pattern Recognition:
Divergence Analysis:
Bullish Divergence: Price makes lower lows while RSI touches or stays above previous lower band touch, suggests downward momentum weakening
Bearish Divergence: Price makes higher highs while RSI touches or stays below previous upper band touch, suggests upward momentum weakening
Hidden Bullish: Price makes higher lows while RSI makes lower lows at the lower band, indicates strong underlying bullish momentum
Hidden Bearish: Price makes lower highs while RSI makes higher highs at the upper band, indicates strong underlying bearish momentum
Band Walk Patterns:
Upper Band Walk: RSI consistently touching or staying near upper band indicates exceptionally strong trend, wait for clear break below basis before considering reversal
Lower Band Walk: RSI consistently at lower band signals very weak momentum, requires break above basis for reversal confirmation
🎯 STRATEGIC APPLICATIONS
Strategy 1: Mean Reversion Trading
Setup Conditions:
Market Type: Ranging or choppy markets with no clear directional trend
Timeframe: Works best on lower timeframes (5m-1H) or during consolidation phases
Band Characteristic: Normal to narrow band width
Entry Rules:
Long Entry: RSI touches or crosses below lower band, wait for RSI to start rising back toward basis before entry
Short Entry: RSI touches or crosses above upper band, wait for RSI to start falling back toward basis before entry
Confirmation: Use price action confirmation (candlestick reversal patterns) at band touches
Exit Rules:
Target: RSI returns to basis line or opposite band
Stop Loss: Fixed percentage or below recent swing low/high
Time Stop: Exit if position not profitable within expected timeframe
Strategy 2: Trend Continuation Trading
Setup Conditions:
Market Type: Clear trending market with higher highs/lower lows
Timeframe: Medium to higher timeframes (1H-Daily)
Band Characteristic: Expanding or wide bands indicating strong momentum
Entry Rules:
Long Entry in Uptrend: Wait for RSI to pull back to basis line or slightly below, enter when RSI starts rising again
Short Entry in Downtrend: Wait for RSI to rally to basis line or slightly above, enter when RSI starts falling again
Avoid Counter-Trend: Do not fade RSI at bands during strong trends (band walk patterns)
Exit Rules:
Trailing Stop: Move stop to break-even when RSI reaches opposite band
Trend Break: Exit when RSI crosses basis against trend direction with conviction
Band Squeeze: Reduce position size when bands start narrowing significantly
Strategy 3: Breakout Preparation
Setup Conditions:
Market Type: Consolidating market after significant move or at key technical levels
Timeframe: Any timeframe, but longer timeframes provide more reliable breakouts
Band Characteristic: Narrowest band width in recent 100 bars (squeeze alert)
Preparation Phase:
Identify band squeeze condition (bands at multi-period narrowest point)
Monitor price action for consolidation patterns (triangles, rectangles, flags)
Prepare bracket orders for both directions
Wait for band expansion to begin
Entry Execution:
Breakout Confirmation: Enter in direction of RSI band breakout (RSI breaks above upper band or below lower band)
Price Confirmation: Ensure price also breaks corresponding technical level
Volume Confirmation: Look for volume expansion supporting the breakout
Risk Management:
Stop Loss: Place beyond consolidation pattern opposite extreme
Position Sizing: Use smaller size due to false breakout risk
Quick Exit: Exit immediately if RSI returns inside bands within 1-3 bars
Strategy 4: Multi-Timeframe Analysis
Timeframe Selection:
Higher Timeframe: Daily or 4H for trend context
Trading Timeframe: 1H or 15m for entry signals
Confirmation Timeframe: 5m or 1m for precise entry timing
Analysis Process:
Trend Identification: Check higher timeframe RSI position relative to bands, trade only in direction of higher timeframe momentum
Setup Formation: Wait for trading timeframe RSI to show pullback to basis in trending direction
Entry Timing: Use confirmation timeframe RSI band touch or crossover for precise entry
Alignment Confirmation: All timeframes should show RSI moving in same direction for highest probability setups
📋 DETAILED PARAMETER CONFIGURATION
RSI Source:
Close (Default): Standard price point, balances responsiveness and reliability
HL2: Reduces noise from intrabar volatility, provides smoother RSI values
HLC3 or OHLC4: Further smoothing for very choppy markets, slower to respond but more stable
Volume-Weighted: Consider using VWAP or volume-weighted prices for additional liquidity context
RSI Length Parameter:
Shorter Periods (5-10): More responsive but generates more signals, suitable for scalping or very active trading, higher noise level
Standard (14): Default and most widely used setting, proven balance between responsiveness and reliability, recommended starting point
Longer Periods (21-30): Smoother momentum measurement, fewer but potentially more reliable signals, better for swing trading or position trading
Optimization Note: Test across different market regimes, optimal length often varies by instrument volatility characteristics
RSI MA Type Parameter:
RMA (Default): Wilder's original smoothing method, provides traditional RSI behavior with balanced lag, most widely recognized and tested, recommended for standard technical analysis
EMA: Exponential smoothing gives more weight to recent values, faster response to momentum changes, suitable for active trading and trending markets, reduces lag compared to RMA
SMA: Simple average treats all periods equally, smoothest output with highest lag, best for filtering noise in choppy markets, useful for long-term position analysis
WMA: Weighted average emphasizes recent data less aggressively than EMA, middle ground between SMA and EMA characteristics, balanced responsiveness for swing trading
Advanced Options: Full access to 25+ moving average types including HMA (reduced lag), DEMA/TEMA (enhanced responsiveness), KAMA/FRAMA (adaptive behavior), T3 (smoothness), Kalman Filter (optimal estimation)
Selection Guide: RMA for traditional analysis and backtesting consistency, EMA for faster signals in trending markets, SMA for stability in ranging markets, adaptive types (KAMA/FRAMA) for varying volatility regimes
BB Length Parameter:
Short Length (10-15): Tighter bands that react quickly to RSI changes, more frequent band touches, suitable for active trading styles
Standard (20): Balanced approach providing meaningful statistical context without excessive lag
Long Length (30-50): Smoother bands that filter minor RSI fluctuations, captures only significant momentum extremes, fewer but higher quality signals
Relationship to RSI Length: Consider BB Length greater than RSI Length for cleaner signals
BB MA Type Parameter:
SMA (Default): Standard Bollinger Bands calculation using simple moving average for basis line, treats all periods equally, widely recognized and tested approach
EMA: Exponential smoothing for basis line gives more weight to recent RSI values, creates more responsive bands that adapt faster to momentum changes, suitable for trending markets
RMA: Wilder's smoothing provides consistent behavior aligned with traditional RSI when using RMA for both RSI and BB calculations
WMA: Weighted average for basis line balances recent emphasis with historical context, middle ground between SMA and EMA responsiveness
Advanced Options: Full access to 25+ moving average types for basis calculation, including HMA (reduced lag), DEMA/TEMA (enhanced responsiveness), KAMA/FRAMA (adaptive to volatility changes)
Selection Guide: SMA for standard Bollinger Bands behavior and backtesting consistency, EMA for faster band adaptation in dynamic markets, matching RSI MA type creates unified smoothing behavior
BB Multiplier Parameter:
Conservative (1.5-1.8): Tighter bands resulting in more frequent touches, useful in low volatility environments, higher signal frequency but potentially more false signals
Standard (2.0): Default setting representing approximately 95% confidence interval under normal distribution, widely accepted statistical threshold
Aggressive (2.5-3.0): Wider bands capturing only extreme momentum conditions, fewer but potentially more significant signals, reduces false signals in high volatility
Adaptive Approach: Consider adjusting multiplier based on instrument characteristics, lower multiplier for stable instruments, higher for volatile instruments
Parameter Optimization Workflow:
Start with default parameters (RSI:14, BB:20, Mult:2.0)
Test across representative sample period including different market regimes
Adjust RSI length based on desired responsiveness vs stability tradeoff
Tune BB length to match your typical holding period
Modify multiplier to achieve desired signal frequency
Validate on out-of-sample data to avoid overfitting
Document optimal parameters for different instruments and timeframes
Reference Levels Display:
Enabled (Default): Shows traditional 30/50/70 levels for comparison with dynamic bands, helps visualize the adaptive advantage
Disabled: Cleaner chart focusing purely on dynamic zones, reduces visual clutter for experienced users
Educational Value: Keeping reference levels visible helps understand how dynamic bands differ from fixed thresholds across varying market conditions
📈 PERFORMANCE ANALYSIS & COMPETITIVE ADVANTAGES
Comparison with Traditional RSI:
Fixed Threshold RSI Limitations:
In ranging low-volatility markets: RSI rarely reaches 70/30, missing tradable extremes
In trending high-volatility markets: RSI frequently breaks through 70/30, generating excessive false reversal signals
Across different instruments: Same thresholds applied to volatile crypto and stable forex pairs produce inconsistent results
Threshold Adjustment Problem: Manually changing thresholds for different conditions is subjective and lagging
RSI Bollinger Bands Advantages:
Automatic Adaptation: Bands adjust to current volatility regime without manual intervention
Consistent Logic: Same statistical approach works across different instruments and timeframes
Reduced False Signals: Band width filtering helps distinguish meaningful extremes from noise
Additional Information: Band width provides volatility context missing in standard RSI
Objective Extremes: Statistical basis (standard deviations) provides objective extreme definition
Comparison with Price-Based Bollinger Bands:
Price BB Characteristics:
Measures absolute price volatility
Affected by large price gaps and outliers
Band position relative to price not normalized
Difficult to compare across different price scales
RSI BB Advantages:
Normalized Scale: RSI's 0-100 bounds make band interpretation consistent across all instruments
Momentum Focus: Directly measures momentum extremes rather than price extremes
Reduced Gap Impact: RSI calculation smooths price gaps impact on band calculations
Comparable Analysis: Same RSI BB appearance across stocks, forex, crypto enables consistent strategy application
Performance Characteristics:
Signal Quality:
Higher Signal-to-Noise Ratio: Dynamic bands help filter RSI oscillations that don't represent meaningful extremes
Context-Aware Alerts: Band width provides volatility context helping traders adjust position sizing and stop placement
Reduced Whipsaws: During consolidations, narrower bands prevent premature signals from minor RSI movements
Responsiveness:
Adaptive Lag: Band calculation introduces some lag, but this lag is adaptive to current conditions rather than fixed
Faster Than Manual Adjustment: Automatic band adjustment is faster than trader's ability to manually modify thresholds
Balanced Approach: Combines RSI's inherent momentum lag with BB's statistical smoothing for stable yet responsive signals
Versatility:
Multi-Strategy Application: Supports both mean reversion (ranging markets) and trend continuation (trending markets) approaches
Universal Instrument Coverage: Works effectively across equities, forex, commodities, cryptocurrencies without parameter changes
Timeframe Agnostic: Same interpretation applies from 1-minute charts to monthly charts
Limitations and Considerations:
Known Limitations:
Dual Lag Effect: Combines RSI's momentum lag with BB's statistical lag, making it less suitable for very short-term scalping
Requires Volatility History: Needs sufficient bars for BB calculation, less effective immediately after major regime changes
Statistical Assumptions: Assumes RSI values are somewhat normally distributed, extreme trending conditions may violate this
Not a Standalone System: Like all indicators, should be combined with price action analysis and risk management
Optimal Use Cases:
Best for swing trading and position trading timeframes
Most effective in markets with alternating volatility regimes
Ideal for traders who use multiple instruments and timeframes
Suitable for systematic trading approaches requiring consistent logic
Suboptimal Conditions:
Very low timeframes (< 5 minutes) where lag becomes problematic
Instruments with extreme volatility spikes (gap-prone markets)
Markets in strong persistent trends where mean reversion rarely occurs
Periods immediately following major structural changes (new trading regime)
USAGE NOTES
This indicator is designed for technical analysis and educational purposes to help traders understand the interaction between momentum measurement and statistical volatility bands. The RSI Bollinger Bands has limitations and should not be used as the sole basis for trading decisions.
Important Considerations:
No Predictive Guarantee: Past band touches and patterns do not guarantee future price behavior
Market Regime Dependency: Indicator performance varies significantly between trending and ranging market conditions
Complementary Analysis Required: Should be used alongside price action, support/resistance levels, and fundamental analysis
Risk Management Essential: Always use proper position sizing, stop losses, and risk controls regardless of signal quality
Parameter Sensitivity: Different instruments and timeframes may require parameter optimization for optimal results
Continuous Monitoring: Band characteristics change with market conditions, requiring ongoing assessment
Recommended Supporting Analysis:
Price structure analysis (support/resistance, trend lines)
Volume confirmation for breakout signals
Multiple timeframe alignment
Market context awareness (news events, session times)
Correlation analysis with related instruments
The indicator aims to provide adaptive momentum analysis that adjusts to changing market volatility, but traders must apply sound judgment, proper risk management, and comprehensive market analysis in their decision-making process.

RSI Donchian Channel [DCAUT]█ RSI Donchian Channel
📊 ORIGINALITY & INNOVATION
The RSI Donchian Channel represents an important synthesis of two complementary analytical frameworks: momentum oscillators and breakout detection systems. This indicator addresses a common limitation in traditional RSI analysis by replacing fixed overbought/oversold thresholds with adaptive zones derived from historical RSI extremes.
Key Enhancement:
Traditional RSI analysis relies on static threshold levels (typically 30/70), which may not adequately reflect changing market volatility regimes. This indicator adapts the reference zones dynamically based on the actual RSI behavior over the lookback period, helping traders identify meaningful momentum extremes relative to recent price action rather than arbitrary fixed levels.
The implementation combines the proven momentum measurement capabilities of RSI with Donchian Channel's breakout detection methodology, creating a framework that identifies both momentum exhaustion points and potential continuation signals through the same analytical lens.
📐 MATHEMATICAL FOUNDATION
Core Calculation Process:
Step 1: RSI Calculation
The Relative Strength Index measures momentum by comparing the magnitude of recent gains to recent losses:
Calculate price changes between consecutive periods
Separate positive changes (gains) from negative changes (losses)
Apply selected smoothing method (RMA standard, also supports SMA, EMA, WMA) to both gain and loss series
Compute Relative Strength (RS) as the ratio of smoothed gains to smoothed losses
Transform RS into bounded 0-100 scale using the formula: RSI = 100 - (100 / (1 + RS))
Step 2: Donchian Channel Application
The Donchian Channel identifies the highest and lowest RSI values within the specified lookback period:
Upper Channel: Highest RSI value over the lookback period, represents the recent momentum peak
Lower Channel: Lowest RSI value over the lookback period, represents the recent momentum trough
Middle Channel (Basis): Average of upper and lower channels, serves as equilibrium reference
Channel Width Dynamics:
The distance between upper and lower channels reflects RSI volatility. Wide channels indicate high momentum variability, while narrow channels suggest momentum consolidation and potential breakout preparation. The indicator monitors channel width over a 100-period window to identify squeeze conditions that often precede significant momentum shifts.
📊 COMPREHENSIVE SIGNAL ANALYSIS
Primary Signal Categories:
Breakout Signals:
Upper Breakout: RSI crosses above the upper channel, indicates momentum reaching new relative highs and potential trend continuation, particularly significant when accompanied by price confirmation
Lower Breakout: RSI crosses below the lower channel, suggests momentum reaching new relative lows and potential trend exhaustion or reversal setup
Breakout strength is enhanced when the channel is narrow prior to the breakout, indicating a transition from consolidation to directional movement
Mean Reversion Signals:
Upper Touch Without Breakout: RSI reaches the upper channel but fails to break through, may indicate momentum exhaustion and potential reversal opportunity
Lower Touch Without Breakout: RSI reaches the lower channel without breakdown, suggests potential bounce as momentum reaches oversold extremes
Return to Basis: RSI moving back toward the middle channel after touching extremes signals momentum normalization
Trend Strength Assessment:
Sustained Upper Channel Riding: RSI consistently remains near or above the upper channel during strong uptrends, indicates persistent bullish momentum
Sustained Lower Channel Riding: RSI stays near or below the lower channel during strong downtrends, reflects persistent bearish pressure
Basis Line Position: RSI position relative to the middle channel helps identify the prevailing momentum bias
Channel Compression Patterns:
Squeeze Detection: Channel width narrowing to 100-period lows indicates momentum consolidation, often precedes significant directional moves
Expansion Phase: Channel widening after a squeeze confirms the initiation of a new momentum regime
Persistent Narrow Channels: Extended periods of tight channels suggest market indecision and accumulation/distribution phases
🎯 STRATEGIC APPLICATIONS
Trend Continuation Strategy:
This approach focuses on identifying and trading momentum breakouts that confirm established trends:
Identify the prevailing price trend using higher timeframe analysis or trend-following indicators
Wait for RSI to break above the upper channel in uptrends (or below the lower channel in downtrends)
Enter positions in the direction of the breakout when price action confirms the momentum shift
Place protective stops below the recent swing low (long positions) or above swing high (short positions)
Target profit levels based on prior swing extremes or use trailing stops to capture extended moves
Exit when RSI crosses back through the basis line in the opposite direction
Mean Reversion Strategy:
This method capitalizes on momentum extremes and subsequent corrections toward equilibrium:
Monitor for RSI reaching the upper or lower channel boundaries
Look for rejection signals (price reversal patterns, volume divergence) when RSI touches the channels
Enter counter-trend positions when RSI begins moving back toward the basis line
Use the basis line as the initial profit target for mean reversion trades
Implement tight stops beyond the channel extremes to limit risk on failed reversals
Scale out of positions as RSI approaches the basis line and closes the position when RSI crosses the basis
Breakout Preparation Strategy:
This approach positions traders ahead of potential volatility expansion from consolidation phases:
Identify squeeze conditions when channel width reaches 100-period lows
Monitor price action for consolidation patterns (triangles, rectangles, flags) during the squeeze
Prepare conditional orders for breakouts in both directions from the consolidation
Enter positions when RSI breaks out of the narrow channel with expanding width
Use the channel width expansion as a confirmation signal for the breakout's validity
Manage risk with stops just inside the opposite channel boundary
Multi-Timeframe Confluence Strategy:
Combining RSI Donchian Channel analysis across multiple timeframes can improve signal reliability:
Identify the primary trend direction using a higher timeframe RSI Donchian Channel (e.g., daily or weekly)
Use a lower timeframe (e.g., 4-hour or hourly) to time precise entry points
Enter long positions when both timeframes show RSI above their respective basis lines
Enter short positions when both timeframes show RSI below their respective basis lines
Avoid trades when timeframes provide conflicting signals (e.g., higher timeframe below basis, lower timeframe above)
Exit when the higher timeframe RSI crosses its basis line in the opposite direction
Risk Management Guidelines:
Effective risk management is essential for all RSI Donchian Channel strategies:
Position Sizing: Calculate position sizes based on the distance between entry point and stop loss, limiting risk to 1-2% of capital per trade
Stop Loss Placement: For breakout trades, place stops just inside the opposite channel boundary; for mean reversion trades, use stops beyond the channel extremes
Profit Targets: Use the basis line as a minimum target for mean reversion trades; for trend trades, target prior swing extremes or use trailing stops
Channel Width Context: Increase position sizes during narrow channels (lower volatility) and reduce sizes during wide channels (higher volatility)
Correlation Awareness: Monitor correlations between traded instruments to avoid over-concentration in similar setups
📋 DETAILED PARAMETER CONFIGURATION
RSI Source:
Defines the price data series used for RSI calculation:
Close (Default): Standard choice providing end-of-period momentum assessment, suitable for most trading styles and timeframes
High-Low Average (HL2): Reduces the impact of closing auction dynamics, useful for markets with significant end-of-day volatility
High-Low-Close Average (HLC3): Provides a more balanced view incorporating the entire period's range
Open-High-Low-Close Average (OHLC4): Offers the most comprehensive price representation, helpful for identifying overall period sentiment
Strategy Consideration: Use Close for end-of-period signals, HL2 or HLC3 for intraday volatility reduction, OHLC4 for capturing full period dynamics
RSI Length:
Controls the number of periods used for RSI calculation:
Short Periods (5-9): Highly responsive to recent price changes, produces more frequent signals with increased false signal risk, suitable for short-term trading and volatile markets
Standard Period (14): Widely accepted default balancing responsiveness with stability, appropriate for swing trading and intermediate-term analysis
Long Periods (21-28): Produces smoother RSI with fewer signals but more reliable trend identification, better for position trading and reducing noise in choppy markets
Optimization Approach: Test different lengths against historical data for your specific market and timeframe, consider using longer periods in ranging markets and shorter periods in trending markets
RSI MA Type:
Determines the smoothing method applied to price changes in RSI calculation:
RMA (Relative Moving Average - Default): Wilder's original smoothing method providing stable momentum measurement with gradual response to changes, maintains consistency with classical RSI interpretation
SMA (Simple Moving Average): Treats all periods equally, responds more quickly to changes than RMA but may produce more whipsaws in volatile conditions
EMA (Exponential Moving Average): Weights recent periods more heavily, increases responsiveness at the cost of potential noise, suitable for traders prioritizing early signal generation
WMA (Weighted Moving Average): Applies linear weighting favoring recent data, offers a middle ground between SMA and EMA responsiveness
Selection Guidance: Maintain RMA for consistency with traditional RSI analysis, use EMA or WMA for more responsive signals in fast-moving markets, apply SMA for maximum simplicity and transparency
DC Length:
Specifies the lookback period for Donchian Channel calculation on RSI values:
Short Periods (10-14): Creates tight channels that adapt quickly to changing momentum conditions, generates more frequent trading signals but increases sensitivity to short-term RSI fluctuations
Standard Period (20): Balances channel responsiveness with stability, aligns with traditional Bollinger Bands and moving average periods, suitable for most trading styles
Long Periods (30-50): Produces wider, more stable channels that better represent sustained momentum extremes, reduces signal frequency while improving reliability, appropriate for position traders and higher timeframes
Calibration Strategy: Match DC length to your trading timeframe (shorter for day trading, longer for swing trading), test channel width behavior during different market regimes, consider using adaptive periods that adjust to volatility conditions
Market Adaptation: Use shorter DC lengths in trending markets to capture momentum shifts earlier, apply longer periods in ranging markets to filter noise and focus on significant extremes
Parameter Combination Recommendations:
Scalping/Day Trading: RSI Length 5-9, DC Length 10-14, EMA or WMA smoothing for maximum responsiveness
Swing Trading: RSI Length 14, DC Length 20, RMA smoothing for balanced analysis (default configuration)
Position Trading: RSI Length 21-28, DC Length 30-50, RMA or SMA smoothing for stable signals
High Volatility Markets: Longer RSI periods (21+) with standard DC length (20) to reduce noise
Low Volatility Markets: Standard RSI length (14) with shorter DC length (10-14) to capture subtle momentum shifts
📈 PERFORMANCE ANALYSIS & COMPETITIVE ADVANTAGES
Adaptive Threshold Mechanism:
Unlike traditional RSI analysis with fixed 30/70 thresholds, this indicator's Donchian Channel approach provides several improvements:
Context-Aware Extremes: Overbought/oversold levels adjust automatically based on recent momentum behavior rather than arbitrary fixed values
Volatility Adaptation: In low volatility periods, channels narrow to reflect tighter momentum ranges; in high volatility, channels widen appropriately
Market Regime Recognition: The indicator implicitly adapts to different market conditions without manual threshold adjustments
False Signal Reduction: Adaptive channels help reduce premature reversal signals that often occur with fixed thresholds during strong trends
Signal Quality Characteristics:
The indicator's dual-purpose design provides distinct advantages for different trading objectives:
Breakout Trading: Channel boundaries offer clear, objective breakout levels that update dynamically, eliminating the ambiguity of when momentum becomes "too high" or "too low"
Mean Reversion: The basis line provides a natural profit target for reversion trades, representing the midpoint of recent momentum extremes
Trend Strength: Persistent channel boundary riding offers an objective measure of trend strength without additional indicators
Consolidation Detection: Channel width analysis provides early warning of potential volatility expansion from compression phases
Comparative Analysis:
When compared to traditional RSI implementations and other momentum frameworks:
vs. Fixed Threshold RSI: Provides market-adaptive reference levels rather than static values, helping to reduce false signals during trending markets where RSI can remain "overbought" or "oversold" for extended periods
vs. RSI Bollinger Bands: Offers clearer breakout signals and more intuitive extreme identification through actual high/low boundaries rather than statistical standard deviations
vs. Stochastic Oscillator: Maintains RSI's momentum measurement advantages (unbounded calculation avoiding scale compression) while adding the breakout detection capabilities of Donchian Channels
vs. Standard Donchian Channels: Applies breakout methodology to momentum space rather than price, providing earlier signals of potential trend changes before price breakouts occur
Performance Characteristics:
The indicator exhibits specific behavioral patterns across different market conditions:
Trending Markets: Excels at identifying momentum continuation through channel breakouts, RSI tends to ride one channel boundary during strong trends, providing trend confirmation
Ranging Markets: Channel width narrows during consolidation, offering early preparation signals for potential breakout trading opportunities
High Volatility: Channels widen to reflect increased momentum variability, automatically adjusting signal sensitivity to match market conditions
Low Volatility: Channels contract, making the indicator more sensitive to subtle momentum shifts that may be significant in calm market environments
Transition Periods: Channel squeezes often precede major trend changes, offering advance warning of potential regime shifts
Limitations and Considerations:
Users should be aware of certain operational characteristics:
Lookback Dependency: Channel boundaries depend entirely on the lookback period, meaning the indicator has no predictive element beyond identifying current momentum relative to recent history
Lag Characteristics: As with all moving average-based indicators, RSI calculation introduces lag, and channel boundaries update only as new extremes occur within the lookback window
Range-Bound Sensitivity: In extremely tight ranges, channels may become very narrow, potentially generating excessive signals from minor momentum fluctuations
Trending Persistence: During very strong trends, RSI may remain at channel extremes for extended periods, requiring patience for mean reversion setups or commitment to trend-following approaches
No Absolute Levels: Unlike traditional RSI, this indicator provides no fixed reference points (like 50), making it less suitable for strategies that depend on absolute momentum readings
USAGE NOTES
This indicator is designed for technical analysis and educational purposes to help traders understand momentum dynamics and identify potential trading opportunities. The RSI Donchian Channel has limitations and should not be used as the sole basis for trading decisions.
Important considerations:
Performance varies significantly across different market conditions, timeframes, and instruments
Historical signal patterns do not guarantee future results, as market behavior continuously evolves
Effective use requires understanding of both RSI momentum principles and Donchian Channel breakout concepts
Risk management practices (stop losses, position sizing, diversification) are essential for any trading application
Consider combining with additional analytical tools such as volume analysis, price action patterns, or trend indicators for confirmation
Backtest thoroughly on your specific instruments and timeframes before live trading implementation
Be aware that optimization on historical data may lead to curve-fitting and poor forward performance
The indicator performs best when used as part of a comprehensive trading methodology that incorporates multiple forms of market analysis, sound risk management, and realistic expectations about win rates and drawdowns.

RSI Candlestick Oscillator [LuxAlgo]The RSI Candlestick Oscillator displays a traditional Relative Strength Index (RSI) as candlesticks. This indicator references OHLC data to locate each candlestick point relative to the current RSI Value, leading to a more accurate representation of the Open, High, Low, and Close price of each candlestick in the context of RSI.
In addition to the candlestick display, Divergences are detected from the RSI candlestick highs and lows and can be displayed over price on the chart.
🔶 USAGE
Translating candlesticks into the RSI oscillator is not a new concept and has been attempted many times before. This indicator stands out because of the specific method used to determine the candlestick OHLC values. When compared to other RSI Candlestick indicators, you will find that this indicator clearly and definitively correlates better to the on-chart price action.
Traditionally, the RSI indicator is simply one running value based on (typically) the close price of the chart. By introducing high, low, and open values into the oscillator, we can better gauge the specific price action throughout the intrabar movements.
Interactions with the RSI levels can now take multiple forms, whether it be a full-bodied breakthrough or simply a wick test. Both can provide a new analysis of price action alongside RSI.
An example of wick interactions and full-bodied interactions can be seen below.
As a result of the candlestick display, divergences become simpler to spot. Since the candlesticks on the RSI closely resemble the candlesticks on the chart, when looking for divergence between the chart and RSI, it is more obvious when the RSI and price are diverging.
The divergences in this indicator not only show on the RSI oscillator, but also overlay on the price chart for clearer understanding.
🔹 Filtering Divergence
With the candlesticks generating high and low RSI values, we can better sense divergences from price, since these points are generally going to be more dramatic than the (close) RSI value.
This indicator displays each type of divergence:
Bullish Divergence
Bearish Divergence
Hidden Bullish Divergence
Hidden Bearish Divergence
From these, we get many less-than-useful indications, since every single divergence from price is not necessarily of great importance.
The Divergence Filter disregards any divergence detected that does not extend outside the RSI upper or lower values.
This does not replace good judgment, but this filter can be helpful in focusing attention towards the extremes of RSI for potential reversal spotting from divergence.
🔶 DETAILS
In order to get the desired results for a display that resembles price action while following RSI, we must scale. The scaling is the most important part of this indicator.
To summarize the process:
Identify a range on Price and RSI
Consider them as equal to create a scaling factor
Use the scaling factor to locate RSI's "Price equivalent" Upper, Lower, & Mid on the Chart
Use those prices (specifically the RSI Mid) to check how far each OHLC value lies from it
Use those differences to translate the price back to the RSI Oscillator, pinning the OHLC values at their relative location to our anchor (RSI Mid)
🔹 RSI Channel
To better understand, and for your convenience, the indicator includes the option to display the RSI Channel on the chart. This channel helps to visualize where the scaled RSI values are relative to price.
If you analyze the RSI channel, you are likely to notice that the price movement throughout the channel matches the same movement witnessed in the RSI Oscillator below. This makes sense since they are the exact same thing displayed on different scales.
🔹 Scaling the Open
While the scaling method used is important, and provides a very close view of the real price bar's relative locations on the RSI oscillator… It is designed for a single purpose.
The scaling does NOT make the price candles display perfectly on the RSI oscillator.
The largest place where this is noticeable is with the opening of each candle.
For this reason, we have included a setting that modifies the opening of each RSI candle to be more accurate to the chart's price candles.
This setting positions the current bar's opening RSI candlestick value accurately relative to the price's open location to the previous closing price. As seen below.
🔶 SETTINGS
🔹 RSI Candles
RSI Length: Sets the Length for the RSI Oscillator.
Overbought/Oversold Levels: Sets the Overbought and Oversold levels for the RSI Oscillator.
Scale Open for Chart Accuracy: As described above, scales the open of each candlestick bar to more accurately portray the chart candlesticks.
🔹 Divergence
Show on Chart: Choose to display divergence line on the chart as well as on the Oscillator.
Divergence Length: Sets the pivot width for divergence detection. Normal Fractal Pivot Detection is used.
Divergence Style: Change color and line style for Regular and Hidden divergences, as well as toggle their display.
Divergence Filter: As described above, toggle on or off divergence filtering.
🔹 RSI Channel
Toggle: Display RSI Channel on Chart.
Color: Change RSI Channel Color
