Adiyogi Trend🟢🔴 “Adiyogi” Trend — Market Alignment Visualizer
“Adiyogi” Trend is a powerful, non-intrusive trend detection system built for traders who seek clarity, discipline, and alignment with true market flow. Inspired by the meditative stillness of Adiyogi and the need for mindful, high-probability decisions, this tool offers a clean and intuitive visual guide to trending environments — without cluttering the chart or pushing forced trades.
This is not a buy/sell signal generator. Instead, it is designed as a background confirmation engine that helps you stay on the right side of the market by identifying moments of true directional strength.
🧠 Core Logic
The “Adiyogi” Trend indicator highlights the background of your chart in green or red when multiple layers of strength and structure align — including momentum, market positioning, and relative force. Only when these internal components agree does the system activate a directional state.
It’s built on three foundational energies of trend confirmation:
Strength of movement
Structure in price action
Conviction in momentum
By combining these into one visual background, the indicator filters out indecision and helps you stay focused during real trend phases — whether you're day trading, swing trading, or holding longer-term positions.
📌 Core Concepts Behind the Tool
The indicator integrates three essential market filters—each confirming a different dimension of trend strength:
ADX (Average Directional Index) – Measures trend momentum.
You’ve chosen a very responsive setting (ADX Length = 2), which helps catch the earliest possible signs of momentum emergence.
The threshold is ADX ≥ 22, ensuring that weak or sideways markets are filtered out.
SuperTrend (10,1) – Captures short-term trend direction.
This setup follows price closely and reacts quickly to reversals, making it ideal for fast-moving assets or intraday strategies.
SuperTrend acts as the structural confirmation of directional bias.
RSI (Relative Strength Index) – Measures strength based on recent price closes.
You’ve configured RSI > 50 for bullish zones and < 50 for bearish—a neutral midpoint standard often used by professional traders.
This ensures that only trades in sync with momentum and recent strength are highlighted.
🌈 How It Visually Works
Background turns GREEN when:
ADX ≥ 22, indicating strong momentum
Price is above the 20 EMA and above SuperTrend (10,1)
RSI > 50, confirming recent strength
Background turns RED when:
ADX ≥ 22, indicating strong momentum
Price is below the 20 EMA and below SuperTrend (10,1)
RSI < 50, confirming recent weakness
The background remains neutral (transparent) when trend conditions are not clearly aligned—this is the tool's way of keeping you out of indecisive markets.
A label (BULL / BEAR) appears only when the bias flips from the previous one. This helps avoid repeated or redundant alerts, focusing your attention only when something changes.
📊 Practical Uses & Benefits
✅ Stay with the trend: Perfectly filters out choppy or sideways markets by only activating when conditions align across momentum, structure, and strength.
✅ Pre-trade confirmation: Use this tool to confirm trade setups from other indicators or price action patterns.
✅ Avoid noise: Prevent overtrading by focusing only on high-quality trend conditions.
✅ Visual clarity: Unlike arrows or plots that clutter the chart, this tool subtly highlights trend conditions in the background, preserving your price action view.
📍 Important Notes
This is not a buy/sell signal generator. It is a trend-confirmation system.
Use it in conjunction with your existing entry setups—such as breakouts, order blocks, retests, or candlestick patterns.
The tool helps you stay in sync with the dominant direction, especially when combining multiple timeframes.
Can be used on any market (stocks, forex, crypto, indices) and on any timeframe.
Cerca negli script per "Relative"

Multi TF Oscillators Screener [TradingFinder] RSI / ATR / Stoch🔵 Introduction
The oscillator screener is designed to simplify multi-timeframe analysis by allowing traders and analysts to monitor one or multiple symbols across their preferred timeframes—all at the same time. Users can track a single symbol through various timeframes simultaneously or follow multiple symbols in selected intervals. This flexibility makes the tool highly effective for analyzing diverse markets concurrently.
At the core of this screener lie two essential oscillators: RSI (Relative Strength Index) and the Stochastic Oscillator. The RSI measures the speed and magnitude of recent price movements and helps identify overbought or oversold conditions.
It's one of the most reliable indicators for spotting potential reversals. The Stochastic Oscillator, on the other hand, compares the current price to recent highs and lows to detect momentum strength and potential trend shifts. It’s especially effective in identifying divergences and short-term reversal signals.
In addition to these two primary indicators, the screener also displays helpful supplementary data such as the dominant candlestick type (Bullish, Bearish, or Doji), market volatility indicators like ATR and TR, and the four key OHLC prices (Open, High, Low, Close) for each symbol and timeframe. This combination of data gives users a comprehensive technical view and allows for quick, side-by-side comparison of symbols and timeframes.
🔵 How to Use
This tool is built for users who want to view the behavior of a single symbol across several timeframes simultaneously. Instead of jumping between charts, users can quickly grasp the state of a symbol like gold or Bitcoin across the 15-minute, 1-hour, and daily timeframes at a glance. This is particularly useful for traders who rely on multi-timeframe confirmation to strengthen their analysis and decision-making.
The tool also supports simultaneous monitoring of multiple symbols. Users can select and track various assets based on the timeframes that matter most to them. For example, if you’re looking for entry opportunities, the screener allows you to compare setups across several markets side by side—making it easier to choose the most favorable trade. Whether you’re a scalper focused on low timeframes or a swing trader using higher ones, the tool adapts to your workflow.
The screener utilizes the widely-used RSI indicator, which ranges from 0 to 100 and highlights market exhaustion levels. Readings above 70 typically indicate potential pullbacks, while values below 30 may suggest bullish reversals. Viewing RSI across timeframes can reveal meaningful divergences or alignments that improve signal quality.
Another key indicator in the screener is the Stochastic Oscillator, which analyzes the closing price relative to its recent high-low range. When the %K and %D lines converge and cross within the overbought or oversold zones, it often signals a momentum reversal. This oscillator is especially responsive in lower timeframes, making it ideal for spotting quick entries or exits.
Beyond these oscillators, the table includes other valuable data such as candlestick type (bullish, bearish, or doji), volatility measures like ATR and TR, and complete OHLC pricing. This layered approach helps users understand both market momentum and structure at a glance.
Ultimately, this screener allows analysts and traders to gain a full market overview with just one look—empowering faster, more informed, and lower-risk decision-making. It not only saves time but also enhances the precision and clarity of technical analysis.
🔵 Settings
🟣 Display Settings
Table Size : Lets you adjust the table’s visual size with options such as: auto, tiny, small, normal, large, huge.
Table Position : Sets the screen location of the table. Choose from 9 possible positions, combining vertical (top, middle, bottom) and horizontal (left, center, right) alignments.
🟣 Symbol Settings
Each of the 10 symbol slots comes with a full set of customizable parameters :
Enable Symbol : A checkbox to activate or hide each symbol from the table.
Symbol : Define or select the asset (e.g., XAUUSD, BTCUSD, EURUSD, etc.).
Timeframe : Set your desired timeframe for each symbol (e.g., 15, 60, 240, 1D).
RSI Length : Defines the period used in RSI calculation (default is 14).
Stochastic Length : Sets the period for the Stochastic Oscillator.
ATR Length : Sets the length used to calculate the Average True Range, a key volatility metric.
🔵 Conclusion
By combining powerful oscillators like RSI and Stochastic with full customization over symbols and timeframes, this tool provides a fast, flexible solution for technical analysts. Users can instantly monitor one or several assets across multiple timeframes without opening separate charts.
Individual configuration for each symbol, along with the inclusion of key metrics like candlestick type, ATR/TR, and OHLC prices, makes the tool suitable for a wide range of trading styles—from scalping to swing and position trading.
In summary, this screener enables traders to gain a clear, high-level view of various markets in seconds and make quicker, smarter, and lower-risk decisions. It saves time, streamlines analysis, and boosts overall efficiency and confidence in trading strategies.

Kalman Filtered RSI | [DeV]The Kalman Filtered RSI indicator is an advanced tool designed for traders who want precise, noise-free market insights. By enhancing the classic Relative Strength Index (RSI) with a Kalman filter, this indicator delivers a smoother, more reliable view of market momentum, helping you identify trends, reversals, and overbought/oversold conditions with greater accuracy. It’s an ideal choice for traders seeking clear signals amidst market volatility, giving you a competitive edge across any trading environment.
The RSI measures momentum by analyzing price movements over a set period, typically 14 bars. It calculates the average of price gains on up days and the average of price losses on down days, then compares these to produce a value between 0 and 100. An RSI above 70 often indicates an overbought market that may reverse downward, while below 30 suggests an oversold market that could reverse upward. RSI is great for spotting momentum shifts, potential reversals, and trend strength, but it can be noisy in choppy markets, leading to misleading signals.
That's where the Kalman filter comes in; it enhances the RSI by applying a sophisticated smoothing process that predicts the RSI’s next value based on its historical trend, then updates this prediction with the actual RSI reading. It operates in two phases: prediction and correction. In the prediction phase, it uses the previous filtered RSI and adds uncertainty from process noise (Q), which is derived from the historical variance of RSI changes, reflecting how much the RSI might unexpectedly shift. In the correction phase, it calculates a Kalman gain based on the ratio of prediction uncertainty to measurement noise (R), which is determined from the variance between raw RSI and a smoothed version, indicating the raw data’s noisiness. This gain weights how much the filter trusts the new RSI versus the prediction, blending them to produce a smoothed RSI that reduces noise while staying responsive to real trends, outperforming simpler methods like moving averages that often lag or oversmooth.
With the Kalman Filtered RSI, you get a refined view of momentum, making it easier to spot trends and reversals with clarity. This indicator’s ability to dynamically adapt to market changes delivers timely, reliable signals, making it a powerful addition to your trading strategy for any market or timeframe.

RSI with Trend LinesThe RSI with Trend Lines indicator is a tool designed to analyze the behavior of the Relative Strength Index (RSI) combined with dynamic trend lines. This indicator not only provides the standard RSI reading but also identifies pivot points on the RSI and draws bullish and bearish trend lines based on these points. It also includes customizable options for adjusting trend lines, displaying the RSI moving average, and highlighting key levels such as overbought, oversold, and the center line.
This indicator is ideal for finding and identifying clear trends in the RSI and taking advantage of market breakout or consolidation signals. It also includes a table with the POC value, which represents the price level at which the most trading activity has occurred, indicating the highest liquidity and highest trading volume.
Key Features:
1. Basic RSI:
• Calculates the RSI using a configurable period length (default 14).
• Colors the RSI based on its direction (green for rising, red for falling) and its position relative to the center line (50).
2. Key Levels:
• Displays overbought (70 and 80), oversold (20 and 30), and the center line (50) levels for easy visual interpretation.
3. RSI Moving Average:
• Enables and configures an RSI moving average (SMA, EMA, WMA, or ALMA) to smooth out fluctuations and detect clearer trends.
4. Dynamic Trend Lines:
• Identifies pivot points on the RSI and draws bullish and bearish trend lines.
• Trend lines can be extended into the future or limited to the visible range.
• Includes options to display broken lines (trends that are no longer valid) and customize the style (solid or dashed).
5. Pivot Points:
• Displays the high and low pivot points on the chart for a better understanding of trend changes.
6. Advanced Customization:
• Adjust the pivot point period.
• Control the number of pivot points to consider for trend lines.
• Customize the line thickness and style.
How to Use the Indicator:
1. RSI Interpretation:
• Overbought Zone (RSI > 70): Indicates that the asset may be overvalued and could correct downward.
• Oversold Zone (RSI < 30): Suggests that the asset may be undervalued and could rebound.
• Centerline Crossover (50): A cross above 50 indicates bullish strength, while a cross below suggests weakness.
2. Trend Lines:
• Bullish Lines: Drawn when the RSI forms ascending low pivot points. These lines represent dynamic support.
• Bearish Lines: These are drawn when the RSI forms descending high pivot points. These lines represent dynamic resistance.
• Broken Lines: When a trend line becomes invalid (the RSI breaks the line), they are displayed in a dotted style to highlight the breakout.
3. Possible Trading Signals:
• Buy: When the RSI breaks an upward downtrend line.
• Sell: When the RSI breaks a downward uptrend line.
• Trend Confirmation: When the RSI stays within a valid trend line, it suggests that the current trend is strong.
4. A chart with the POC value:
• The point of control is a price level at which the highest trading volume occurs in a given time period. It is a key component of the Volume Profile indicator, which displays volume by price.
• Use of the POC in trading:
• The POC is used to identify areas of high interest and liquidity for trading.
• The POC provides information about the equilibrium point where buyers and sellers are most evenly matched.
• Therefore, it can be considered a zone of interest, meaning it can act as support or resistance.

RSI Classic calculationClassic RSI with Moving Average
This script implements the Classic RSI (Relative Strength Index) method with the option to use either an Exponential Moving Average (EMA) or a Simple Moving Average (SMA) for smoothing the gains and losses. This custom implementation primarily aims to resolve a specific issue I encountered when cross-referencing RSI values with Python-based data, which is calculated differently than in Pine Script. However, the methodology here can benefit anyone who needs to align RSI calculations across different programming languages or platforms.
The Problem:
When working with Python for data analysis, the RSI values are calculated differently. The smoothing method, for example, can vary—RMA (Relative Moving Average) may be used instead of SMA or EMA, resulting in discrepancies when comparing RSI values across systems. To solve this problem, this script allows for the same type of smoothing to be applied (EMA or SMA) as used in Python, ensuring consistency in the data.
Why This Implementation:
The main goal of this approach was to align RSI calculations across Python and Pine Script so that I could cross-check the results accurately. By offering both EMA and SMA options, this script bridges the gap between Pine Script and Python, ensuring that the data is comparable and consistent. While this particular issue arose from my work with Python, this solution is valuable for anyone dealing with cross-platform RSI comparisons in different coding languages or systems.
Benefits:
Cross-Platform Consistency: This script ensures that RSI values calculated in Pine Script are directly comparable to those from Python (or any other platform), which is crucial for accurate analysis, especially in automated trading systems.
Flexibility: The ability to choose between EMA and SMA provides flexibility in line with the specific needs of your strategy or data source.
Ease of Use: The RSI is plotted with overbought and oversold levels clearly marked, making it easy to visualize and use in decision-making processes.
Limitations:
Calculation Differences: While this script bridges the gap between Pine Script and Python, if you're working with a different platform or coding language that uses variations like RMA, small discrepancies may still arise.
Sensitivity Trade-Off: The choice between EMA and SMA impacts the sensitivity of the RSI. EMA responds quicker to recent price changes, which could lead to faster signals, while SMA provides a more stable but slower response.
Conclusion:
This Classic RSI script, with its customizable moving average type (EMA or SMA), not only solves the issue I faced with Python-based calculations but also provides a solution for anyone needing consistency across different programming languages and platforms. Whether you're working with Pine Script, Python, or other languages, this script ensures that your RSI values are aligned for more accurate cross-platform analysis. However, always be mindful of the small differences that can arise when different smoothing techniques (like RMA) are used in other systems.

RSI with Bollinger Bands and Buy/Sell SignalsPurpose:
This indicator combines the Relative Strength Index (RSI) with Bollinger Bands to identify overbought and oversold conditions in the market. It also generates buy and sell signals based on the interaction between the RSI and the Bollinger Bands. It is particularly useful for traders looking for opportunities in volatile or trending markets.
How It Works:
RSI (Relative Strength Index):
The RSI measures the magnitude of recent price changes to evaluate whether an asset is overbought (values > 70) or oversold (values < 30).
In this indicator, horizontal lines at levels 70 (overbought) and 30 (oversold) are used as reference points.
Bollinger Bands:
Bollinger Bands are calculated around a smoothed moving average of the RSI. The upper band represents dynamic overbought levels, while the lower band indicates dynamic oversold levels.
These bands automatically adjust their width based on the volatility of the RSI, allowing them to adapt to different market conditions.
Buy and Sell Signals:
Buy Signal: A buy signal is generated when the RSI exceeds both the upper Bollinger Band and the overbought level (70). This suggests that the asset is in an extreme bullish phase.
Sell Signal: A sell signal is generated when the RSI falls below both the lower Bollinger Band and the oversold level (30). This suggests that the asset is in an extreme bearish phase.
Alerts:
The indicator includes automatic alerts to notify you when buy or sell signals are generated. This allows traders to act quickly on new opportunities.
Best Practices:
Confirmation in Lower Timeframes:
Although this indicator is powerful, it is recommended to confirm signals in lower timeframes before making trading decisions. For example:
If you receive a buy signal on a 4-hour chart, check if the RSI and Bollinger Bands on lower timeframes (such as 1 hour or 15 minutes) also show bullish signals.
This reduces the risk of false positives and increases the accuracy of your entries.
Use in Trends:
This indicator works best in markets with clear trends. In sideways or low-volatility markets, signals may be less reliable due to the lack of directional momentum.
Risk Management:
Always use stop-loss and take-profit to protect your positions. Buy and sell signals are just one tool for analysis; they do not guarantee results.
Combination with Other Indicators:
To improve accuracy, consider combining this indicator with others, such as MACD, Stochastic Oscillator, or Japanese candlestick patterns. This can provide additional confirmation before opening a position.
Summary:
The RSI + Bollinger Bands with Buy/Sell Signals indicator is an advanced tool designed to identify entry and exit points in the market based on extreme overbought and oversold conditions. However, to maximize its effectiveness, it is crucial to confirm signals in lower timeframes and use it in combination with other technical analysis tools. With proper risk management and careful interpretation of signals, this indicator can be a valuable ally in your trading strategy.

RShar Seasonal RSISeasonal RSI
This indicator, Seasonal RSI, is designed to enhance trading decisions by combining the **Relative Strength Index (RSI)** with insights derived from historical **seasonality patterns**. It not only calculates RSI but also overlays seasonality data for the current week of the year, providing traders with a more contextualized view of market conditions.
---
### **Key Features**
#### 1. **Relative Strength Index (RSI) Calculation**
- The script calculates the RSI for a user-defined period (`RSI Length`), which is an oscillator used to measure the speed and magnitude of price changes.
- RSI values are plotted on the chart, helping traders identify **overbought** and **oversold** conditions.
- Thresholds for **Overbought** and **Oversold** levels are customizable, with default values of 70 and 30, respectively.
---
#### 2. **Dynamic RSI Coloring Based on Seasonality**
- The color of the RSI line dynamically adjusts based on historical **win rates** for the current week of the year:
- **Bright Green** for win rates > 65%.
- **Green** for win rates between 50-65%.
- **Red** for win rates between 35-50%.
- **Dark Red** for win rates < 35%.
- This feature gives traders a quick visual cue about whether the historical performance of the current week tends to be bullish, neutral, or bearish.
---
#### 3. **Overbought and Oversold Level Visualization**
- Overbought and oversold levels are displayed as dotted horizontal lines on the RSI chart.
- These levels act as visual guides for potential price reversals:
- **Overbought (default 70)**: Indicates potential selling pressure.
- **Oversold (default 30)**: Indicates potential buying pressure.
---
#### 4. **Seasonality Data Integration**
- Historical **seasonality data** is used to analyze price performance patterns for each week of the year:
- **Win Rate**: The percentage of years in which prices closed higher during the current week.
- **Average Weekly Change**: The average price percentage change during the current week over historical data.
- This data provides additional context to RSI readings, helping traders align their strategies with seasonal tendencies.
---
#### 5. **Information Table Overlay**
- A table is displayed in the **top-right corner** of the chart, summarizing seasonality data for the current week:
- **Week Win Rate**: Displays the percentage of historical years where prices rose during this week.
- **Avg Weekly Change**: Shows the average percentage price change for the current week. Positive values are displayed in green, and negative values are shown in red.
- This overlay provides actionable insights without cluttering the chart.
---
### **How It Works**
1. **Seasonality Data**:
- A function (`getSeasonalityForWeek`) fetches or uses predefined mock seasonality data for each week of the year.
- For each week, it calculates:
- The **Win Rate** (percentage of years with positive performance).
- The **Mean Change** (average price percentage change).
2. **RSI Plot**:
- The RSI line is plotted on the chart.
- The line's color is determined by the win rate for the current week, providing a visual representation of historical performance trends.
3. **Threshold Visualization**:
- Horizontal lines for overbought and oversold levels are drawn to assist in identifying potential reversal points.
4. **Information Table**:
- The table summarizes the current week's seasonality data for quick reference, helping traders make data-driven decisions.
---
### **Use Cases**
- **Short-Term Traders**:
Use the dynamic RSI colors and seasonality table to align short-term trades with historical patterns of weekly performance.
- **Swing Traders**:
Identify whether a stock or market is in an overbought/oversold condition while considering the seasonal tendency for the week.
- **Contextual Decision-Making**:
Combine traditional RSI signals with historical data to reduce false signals and improve timing.
---
### **Limitations**
- The script uses **mock seasonality data** in its default state. To make it fully functional, replace the mock data with actual historical performance metrics for your specific ticker or market.
- The indicator does not fetch real-time external data due to Pine Script’s limitations, so all seasonality data must be manually updated or hardcoded.
---
This indicator provides a powerful way to combine technical analysis with historical trends, offering a unique edge to traders by adding seasonal context to RSI signals.

GocchiMulti-Indicator: RSI & Moving Averages
This versatile TradingView indicator combines two essential tools for technical analysis—Relative Strength Index (RSI) and Moving Averages (MAs)—into one comprehensive solution. It is designed for traders seeking flexibility, customization, and efficiency in their charting experience.
Features:
Relative Strength Index (RSI):
Customizable RSI length.
Adjustable overbought and oversold levels.
Selectable source input (e.g., close, open, high, low).
Visual levels for overbought and oversold zones, aiding in quick trend and momentum identification.
Three Moving Averages:
Three independently customizable moving averages.
Options for Simple Moving Average (SMA) or Exponential Moving Average (EMA) for each line.
Adjustable lengths for short-, medium-, and long-term trend tracking.
Visual Enhancements:
Clear, color-coded plots for RSI and each moving average.
Overbought and oversold zones are highlighted with horizontal dotted lines.
Alerts:
Get notified when RSI crosses above the overbought level or below the oversold level.
Alerts help traders stay on top of potential market reversals or breakout opportunities.
Use Cases:
RSI Analysis: Spot overbought or oversold conditions to identify potential reversals.
Trend Following: Use moving averages to confirm trends or identify crossovers for potential entry and exit points.
Custom Strategies: Tailor the settings to fit specific trading styles, such as scalping, swing trading, or long-term investing.
This all-in-one indicator streamlines your analysis by reducing the need for multiple overlays, making your charts cleaner and more actionable. Whether you're a novice or an experienced trader, this tool provides the flexibility and insights you need to succeed in any market condition.

RSI and Bollinger Bands Screener [deepakks444]Indicator Overview
The indicator is designed to help traders identify potential long signals by combining the Relative Strength Index (RSI) and Bollinger Bands across multiple timeframes. This combination allows traders to leverage the strengths of both indicators to make more informed trading decisions.
Understanding RSI
What is RSI?
The Relative Strength Index (RSI) is a momentum oscillator that measures the speed and change of price movements. Developed by J. Welles Wilder Jr. for stocks and forex trading, the RSI is primarily used to identify overbought or oversold conditions in an asset.
How RSI Works:
Calculation: The RSI is calculated using the average gains and losses over a specified period, typically 14 periods.
Range: The RSI oscillates between 0 and 100.
Interpretation:
Key Features of RSI:
Momentum Indicator: RSI helps identify the momentum of price movements.
Divergences: RSI can show divergences, where the price makes a higher high, but the RSI makes a lower high, indicating potential reversals.
Trend Identification: RSI can also help identify trends. In an uptrend, the RSI tends to stay above 50, and in a downtrend, it tends to stay below 50.
Understanding Bollinger Bands
What is Bollinger Bands?
Bollinger Bands are a type of trading band or envelope plotted two standard deviations (positively and negatively) away from a simple moving average (SMA) of a price. Developed by financial analyst John Bollinger, Bollinger Bands consist of three lines:
Upper Band: SMA + (Standard Deviation × Multiplier)
Middle Band (Basis): SMA
Lower Band: SMA - (Standard Deviation × Multiplier)
How Bollinger Bands Work:
Volatility Measure: Bollinger Bands measure the volatility of the market. When the bands are wide, it indicates high volatility, and when the bands are narrow, it indicates low volatility.
Price Movement: The price tends to revert to the mean (middle band) after touching the upper or lower bands.
Support and Resistance: The upper and lower bands can act as dynamic support and resistance levels.
Key Features of Bollinger Bands:
Volatility Indicator: Bollinger Bands help traders understand the volatility of the market.
Mean Reversion: Prices tend to revert to the mean (middle band) after touching the bands.
Squeeze: A Bollinger Band Squeeze occurs when the bands narrow significantly, indicating low volatility and a potential breakout.
Combining RSI and Bollinger Bands
Strategy Overview:
The strategy aims to identify potential long signals by combining RSI and Bollinger Bands across multiple timeframes. The key conditions are:
RSI Crossing Above 60: The RSI should cross above 60 on the 15-minute timeframe.
RSI Above 60 on Higher Timeframes: The RSI should already be above 60 on the hourly and daily timeframes.
Price Above 20MA or Walking on Upper Bollinger Band: The price should be above the 20-period moving average of the Bollinger Bands or walking on the upper Bollinger Band.
Strategy Details:
RSI Calculation:
Calculate the RSI for the 15-minute, 1-hour, and 1-day timeframes.
Check if the RSI crosses above 60 on the 15-minute timeframe.
Ensure the RSI is above 60 on the 1-hour and 1-day timeframes.
Bollinger Bands Calculation:
Calculate the Bollinger Bands using a 20-period moving average and 2 standard deviations.
Check if the price is above the 20-period moving average or walking on the upper Bollinger Band.
Entry and Exit Signals:
Long Signal: When all the above conditions are met, consider a long entry.
Exit: Exit the trade when the price crosses below the 20-period moving average or the stop-loss is hit.
Example Usage
Setup:
Add the indicator to your TradingView chart.
Configure the inputs as per your requirements.
Monitoring:
Look for the long signal on the chart.
Ensure that the RSI is above 60 on the 15-minute, 1-hour, and 1-day timeframes.
Check that the price is above the 20-period moving average or walking on the upper Bollinger Band.
Trading:
Enter a long position when the criteria are met.
Set a stop-loss below the low of the recent 15-minute candle or based on your risk management rules.
Monitor the trade and exit when the RSI returns below 60 on any of the timeframes or when the price crosses below the 20-period moving average.
House Rules Compliance
No Financial Advice: This strategy is for educational purposes only and should not be construed as financial advice.
Risk Management: Always use proper risk management techniques, including stop-loss orders and position sizing.
Past Performance: Past performance is not indicative of future results. Always conduct your own research and analysis.
TradingView Guidelines: Ensure that any shared scripts or strategies comply with TradingView's terms of service and community guidelines.
Conclusion
This strategy combines RSI and Bollinger Bands across multiple timeframes to identify potential long signals. By ensuring that the RSI is above 60 on higher timeframes and that the price is above the 20-period moving average or walking on the upper Bollinger Band, traders can make more informed decisions. Always remember to conduct thorough research and use proper risk management techniques.

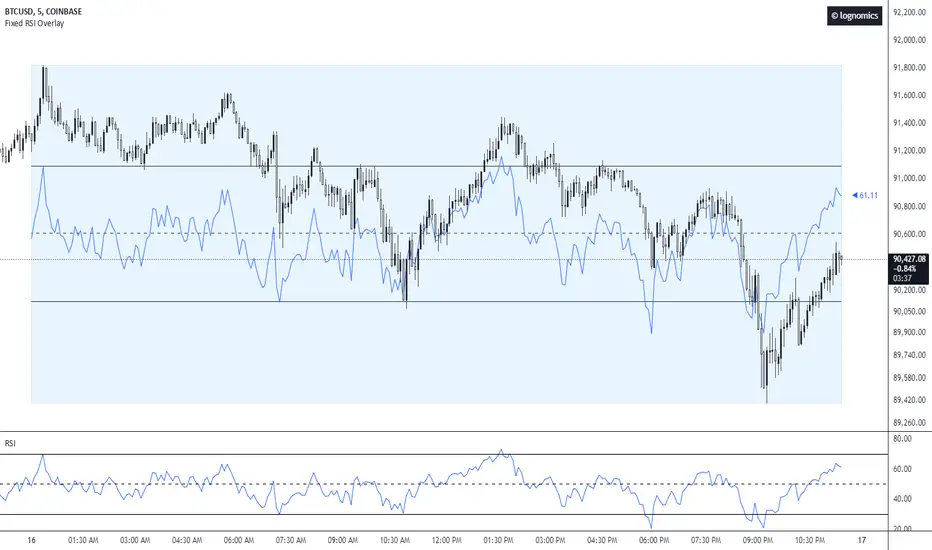
Fixed RSI Overlay [lognomics]This overlay indicator provides a dynamic visualization of the RSI on the instrument price chart. It enhances the standard RSI oscillator by scaling it relative to the anchor's maximum & minimum range, conceptualizing how price reacts at standard oscillation levels.
Starting at the anchor's open, the tool collects all the RSI values from each candle within the range, and stores them inside an array corresponding to each candle index. It then pulls relative values and plots a line connecting each point accordingly to the 0-100 range scale.
While determining each maximum and/or minimum the script will plot a box from the opening time of the anchor, encapsulating the high & low of the range, to end at the next anchor time. To the right to of the box, a label is plotted which is pushed to the current time & current RSI y value within the fixed scale.
Uptrick: Market MoodsThe "Uptrick: Market Moods" indicator is an advanced technical analysis tool designed for the TradingView platform. It combines three powerful indicators—Relative Strength Index (RSI), Average True Range (ATR), and Bollinger Bands—into one cohesive framework, aimed at helping traders better understand and interpret market sentiment. By capturing shifts in the emotional climate of the market, it provides a holistic view of market conditions, which can range from calm to stressed or even highly excited. This multi-dimensional analysis tool stands apart from traditional single-indicator approaches by offering a more complete picture of market dynamics, making it a valuable resource for traders looking to anticipate and react to changes in market behavior.
The RSI in the "Uptrick: Market Moods" indicator is used to measure momentum. RSI is an essential component of many technical analysis strategies, and in this tool, it is used to identify potential market extremes. When RSI values are high, they indicate an overbought condition, meaning the market may be approaching a peak. Conversely, low RSI values suggest an oversold condition, signaling that the market could be nearing a bottom. These extremes provide crucial clues about shifts in market sentiment, helping traders gauge whether the current emotional state of the market is likely to result in a reversal. This understanding is pivotal in predicting whether the market is transitioning from calm to stressed or from excited to overbought.
The Average True Range adds another layer to this analysis by offering insights into market volatility. Volatility is a key factor in understanding the mood of the market, as periods of high volatility often reflect high levels of excitement or stress, while low volatility typically indicates a calm, steady market. ATR is calculated based on the range of price movements over a given period, and the higher the value, the more volatile the market is. The "Uptrick: Market Moods" indicator uses ATR to dynamically gauge volatility levels, helping traders understand whether the market is currently moving in a way that aligns with its emotional mood. For example, an increase in ATR accompanied by an RSI value that indicates overbought conditions could suggest that the market is in a highly excited state, with the potential for either strong momentum continuation or a sharp reversal.
Bollinger Bands complement these tools by providing visual cues about price volatility and the range within which the market is likely to move. Bollinger Bands plot two standard deviations away from a simple moving average of the price. This banding technique helps traders visualize how far the price is likely to deviate from its average over a certain period. The "Uptrick: Market Moods" indicator uses Bollinger Bands to establish price boundaries and identify breakout conditions. When prices break above the upper band or below the lower band, it often signals that the market is either highly stressed or excited. This breakout condition serves as a visual representation of the market mood, alerting traders to moments when prices are moving beyond typical ranges and when significant emotional shifts are occurring in the market.
Technically, the "Uptrick: Market Moods" indicator has been developed using TradingView’s Pine Script language, a highly efficient language for building custom indicators. It employs functions like ta.rsi, ta.atr, and ta.sma to perform the necessary calculations. The use of these built-in functions ensures that the calculations are both accurate and efficient, allowing the indicator to operate in real-time without lagging, even in volatile market conditions. The ta.rsi function is used to compute the Relative Strength Index, while ta.atr calculates the Average True Range, and ta.sma is used to smooth out price data for the Bollinger Bands. These functions are applied dynamically within the script, allowing the "Uptrick: Market Moods" indicator to respond to changes in market conditions in real time.
The user interface of the "Uptrick: Market Moods" indicator is designed to provide a visually intuitive experience. The market mood is color-coded on the chart, making it easy for traders to identify whether the market is calm, stressed, or excited at a glance. This feature is especially useful for traders who need to make quick decisions in fast-moving markets. Additionally, the indicator includes an interactive table that updates in real-time, showing the most recent mood state and its frequency. This provides valuable statistical insights into market behavior over specific time frames, helping traders track the dominant emotional state of the market. Whether the market is in a prolonged calm state or rapidly transitioning through moods, this real-time feedback offers actionable data that can help traders adjust their strategies accordingly.
The RSI component of the "Uptrick: Market Moods" indicator helps detect the speed and direction of price movements, offering insight into whether the market is approaching extreme conditions. By providing signals based on overbought and oversold levels, the RSI helps traders decide whether to enter or exit positions. The ATR element acts as a volatility gauge, dynamically adjusting traders’ expectations in response to changes in market volatility. Meanwhile, the Bollinger Bands help identify trends and potential breakout conditions, serving as an additional confirmation tool that highlights when the price has moved beyond normal boundaries, indicating heightened market excitement or stress.
Despite the robust capabilities of the "Uptrick: Market Moods" indicator, it does have limitations. In markets affected by sudden shifts, such as those driven by major news events or external economic factors, the indicator’s performance may not always be reliable. These external factors can cause rapid mood swings that are difficult for any technical analysis tool to fully anticipate. Additionally, the indicator’s complexity may pose a learning curve for novice traders, particularly those who are unfamiliar with the concepts of RSI, ATR, and Bollinger Bands. However, with practice, traders can become proficient in using the tool to its full potential, leveraging the insights it provides to better navigate market shifts.
For traders seeking a deeper understanding of market sentiment, the "Uptrick: Market Moods" indicator is an invaluable resource. It is recommended for those dealing with medium to high volatility instruments, where understanding emotional shifts can offer a strategic advantage. While it can be used on its own, integrating it with other forms of analysis, such as fundamental analysis and additional technical indicators, can enhance its effectiveness. By confirming signals with other tools, traders can reduce the likelihood of false signals and improve their overall trading strategy.
To further enhance the accuracy of the "Uptrick: Market Moods" indicator, it can be integrated with volume-based tools like Volume Profile or On-Balance Volume (OBV). This combination allows traders to confirm the moods identified by the indicator with volume data, providing additional confirmation of market sentiment. For example, when the market is in an excited mood, an increase in trading volume could reinforce the reliability of that signal. Conversely, if the market is stressed but volume remains low, traders may want to proceed with caution. Using multiple indicators together creates a more comprehensive trading approach, helping traders better manage risk and make informed decisions based on multiple data points.
In conclusion, the "Uptrick: Market Moods" indicator is a powerful and unique addition to the suite of technical analysis tools available on TradingView. It provides traders with a multi-dimensional view of market sentiment by combining the analytical strengths of RSI, ATR, and Bollinger Bands into a single tool. Its ability to capture and interpret the emotional mood of the market makes it an essential tool for traders seeking to gain an edge in understanding market behavior. While the indicator has certain limitations, particularly in rapidly shifting markets, its ability to provide real-time insights into market sentiment is a valuable asset for traders of all experience levels. Used in conjunction with other tools and sound trading practices, the "Uptrick: Market Moods" indicator offers a comprehensive solution for navigating the complexities of financial markets.

RSI Standard Deviation | viResearchRSI Standard Deviation | viResearch
The "RSI Standard Deviation" indicator, developed by viResearch, introduces a new approach to combining the Relative Strength Index (RSI) with a standard deviation measure to offer a more dynamic view of market momentum. By applying standard deviation to the RSI values, this indicator refines the traditional RSI, providing a more precise and adaptive way to measure overbought and oversold conditions. This unique combination allows traders to better understand the underlying volatility in RSI movements, leading to more informed decisions in trending and ranging markets.
Technical Composition and Calculation:
The core of the "RSI Standard Deviation" lies in calculating the RSI based on user-defined input parameters and then applying standard deviation to these RSI values. This method enhances the sensitivity of the RSI, making it more responsive to market volatility.
RSI Calculation:
RSI Length (len): The script computes the Relative Strength Index over a customizable length (default: 21), offering a traditional measure of momentum in the market. The RSI tracks the speed and change of price movements, oscillating between 0 and 100 to indicate overbought and oversold conditions.
Standard Deviation Applied to RSI:
Standard Deviation Length (sdlen): The script calculates the standard deviation of the RSI values over a user-defined period (default: 35). This standard deviation represents the volatility in RSI movements, adding a new layer of analysis to traditional RSI.
Upper (u) and Lower (d) Bands:
The standard deviation values are used to create upper and lower bands around the RSI, offering an adaptive range that expands or contracts based on market volatility. This helps traders identify moments when the market is more likely to reverse or continue its trend.
Trend Identification:
Uptrend (L): The script identifies an uptrend when the RSI moves above the lower band and stays above the midline (50). This indicates that the market is gaining upward momentum, potentially signaling a long position.
Downtrend (S): A downtrend is identified when the RSI moves below 50, suggesting a weakening market and a potential short position.
Features and User Inputs:
The "RSI Standard Deviation" script offers various customization options, enabling traders to tailor it to their specific needs and strategies:
RSI Length: Traders can adjust the length of the RSI calculation to control how quickly the indicator responds to price movements.
Standard Deviation Length: Adjusting the standard deviation length allows users to control the sensitivity of the upper and lower bands, fine-tuning the indicator’s responsiveness to market volatility.
Source Input: The script can be applied to different price sources, offering flexibility in how it calculates RSI and standard deviation values.
Practical Applications:
The "RSI Standard Deviation" indicator is particularly useful in volatile markets, where traditional RSI may produce false signals due to rapid price movements. By adding a standard deviation measure, traders can filter out noise and better identify trends.
Key Uses:
Trend Following: The standard deviation bands provide a clearer view of momentum shifts in the RSI, allowing traders to follow the trend more confidently.
Volatility Assessment: The indicator dynamically adjusts to market volatility, making it easier to assess when the market is overbought or oversold and when a trend reversal is likely.
Signal Confirmation: By comparing the RSI to the adaptive standard deviation bands, traders can confirm signals and avoid false entries during periods of high volatility.
Advantages and Strategic Value:
The "RSI Standard Deviation" offers several advantages:
Enhanced Precision: The combination of RSI and standard deviation results in a more refined momentum indicator that adapts to market conditions.
Noise Reduction: The standard deviation bands help filter out short-term market noise, making it easier to identify significant trend changes.
Dynamic Volatility Awareness: By using standard deviation, the indicator adjusts its bands based on real-time volatility, providing more accurate overbought and oversold signals.
Summary and Usage Tips:
The "RSI Standard Deviation" is a powerful tool for traders looking to enhance their RSI analysis with volatility measures. For optimal performance, traders should experiment with different RSI and standard deviation lengths to suit their trading timeframe and strategy. Whether used to follow trends or confirm momentum signals, the "RSI Standard Deviation" provides a reliable and adaptive solution for modern trading environments.

Uptrick: Dynamic AMA RSI Indicator### **Uptrick: Dynamic AMA RSI Indicator**
**Overview:**
The **Uptrick: Dynamic AMA RSI Indicator** is an advanced technical analysis tool designed for traders who seek to optimize their trading strategies by combining adaptive moving averages with the Relative Strength Index (RSI). This indicator dynamically adjusts to market conditions, offering a nuanced approach to trend detection and momentum analysis. By leveraging the Adaptive Moving Average (AMA) and Fast Adaptive Moving Average (FAMA), along with RSI-based overbought and oversold signals, traders can better identify entry and exit points with higher precision and reduced noise.
**Key Components:**
1. **Source Input:**
- The source input is the price data that forms the basis of all calculations. Typically set to the closing price, traders can customize this to other price metrics such as open, high, low, or even the output of another indicator. This flexibility allows the **Uptrick** indicator to be tailored to a wide range of trading strategies.
2. **Adaptive Moving Average (AMA):**
- The AMA is a moving average that adapts its sensitivity based on the dominant market cycle. This adaptation allows the AMA to respond swiftly to significant price movements while smoothing out minor fluctuations, making it particularly effective in trending markets. The AMA adjusts its responsiveness dynamically using a calculated phase adjustment from the dominant cycle, ensuring it remains responsive to the current market environment without being overly reactive to market noise.
3. **Fast Adaptive Moving Average (FAMA):**
- The FAMA is a more sensitive version of the AMA, designed to react faster to price changes. It serves as a signal line in the crossover strategy, highlighting shorter-term trends. The interaction between the AMA and FAMA forms the core of the signal generation, with crossovers between these lines indicating potential buy or sell opportunities.
4. **Relative Strength Index (RSI):**
- The RSI is a momentum oscillator that measures the speed and change of price movements, providing insights into whether an asset is overbought or oversold. In the **Uptrick** indicator, the RSI is used to confirm the validity of crossover signals between the AMA and FAMA, adding an additional layer of reliability to the trading signals.
**Indicator Logic:**
1. **Dominant Cycle Calculation:**
- The indicator starts by calculating the dominant market cycle using a smoothed price series. This involves applying exponential moving averages to a series of price differences, extracting cycle components, and determining the instantaneous phase of the cycle. This phase is then adjusted to provide a phase adjustment factor, which plays a critical role in determining the adaptive alpha.
2. **Adaptive Alpha Calculation:**
- The adaptive alpha, a key feature of the AMA, is computed based on the fast and slow limits set by the trader. This alpha is clamped within these limits to ensure the AMA remains appropriately sensitive to market conditions. The dynamic adjustment of alpha allows the AMA to be highly responsive in volatile markets and more conservative in stable markets.
3. **Crossover Detection:**
- The indicator generates trading signals based on crossovers between the AMA and FAMA:
- **CrossUp:** When the AMA crosses above the FAMA, it indicates a potential bullish trend, suggesting a buy opportunity.
- **CrossDown:** When the AMA crosses below the FAMA, it signals a potential bearish trend, indicating a sell opportunity.
4. **RSI Confirmation:**
- To enhance the reliability of these crossover signals, the indicator uses the RSI to confirm overbought and oversold conditions:
- **Buy Signal:** A buy signal is generated only when the AMA crosses above the FAMA and the RSI confirms an oversold condition, ensuring that the signal aligns with a momentum reversal from a low point.
- **Sell Signal:** A sell signal is triggered when the AMA crosses below the FAMA and the RSI confirms an overbought condition, indicating a momentum reversal from a high point.
5. **Signal Management:**
- To prevent signal redundancy during strong trends, the indicator tracks the last generated signal (buy or sell) and ensures that the next signal is only issued when there is a genuine reversal in trend direction.
6. **Signal Visualization:**
- **Buy Signals:** The indicator plots a "BUY" label below the bar when a buy signal is generated, using a green color to clearly mark the entry point.
- **Sell Signals:** A "SELL" label is plotted above the bar when a sell signal is detected, marked in red to indicate an exit or shorting opportunity.
- **Bar Coloring (Optional):** Traders have the option to enable bar coloring, where green bars indicate a bullish trend (AMA above FAMA) and red bars indicate a bearish trend (AMA below FAMA), providing a visual representation of the market’s direction.
**Customization Options:**
- **Source:** Traders can select the price data input that best suits their strategy (e.g., close, open, high, low, or custom indicators).
- **Fast Limit:** Adjustable sensitivity for the fast response of the AMA, allowing traders to tailor the indicator to different market conditions.
- **Slow Limit:** Sets the slower boundary for the AMA’s sensitivity, providing stability in less volatile markets.
- **RSI Length:** The period for the RSI calculation can be adjusted to fit different trading timeframes.
- **Overbought/Oversold Levels:** These thresholds can be customized to define the RSI levels that trigger buy or sell confirmations.
- **Enable Bar Colors:** Traders can choose whether to enable bar coloring based on the AMA/FAMA relationship, enhancing visual clarity.
**How Different Traders Can Use the Indicator:**
1. **Day Traders:**
- **Uptrick: Dynamic AMA RSI Indicator** is highly effective for day traders who need to make quick decisions in fast-moving markets. The adaptive nature of the AMA and FAMA allows the indicator to respond rapidly to intraday price swings. Day traders can use the buy and sell signals generated by the crossover and RSI confirmation to time their entries and exits with greater precision, minimizing exposure to false signals often prevalent in high-frequency trading environments.
2. **Swing Traders:**
- Swing traders can benefit from the indicator’s ability to identify and confirm trend reversals over several days or weeks. By adjusting the RSI length and sensitivity limits, swing traders can fine-tune the indicator to catch longer-term price movements, helping them to ride trends and maximize profits over medium-term trades. The dual confirmation of crossovers with RSI ensures that swing traders enter trades that have a higher probability of success.
3. **Position Traders:**
- For position traders who hold trades over longer periods, the **Uptrick** indicator offers a reliable method to stay in trades that align with the dominant trend while avoiding premature exits. By adjusting the slow limit and extending the RSI length, position traders can smooth out the indicator’s sensitivity, allowing them to focus on major market shifts rather than short-term volatility. The bar coloring feature also provides a clear visual indication of the overall trend, aiding in trade management decisions.
4. **Scalpers:**
- Scalpers, who seek to profit from small price movements, can use the fast responsiveness of the FAMA in conjunction with the RSI to identify micro-trends within larger market moves. The indicator’s ability to adapt quickly to changing conditions makes it a valuable tool for scalpers looking to execute numerous trades in a short period, capturing profits from minor price fluctuations while avoiding prolonged exposure.
5. **Algorithmic Traders:**
- Algorithmic traders can incorporate the **Uptrick** indicator into automated trading systems. The precise crossover signals combined with RSI confirmation provide clear and actionable rules that can be coded into algorithms. The adaptive nature of the indicator ensures that it can be used across different market conditions and timeframes, making it a versatile component of algorithmic strategies.
**Usage:**
The **Uptrick: Dynamic AMA RSI Indicator** is a versatile tool that can be integrated into various trading strategies, from short-term day trading to long-term investing. Its ability to adapt to changing market conditions and provide clear buy and sell signals makes it an invaluable asset for traders seeking to improve their trading performance. Whether used as a standalone indicator or in conjunction with other technical tools, **Uptrick** offers a dynamic approach to market analysis, helping traders to navigate the complexities of financial markets with greater confidence.
**Conclusion:**
The **Uptrick: Dynamic AMA RSI Indicator** offers a comprehensive and adaptable solution for traders across different styles and timeframes. By combining the strengths of adaptive moving averages with RSI confirmation, it delivers robust signals that help traders capitalize on market trends while minimizing the risk of false signals. This indicator is a powerful addition to any trader’s toolkit, enabling them to make informed decisions with greater precision and confidence. Whether you're a day trader, swing trader, or long-term investor, the **Uptrick** indicator can enhance your trading strategy and improve your market outcomes.

RSI Trail [UAlgo]The RSI Trail indicator is a technical analysis tool designed to assist traders in making informed decisions by utilizing the Relative Strength Index (RSI) and various moving average calculations. This indicator dynamically plots support and resistance levels based on RSI values, providing visual cues for potential bullish and bearish signals. The inclusion of a trailing stop mechanism allows traders to adapt to market volatility, ensuring optimal entry and exit points.
🔶 Key Features
Multiple Moving Average Types: Choose from Simple Moving Average (SMA), Exponential Moving Average (EMA), Weighted Moving Average (WMA), Running Moving Average (RMA), and McGinley Dynamic for diverse analytical approaches.
Configurable RSI Bounds: Tailor the RSI lower and upper bounds to your specific trading preferences, with default settings at 40 and 60.
Signals: The indicator determines bullish and bearish market states and plots corresponding signals on the chart.
Customizable Visualization: Options to display the midline and color candles based on market state enhance visual analysis.
Alerts: Integrated alert conditions notify you of bullish and bearish signals.
🔶 Calculations
The RSI Trail indicator calculates dynamic support and resistance levels using a combination of moving averages and the Relative Strength Index (RSI). It starts by computing a chosen moving average (SMA, EMA, WMA, RMA, or McGinley) over a period of 27 using the typical price (ohlc4).
The indicator then defines upper and lower bounds based on customizable RSI levels (default 40 and 60) and adjusts these bounds using the Average True Range (ATR) to account for market volatility. The upper bound is calculated by adding a volatility-adjusted value to the moving average, while the lower bound is found by subtracting this value. Bullish signals occur when the price crosses above the upper bound, and bearish signals when it falls below the lower bound.
The RSI Trail indicator also can be used to identify pullback opportunities. When the price high/low crosses above/below the calculated upper/lower bound, it indicates a potential pullback, suggesting a favorable point to enter a trade during a pullback.
🔶 Disclaimer
This indicator is for informational purposes only and should not be considered financial advice.
Always conduct your own research and due diligence before making any trading decisions. Past performance is not necessarily indicative of future results.

Dual RSI Differential - Strategy [presentTrading]█ Introduction and How it is Different
The Dual RSI Differential Strategy introduces a nuanced approach to market analysis and trading decisions by utilizing two Relative Strength Index (RSI) indicators calculated over different time periods. Unlike traditional strategies that employ a single RSI and may signal premature or delayed entries, this method leverages the differential between a shorter and a longer RSI. This approach pinpoints more precise entry and exit points, providing a refined tool for traders to exploit market conditions effectively, particularly in overbought and oversold scenarios.
Most important: it is a good eductional code for swing trading.
For beginners, this Pine Script provides a complete function that includes crucial elements such as holding days and the option to configure take profit/stop loss settings:
- Hold Days: This feature ensures that trades are not exited too hastily, helping traders to ride out short-term market volatility. It's particularly valuable for swing trading where maintaining positions slightly longer can lead to capturing significant trends.
- TPSL Condition (None by default): This setting allows traders to focus solely on the strategy's robust entry and exit signals without being constrained by preset profit or loss limits. This flexibility is crucial for learning to adjust strategy settings based on personal risk tolerance and market observations.
BTCUSD 6h LS Performance
█ Strategy, How It Works: Detailed Explanation
🔶 RSI Calculation:
The RSI is a momentum oscillator that measures the speed and change of price movements. It is calculated using the formula:
RSI = 100 - (100 / (1 + RS))
Where RS (Relative Strength) = Average Gain of up periods / Average Loss of down periods.
🔶 Dual RSI Setup:
This strategy involves two RSI indicators:
RSI_Short (RSI_21): Calculated over a short period (21 days).
RSI_Long (RSI_42): Calculated over a longer period (42 days).
Differential Calculation:
The strategy focuses on the differential between these two RSIs:
RSI Differential = RSI_Long - RSI_Short
This differential helps to identify when the shorter-term sentiment diverges from longer-term trends, signaling potential trading opportunities.
BTCUSD Local picuture
🔶 Signal Triggers:
Entry Signal: A buy (long) signal is triggered when the RSI Differential exceeds -5, suggesting strengthening short-term momentum. Conversely, a sell (short) signal occurs when the RSI Differential falls below +5, indicating weakening short-term momentum.
Exit Signal: Trades are generally exited when the RSI Differential reverses past these thresholds, indicating a potential momentum shift.
█ Trade Direction
This strategy accommodates various trading preferences by allowing selections among long, short, or both directions, thus enabling traders to capitalize on diverse market movements and volatility.
█ Usage
The Dual RSI Differential Strategy is particularly suited for:
Traders who prefer a systematic approach to capture market trends.
Those who seek to minimize risks associated with rapid and unexpected market movements.
Traders who value strategies that can be finely tuned to different market conditions.
█ Default Settings
- Trading Direction: Both — allows capturing of upward and downward market movements.
- Short RSI Period: 21 days — balances sensitivity to market movements.
- Long RSI Period: 42 days — smoothens out longer-term fluctuations to provide a clearer market trend.
- RSI Difference Level: 5 — minimizes false signals by setting a moderate threshold for action.
Use Hold Days: True — introduces a temporal element to trading strategy, holding positions to potentially enhance outcomes.
- Hold Days: 5 — ensures that trades are not exited too hastily, helping to ride out short-term volatility.
- TPSL Condition: None — enables traders to focus solely on the strategy's entry and exit signals without preset profit or loss limits.
- Take Profit Percentage: 15% — aims for significant market moves to lock in profits.
- Stop Loss Percentage: 10% — safeguards against large losses, essential for long-term capital preservation.

RSI Confirm Trend with Williams (W%R)RSI Confirm Trend with Williams (W%R)
This is the "RSI Confirm Trend with Williams (W%R)" indicator
This is a modification of the "RSI Trends" indicator by zzzcrypto123.
What Is the Relative Strength Index (RSI)?
The relative strength index (RSI) is a momentum indicator used in technical analysis. RSI measures the speed and magnitude of a security's recent price changes to evaluate overvalued or undervalued conditions in the price of that security.
What is Williams %R?
Williams %R, also known as the Williams Percent Range, is a type of momentum indicator that moves between 0 and -100 and measures overbought and oversold levels. The Williams %R may be used to find entry and exit points in the market. The indicator is very similar to the Stochastic oscillator and is used in the same way. It was developed by Larry Williams and it compares a stock’s closing price to the high-low range over a specific period, typically 14 days or periods.
How Does "RSI Confirm Trend with Williams (W%R)" work?
This indicator combines the momentum of both RSI and Williams %R by adding upper and lower thresholds. When the thresholds are broken, this indicator changes color from gray to either green or red.
What Are The Thresholds?
The default RSI thresholds are 55 and 45. These values are configurable.
The default Williams %R thresholds are 80 and 20. These values are configurable and made positive so it can be plotted against the RSI line.
How To Use?
When the RSI exceeded the upper/lower thresholds, the RSI line color will change from gray to lighter green/red color.
When the Williams %R exceeded the upper/lower thresholds, the RSI color will change to darker green/red color signifying a strong momentum in that direction.
When the RSI color is gray, this means the RSI and Williams %R thresholds are not broken which can also signify as no trend or consolidation.
The Williams %R line is not displayed by default but can be enabled using the checkbox provided in the Style tab.
This "RSI Confirm Trend with Williams (W%R)" indicator can be combined with other technical indicators to verify the idea behind this theory.
-----------------
Disclaimer
The information contained in this indicator does not constitute any financial advice or a solicitation to buy or sell any securities of any type.
My scripts/indicators/ideas are for educational purposes only!

Best scalping toolExplanation:
This script is a comprehensive indicator that combines three essential technical analysis tools: Money Flow Index (MFI), Relative Strength Index (RSI), and Bollinger Bands (Bollinger %B). It provides insights into market conditions related to cross points of mfi,rsi and B%B.
A buy condition is created when the last candle RSI and MFI are under the bollinger bands, and then in the actual candle the RSI cross up the bollinger low band.
A sell condition is created when the last candle RSI and MFI are above the bollinger bands, and then in the actual candle the RSI cross down the bollinger high band.
Key Components:
MFI (Money Flow Index):
Utilizes the MFI indicator based on a specified length.
Overbought and oversold levels (80 and 20, respectively).
RSI (Relative Strength Index): (Adapted to the mfi chart)
Allows selection of different moving average types (SMA, EMA, etc.) for the RSI calculation.
RSI along with upper and lower bands (70 and 30).
Bollinger Bands:
Provides upper and lower Bollinger Bands based on the RSI's standard deviation.
Visualization Options:
Allows the user to choose between show the buy (green arrow) and the sell (red arrow) .
How It Works:
The indicator amalgamates these three powerful technical indicators to help traders identify potential entry or exit points. The green arrow its a buy signal and the red arrow is a sell signal.
By offering configurable settings and clear visual cues, this indicator assists traders in recognizing critical market conditions and potential trading opportunities.
Disclaimer: This indicator should be used as a tool in a broader trading strategy and not solely for making trading decisions. It's recommended to combine it with other technical or fundamental analysis for comprehensive trading decisions.

EUR/USD 45 MIN Strategy - FinexBOTThis strategy uses three indicators:
RSI (Relative Strength Index) - It indicates if a stock is potentially overbought or oversold.
CCI (Commodity Channel Index) - It measures the current price level relative to an average price level over a certain period of time.
Williams %R - It is a momentum indicator that shows whether a stock is at the high or low end of its trading range.
Long (Buy) Trades Open:
When all three indicators suggest that the stock is oversold (RSI is below 25, CCI is below -130, and Williams %R is below -85), the strategy will open a buy position, assuming there is no current open trade.
Short (Sell) Trades Open:
When all three indicators suggest the stock is overbought (RSI is above 75, CCI is above 130, and Williams %R is above -15), the strategy will open a sell position, assuming there is no current open trade.
SL (Stop Loss) and TP (Take Profit):
SL (Stop Loss) is 0.45%.
TP (Take Profit) is 1.2%.
The strategy automatically sets these exit points as a percentage of the entry price for both long and short positions to manage risks and secure profits. You can easily adopt these inputs according to your strategy. However, default settings are recommended.

RSI Divergence SmoothedRSI Divergence Smoothed
This indicator is based on the RSI Divergence indicator by @InvestitoreComune.
The "RSI Divergence Smoothed" is a custom technical indicator designed to highlight divergence between two RSI (Relative Strength Index) lines: a fast RSI and a slow RSI. The divergence is then visualized on the chart, assisting traders in recognizing potential market reversals and trend continuation.
Here's a breakdown of its smoothing options added:
1. **WMA Difference**: The indicator first computes a weighted moving average (WMA) difference, which takes the difference between the WMA of half the input length and the WMA of the full length.
2. **Hull Moving Average (HMA)**: The indicator can use the HMA as a filter. HMA combines the benefits of a simple moving average and a linear weighted moving average, aiming to be faster in response to price changes.
3. **Sine Weighted Moving Average (SWMA)**: Another filter option, SWMA, weighs the data points by the sine of their position in the data set, giving more weight to the central data points.
4. **Kaufman's Adaptive Moving Average (KAMA)**: KAMA adapts to price volatility and can also be used as a filter. It's especially useful in choppy markets, adjusting the smoothing constant based on the relative volatility of the price series.
5. **Gaussian Moving Average (GMA)**: This filter uses a Gaussian kernel to weigh the data points, emphasizing the more recent data while giving lesser importance to older data. It helps smooth out the price data, potentially eliminating some of the noise.
I've personally found the KAMA smoothing to be most helpful but keen to hear of anyone's personal experiences and recommendations.
RSI divergence computations are based on the filtered price (or raw price if no filter is chosen) - the indicator calculates two RSIs:
- Fast RSI: With a default length of 5 periods.
- Slow RSI: With a default length of 14 periods.
The core functionality of this indicator is to compute the divergence between the Fast and Slow RSI. The divergence is plotted on the chart, with the color indicating its direction: white for positive divergence and red for negative.
Bullish Divergence Short-term Long Trade FinderThis script is a Bullish divergence trade finder built to find small periods where Bitcoin will likely rise from. It looks for bullish divergence followed by a higher low as long as the hour RSI value is below the 40 mark, if then it will enter an long. It marks out Buy signals on the RSI if the value dips below 'RSI Bull Condition Minimum' (Default 40) on the current time frame in view. It also marks out Sell signals found when the RSI is above the 'RSI Bearish Condition Minimum' (Default 50). The sell signals are bearish divergence that has occurred recently on the RSI. When a long is in play it will sell if it finds bearish divergence or the time frame in view reaches RSI value higher than the 'RSI Sell Value'(Default 75). You can set your stop loss value with the 'Stop loss Percentage' (default 5).
Available inputs:
RSI Period: relative strength measurement length(Typically 14)
RSI Oversold Level: the bottom bar of the RSI (Typically 30)
RSI Overbought Level: the top bar of the RSI (Typically 70)
RSI Bearish Condition Minimum: The minimum value the script will use to look for a pivot high that starts the Bearish condition to Sell (Default 50)
RSI Bearish Condition Sell Min: the minimum value the script will accept a bearish condition (Default 60)
RSI Bull Condition Minimum: the minimum value it will consider a pivot low value in the RSI to find a divergence buy (Default 40)
Look Back this many candles: the amount of candles thee script will look back to find a low value in the RSI (Default 25)
RSI Sell Value: The RSI value of the exit condition for a long when value is reached (Default 75)
Stop loss Percentage: Percentage value for amount to lose (Default 5)
The formula to enter a long is stated below:
If price finds a lower low and there is a higher low found following a lower low and price has just made another dip and price closes lower than the last divergence and Relative strength index hour value is less than 40 enter a long.
The formula to exit a long is stated below:
If the value drops below the stop loss percentage OR (the RSI value is greater than the value of the parameter 'RSI Sell Value' or bearish divergence is found greater than the parameter 'RSI Bearish Condition Minimum' )
This script was built from much strategy testing on BTC but works with alts (occasionally) also. It is most successful to my knowledge using the 15 min and 7 min time frames with default values. Hope it helps! Follow for further possible updates to this script or other entry or exit strategies.
snapshot:
I only have a Pro trading view account so I cannot share a larger data set about this script because the buy signals happen pretty rarely. The most amount that I could find within a view for me was 40 trades within a viewable time. The suggested/default parameters that I have do not occur very often so it limits the data set. Adjustments can be made to the parameters so that trades can be entered more often. The scripts success is dependent on the values of the parameters set by the user. This script was written to be used for BTC/USD or BTC/USDT trading. I am unable to share a larger dataset without putting out results that are intended to fail or having a premium account so reaching the 100 trade minimum is not possible with my account.

RSI + MA, LinReg, ZZ (HH HL LH LL), Div, Ichi, MACD and TSI HistRelative Strength Index with Moving Average, Linear Regression, Zig Zag (Highs and Lows), Divergence, Ichimoku Cloud, Moving Average Convergence Divergence and True Strength Index Histogram
This script is based on zdmre's RSI script, I revamped a lot of things and added a few indicators from ParkF's RSI script.
Disable Labels in the Style tab and the histogram if you don't enlarge the indicator and it seems too small.
Look to buy in the oversold area and bounce of the support of the linear regression.
Look to sell in the overbought area and bounce of the resistance of the linear regression.
Look for retracement to the moving average or horizontal lines, and divergences for potential reversal.
RSI
The Relative Strength Index (RSI) is a well versed momentum based oscillator which is used to measure the speed (velocity) as well as the change (magnitude) of directional price movements.
Moving Average
Moving Average (MA) is a good way to gauge momentum as well as to confirm trends, and define areas of support and resistance.
Linear Regression
The Linear Regression indicator visualizes the general price trend of a specific part of the chart based on the Linear Regression calculation.
Zig Zag (Highs and Lows)
The Zig Zag indicator is used to identify price trends, and in doing so plots points on the chart to mark whenever prices reverse by a larger percentage point than a predetermined variable or marker.
Divergence
The divergence indicator warns traders and technical analysts of changes in a price trend, oftentimes that it is weakening or changing direction.
Ichimoku Cloud
The Ichimoku Cloud is a package of multiple technical indicators that signal support, resistance, market trend, and market momentum.
MACD and TSI Histogram
MACD can be used to identify aspects of a security's overall trend.
The True Strength Index indicator is a momentum oscillator designed to detect, confirm or visualize the strength of a trend.

Multi Type RSI [Misu]█ This Indicator is based on RSI ( Relative Strength Index ) & multiple type of MA (Moving Average) to show different variations of RSI.
The relative strength index (RSI) is a momentum indicator used in technical analysis to evaluate overvalued or undervalued conditions in the price of that security.
█ Usages:
The purpose of this indicator is to obtain the RSI calculated with different MAs modes instead of the classic RMA.
The red and green zones indicate the oversold and overbought zones.
Buy or sell signals are marked by the green and red circles
We have 2 different signal modes : when the different size RSIs cross and when the fast RSI crosses the extreme bands.
Alerts are setup.
█ Parameters:
Lenght RSI: The lenght of the RSI. (14 by default)
RSI MA Type: The type of MA with which the rsi will be calculated. ("SMA", "EMA", "SMMA (RMA)", "WMA", "VWMA")
Fast Lenght MA: The fast lenght smoothing MA.
Slow Lenght MA: The Slow lenght smoothing MA.
Lower Band: The lenght of the lower band. (25 by default)
Upper Band: The lenght of the upper band. (75 by default)
Signal Type: The mode with which buy and sell signals are triggered. ("Cross 2 Mas", "Cross Ma/Bands")

RAS.V2 Strength Index OscillatorHeavily modified version of my previous "Relative Aggregate Strength Oscillator" -Added high/low lines, alma curves,, lrc bands, changed candle calculations + other small things. Replaces the standard RSI indicator with something a bit more insightful.
Credits to @wolneyyy - 'Mean Deviation Detector - Throw Out All Other Indicators ' And @algomojo - 'Responsive Coppock Curve'
And the default Relative Strength Index
The candles are the average of the MFI ,CCI ,MOM and RSI candles, they seemed similar enough in style to me so I created candles out of each and the took the sum of all the candle's OHLC values and divided by 4 to get an average, same as v1 but with some tweaks. Previous Peaks and Potholes visible with the blue horizontal lines which adjust when a new boundary is established. Toggle alma waves or smalrc curves or both to your liking. This indicator is great for calling out peaks and troughs in realtime, although is best when combined with other trusted indicators to get a consensus.
