NASI +The NASI + indicator is an advanced adaptation of the classic McClellan Oscillator, a tool widely used to gauge market breadth. It calculates the McClellan Oscillator by measuring the difference between the 19-day and 39-day EMAs of net advancing issues, which are optionally adjusted to account for the relative strength of advancing vs. declining stocks.
To enhance this analysis, NASI + applies the Relative Strength Index (RSI) to the cumulative McClellan Oscillator values, generating a unique momentum-based view of market breadth. Additionally, two extra EMAs—a 10-day and a 4-day EMA—are applied to the RSI, providing further refinement to signals for overbought and oversold conditions.
With NASI +, users benefit from:
-A deeper analysis of market momentum through cumulative breadth data.
-Enhanced sensitivity to trend shifts with the applied RSI and dual EMAs.
-Clear visual cues for overbought and oversold conditions, aiding in intuitive signal identification.
Cerca negli script per "Relative"

MACD+RSI+BBDESCRIPTION
The MACD + RSI + Bollinger Bands Indicator is a comprehensive technical analysis tool designed for traders and investors to identify potential market trends and reversals. This script combines three indicators: the Moving Average Convergence Divergence (MACD), the Relative Strength Index (RSI), and Bollinger Bands. Each of these indicators provides unique insights into market behavior.
FEATURES
MACD (Moving Average Convergence Divergence)
The MACD is a trend-following momentum indicator that shows the relationship between two moving averages of a security’s price.
The script calculates the MACD line, the signal line, and the histogram, which visually represents the difference between the MACD line and the signal line.
RSI (Relative Strength Index)
The RSI is a momentum oscillator that measures the speed and change of price movements. It ranges from 0 to 100 and is typically used to identify overbought or oversold conditions.
The script allows users to set custom upper and lower thresholds for the RSI, with default values of 70 and 30, respectively.
Bollinger Bands
Bollinger Bands consist of a middle band (EMA) and two outer bands (standard deviations away from the EMA). They help traders identify volatility and potential price reversals.
The script allows users to customize the length of the Bollinger Bands and the multiplier for the standard deviation.
Color-Coding Logic
The histogram color changes based on the following conditions:
Black: If the RSI is above the upper threshold and the closing price is above the upper Bollinger Band, or if the RSI is below the lower threshold and the closing price is below the lower Bollinger Band.
Green (#4caf50): If the RSI is above the upper threshold but the closing price is not above the upper Bollinger Band.
Light Green (#a5d6a7): If the histogram is positive and the RSI is not above the upper threshold.
Red (#f23645): If the RSI is below the lower threshold but the closing price is not below the lower Bollinger Band.
Light Red (#faa1a4): If the histogram is negative and the RSI is not below the lower threshold.
Inputs
Bollinger Bands Settings
Length: The number of periods for the moving average.
Basis MA Type: The type of moving average (SMA, EMA, SMMA, WMA, VWMA).
Source: The price source for the Bollinger Bands calculation.
StdDev: The multiplier for the standard deviation.
RSI Settings
RSI Length: The number of periods for the RSI calculation.
RSI Upper: The upper threshold for the RSI.
RSI Lower: The lower threshold for the RSI.
Source: The price source for the RSI calculation.
MACD Settings
Fast Length: The length for the fast moving average.
Slow Length: The length for the slow moving average.
Signal Smoothing: The length for the signal line smoothing.
Oscillator MA Type: The type of moving average for the MACD calculation.
Signal Line MA Type: The type of moving average for the signal line.
Usage
This indicator is suitable for various trading strategies, including day trading, swing trading, and long-term investing.
Traders can use the MACD histogram to identify potential buy and sell signals, while the RSI can help confirm overbought or oversold conditions.
The Bollinger Bands provide context for price volatility and potential breakout or reversal points.
Example:
From the example, it can clearly see that the Selling Climax and Buying Climax, marked as orange circle when a black histogram occurs.
Conclusion
The MACD + RSI + Bollinger Bands Indicator is a versatile tool that combines multiple technical analysis methods to provide traders with a comprehensive view of market conditions. By utilizing this script, traders can enhance their analysis and improve their decision-making process.

Z-Score RSI StrategyOverview
The Z-Score RSI Indicator is an experimental take on momentum analysis. By applying the Relative Strength Index (RSI) to a Z-score of price data, it measures how far prices deviate from their mean, scaled by standard deviation. This isn’t your traditional use of RSI, which is typically based on price data alone. Nevertheless, this unconventional approach can yield unique insights into market trends and potential reversals.
Theory and Interpretation
The RSI calculates the balance between average gains and losses over a set period, outputting values from 0 to 100. Typically, people look at the overbought or oversold levels to identify momentum extremes that might be likely to lead to a reversal. However, I’ve often found that RSI can be effective for trend-following when observing the crossover of its moving average with the midline or the crossover of the RSI with its own moving average. These crossovers can provide useful trend signals in various market conditions.
By combining RSI with a Z-score of price, this indicator estimates the relative strength of the price’s distance from its mean. Positive Z-score trends may signal a potential for higher-than-average prices in the near future (scaled by the standard deviation), while negative trends suggest the opposite. Essentially, when the Z-Score RSI indicates a trend, it reflects that the Z-score (the distance between the average and current price) is likely to continue moving in the trend’s direction. Generally, this signals a potential price movement, though it’s important to note that this could also occur if there’s a shift in the mean or standard deviation, rather than a meaningful change in price itself.
While the Z-Score RSI could be an insightful addition to a comprehensive trading system, it should be interpreted carefully. Mean shifts may validate the indicator’s predictions without necessarily indicating any notable price change, meaning it’s best used in tandem with other indicators or strategies.
Recommendations
Before putting this indicator to use, conduct thorough backtesting and avoid overfitting. The added parameters allow fine-tuning to fit various assets, but be careful not to optimize purely for the highest historical returns. Doing so may create an overly tailored strategy that performs well in backtests but fails in live markets. Keep it balanced and look for robust performance across multiple scenarios, as overfitting is likely to lead to disappointing real-world results.

Momentum Nexus Oscillator [UAlgo]The "Momentum Nexus Oscillator " indicator is a comprehensive momentum-based tool designed to provide traders with visual cues on market conditions using multiple oscillators. By combining four popular technical indicators—RSI (Relative Strength Index), VZO (Volume Zone Oscillator), MFI (Money Flow Index), and CCI (Commodity Channel Index)—this heatmap offers a holistic view of the market's momentum.
The indicator plots two lines: one representing the current chart’s combined momentum score and the other representing a higher timeframe’s (HTF) score, if enabled. Through smooth gradient color transitions and easy-to-read signals, the Momentum Nexus Heatmap allows traders to easily identify potential trend reversals or continuation patterns.
Traders can use this tool to detect overbought or oversold conditions, helping them anticipate possible long or short trade opportunities. The option to use a higher timeframe enhances the flexibility of the indicator for longer-term trend analysis.
🔶 Key Features
Multi-Oscillator Approach: Combines four popular momentum oscillators (RSI, VZO, MFI, and CCI) to generate a weighted score, providing a comprehensive picture of market momentum.
Dynamic Color Heatmap: Utilizes a smooth gradient transition between bullish and bearish colors, reflecting market momentum across different thresholds.
Higher Timeframe (HTF) Compatibility: Includes an optional higher timeframe input that displays a separate score line based on the same momentum metrics, allowing for multi-timeframe analysis.
Customizable Parameters: Adjustable RSI, VZO, MFI, and CCI lengths, as well as overbought and oversold levels, to match the trader’s strategy or preference.
Signal Alerts: Built-in alert conditions for both the current chart and higher timeframe scores, notifying traders when long or short entry signals are triggered.
Buy/Sell Signals: Displays visual signals (▲ and ▼) on the chart when combined scores reach overbought or oversold levels, providing clear entry cues.
User-Friendly Visualization: The heatmap is separated into four sections representing each indicator, providing a transparent view of how each contributes to the overall momentum score.
🔶 Interpreting Indicator:
Combined Score
The indicator generates a combined score by weighing the individual contributions of RSI, VZO, MFI, and CCI. This score ranges from 0 to 100 and is plotted as a line on the chart. Lower values suggest potential oversold conditions, while higher values indicate overbought conditions.
Color Heatmap
The indicator divides the combined score into four distinct sections, each representing one of the underlying momentum oscillators (RSI, VZO, MFI, and CCI). Bullish (greenish) colors indicate upward momentum, while bearish (grayish) colors suggest downward momentum.
Long/Short Signals
When the combined score drops below the oversold threshold (default is 26), a long signal (▲) is displayed on the chart, indicating a potential buying opportunity.
When the combined score exceeds the overbought threshold (default is 74), a short signal (▼) is shown, signaling a potential sell or short opportunity.
Higher Timeframe Analysis
If enabled, the indicator also plots a line representing the combined score for a higher timeframe. This can be used to align lower timeframe trades with the broader trend of a higher timeframe, providing added confirmation.
Signals for long and short entries are also plotted for the higher timeframe when its combined score reaches overbought or oversold levels.
🔶Purpose of Using Multiple Technical Indicators
The combination of RSI, VZO, MFI, and CCI in the Momentum Nexus Heatmap provides a comprehensive approach to analyzing market momentum by leveraging the unique strengths of each indicator. This multi-indicator method minimizes the limitations of using just one tool, resulting in more reliable signals and a clearer understanding of market conditions.
RSI (Relative Strength Index)
RSI contributes by measuring the strength and speed of recent price movements. It helps identify overbought or oversold levels, signaling potential trend reversals or corrections. Its simplicity and effectiveness make it one of the most widely used indicators in technical analysis, contributing to momentum assessment in a straightforward manner.
VZO (Volume Zone Oscillator)
VZO adds the critical element of volume to the analysis. By assessing whether price movements are supported by significant volume, VZO distinguishes between price changes that are driven by real market conviction and those that might be short-lived. It helps validate the strength of a trend or alert the trader to potential weakness when price moves are unsupported by volume.
MFI (Money Flow Index)
MFI enhances the analysis by combining price and volume to gauge money flow into and out of an asset. This indicator provides insight into the participation of large players in the market, showing if money is pouring into or exiting the asset. MFI acts as a volume-weighted version of RSI, giving more weight to volume shifts and helping traders understand the sustainability of price trends.
CCI (Commodity Channel Index)
CCI contributes by measuring how far the price deviates from its statistical average. This helps in identifying extreme conditions where the market might be overextended in either direction. CCI is especially useful for spotting trend reversals or continuations, particularly during market extremes, and for identifying divergence signals.
🔶 Disclaimer
Use with Caution: This indicator is provided for educational and informational purposes only and should not be considered as financial advice. Users should exercise caution and perform their own analysis before making trading decisions based on the indicator's signals.
Not Financial Advice: The information provided by this indicator does not constitute financial advice, and the creator (UAlgo) shall not be held responsible for any trading losses incurred as a result of using this indicator.
Backtesting Recommended: Traders are encouraged to backtest the indicator thoroughly on historical data before using it in live trading to assess its performance and suitability for their trading strategies.
Risk Management: Trading involves inherent risks, and users should implement proper risk management strategies, including but not limited to stop-loss orders and position sizing, to mitigate potential losses.
No Guarantees: The accuracy and reliability of the indicator's signals cannot be guaranteed, as they are based on historical price data and past performance may not be indicative of future results.

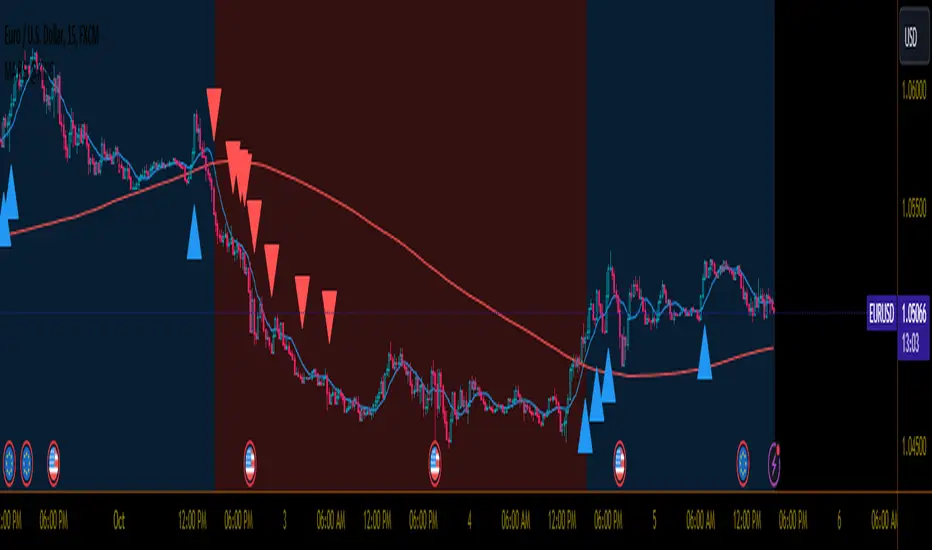
RSI with Swing Trade by Kelvin_VAlgorithm Description: "RSI with Swing Trade by Kelvin_V"
1. Introduction:
This algorithm uses the RSI (Relative Strength Index) and optional Moving Averages (MA) to detect potential uptrends and downtrends in the market. The key feature of this script is that it visually changes the candle colors based on the market conditions, making it easier for users to identify potential trend swings or wave patterns.
The strategy offers flexibility by allowing users to enable or disable the MA condition. When the MA condition is enabled, the strategy will confirm trends using two moving averages. When disabled, the strategy will only use RSI to detect potential market swings.
2. Key Features of the Algorithm:
RSI (Relative Strength Index):
The RSI is used to identify potential market turning points based on overbought and oversold conditions.
When the RSI exceeds a predefined upper threshold (e.g., 60), it suggests a potential uptrend.
When the RSI drops below a lower threshold (e.g., 40), it suggests a potential downtrend.
Moving Averages (MA) - Optional:
Two Moving Averages (Short MA and Long MA) are used to confirm trends.
If the Short MA crosses above the Long MA, it indicates an uptrend.
If the Short MA crosses below the Long MA, it indicates a downtrend.
Users have the option to enable or disable this MA condition.
Visual Candle Coloring:
Green candles represent a potential uptrend, indicating a bullish move based on RSI (and MA if enabled).
Red candles represent a potential downtrend, indicating a bearish move based on RSI (and MA if enabled).
3. How the Algorithm Works:
RSI Levels:
The user can set RSI upper and lower bands to represent potential overbought and oversold levels. For example:
RSI > 60: Indicates a potential uptrend (bullish move).
RSI < 40: Indicates a potential downtrend (bearish move).
Optional MA Condition:
The algorithm also allows the user to apply the MA condition to further confirm the trend:
Short MA > Long MA: Confirms an uptrend, reinforcing a bullish signal.
Short MA < Long MA: Confirms a downtrend, reinforcing a bearish signal.
This condition can be disabled, allowing the user to focus solely on RSI signals if desired.
Swing Trade Logic:
Uptrend: If the RSI exceeds the upper threshold (e.g., 60) and (optionally) the Short MA is above the Long MA, the candles will turn green to signal a potential uptrend.
Downtrend: If the RSI falls below the lower threshold (e.g., 40) and (optionally) the Short MA is below the Long MA, the candles will turn red to signal a potential downtrend.
Visual Representation:
The candle colors change dynamically based on the RSI values and moving average conditions, making it easier for traders to visually identify potential trend swings or wave patterns without relying on complex chart analysis.
4. User Customization:
The algorithm provides multiple customization options:
RSI Length: Users can adjust the period for RSI calculation (default is 4).
RSI Upper Band (Potential Uptrend): Users can customize the upper RSI level (default is 60) to indicate a potential bullish move.
RSI Lower Band (Potential Downtrend): Users can customize the lower RSI level (default is 40) to indicate a potential bearish move.
MA Type: Users can choose between SMA (Simple Moving Average) and EMA (Exponential Moving Average) for moving average calculations.
Enable/Disable MA Condition: Users can toggle the MA condition on or off, depending on whether they want to add moving averages to the trend confirmation process.
5. Benefits of the Algorithm:
Easy Identification of Trends: By changing candle colors based on RSI and MA conditions, the algorithm makes it easy for users to visually detect potential trend reversals and trend swings.
Flexible Conditions: The user has full control over the RSI and MA settings, allowing them to adapt the strategy to different market conditions and timeframes.
Clear Visualization: With the candle color changes, users can quickly recognize when a potential uptrend or downtrend is forming, enabling faster decision-making in their trading.
6. Example Usage:
Day traders: Can apply this strategy on short timeframes such as 5 minutes or 15 minutes to detect quick trends or reversals.
Swing traders: Can use this strategy on longer timeframes like 1 hour or 4 hours to identify and follow larger market swings.

RCYC Bullish Bearish Indicator
Summary: The RCYC Bullish Bearish Indicator is a custom trading tool designed to help traders identify potential bullish and bearish conditions in the market using a combination of KDJ and RSI indicators. This indicator uses color-coded candles to visually represent bullish and bearish signals, making it easy to identify trend changes on the chart. The script is particularly useful for traders who prefer visual signals and want to incorporate both trend momentum (KDJ) and relative strength (RSI) in their analysis.
Description:
The RCYC Bullish Bearish Indicator is a unique mashup of the KDJ and RSI indicators, optimized to provide a clear visual representation of market conditions through color-coded candles. This indicator not only identifies the potential trend shifts but also provides alerts for significant crossover points, enhancing a trader's ability to make informed decisions.
How It Works:
KDJ Calculation:
The KDJ is a variation of the Stochastic Oscillator that includes the %J line, which can go beyond the typical 0-100 range of %K and %D.
The KDJ component of this indicator calculates the highest high and lowest low over a specified period (KDJ Length), using these values to derive the %K line.
The %D line is a smoothed version of %K, and the %J line is derived from %K and %D using the formula: J = 3 * %K - 2 * %D.
This indicator focuses on the behavior of the %J line in relation to a mid-point level (50), identifying crossovers and crossunders that signal potential shifts in market sentiment.
RSI Calculation:
The Relative Strength Index (RSI) is a momentum oscillator that measures the speed and change of price movements. It is widely used to identify overbought or oversold conditions.
In this indicator, RSI values are adjusted and plotted to align visually with the KDJ values, providing a complementary momentum analysis.
Crossover Logic and Candle Coloring:
The indicator tracks two main events:
CrossOver50: When the %J line crosses above the 50 level, indicating potential bullish momentum.
CrossUnder50: When the %J line crosses below the 50 level, indicating potential bearish momentum.
Depending on the crossover events, the script changes the color of the candles on the chart:
Red candles on the initial crossover above 50, followed by dark blue candles to maintain bullish sentiment.
Yellow candles on the initial crossover below 50, followed by light blue candles to maintain bearish sentiment.
Alerts:
The indicator includes alert conditions for both bullish and bearish signals:
Red Candle Alert: Notifies the trader when the %J line crosses above 50.
Yellow Candle Alert: Notifies the trader when the %J line crosses below 50.
These alerts allow traders to react promptly to key market signals without continuously monitoring the chart.
Usage and Benefits:
This indicator is designed for traders looking to combine momentum and trend analysis into a single visual tool. It is particularly useful for those trading in trending markets or looking for entry/exit signals based on momentum shifts.
The color-coded candles provide an intuitive way to assess market conditions at a glance, reducing the complexity associated with analyzing multiple indicators separately.
By integrating both KDJ and RSI, the RCYC Bullish Bearish Indicator offers a balanced approach to trend detection and momentum confirmation, making it versatile for various trading styles, including scalping, swing trading, and position trading.
Originality and Usefulness:
While the indicator builds upon the familiar concepts of KDJ and RSI, it uniquely merges them into a cohesive visual tool with distinct crossover-based alerts and candle coloring.
This approach makes the indicator original, as it simplifies the interpretation of complex signals into straightforward visual cues, enhancing the decision-making process for traders who prefer chart-based analysis.

Bollinger Bands with RSI Buy/Sell Signals (15 min) Bollinger Bands with RSI Buy/Sell Signals (15 Min)
Description:
The Bollinger Bands with RSI Buy/Sell Signals (15 Min) indicator is designed to help traders identify potential reversal points in the market using two popular technical indicators: Bollinger Bands and the Relative Strength Index (RSI).
How It Works:
Bollinger Bands:
Bollinger Bands consist of an upper band, lower band, and a middle line (Simple Moving Average). These bands adapt to market volatility, expanding during high volatility and contracting during low volatility.
This indicator monitors the 15-minute Bollinger Bands. If the price moves completely outside the bands, it signals that the market is potentially overextended.
Relative Strength Index (RSI):
RSI is a momentum indicator that measures the strength of price movements. RSI readings above 70 indicate an overbought condition, while readings below 30 suggest an oversold condition.
This indicator uses the RSI on the 15-minute time frame to further confirm overbought and oversold conditions.
Buy/Sell Signal Generation:
Buy Signal:
A buy signal is triggered when the market price crosses above the lower Bollinger Band on the 15-minute time frame, indicating that the market may be oversold.
Additionally, the RSI must be below 30, confirming an oversold condition.
A "Buy" label appears below the price when this condition is met.
Sell Signal:
A sell signal is triggered when the market price crosses below the upper Bollinger Band on the 15-minute time frame, indicating that the market may be overbought.
The RSI must be above 70, confirming an overbought condition.
A "Sell" label appears above the price when this condition is met.

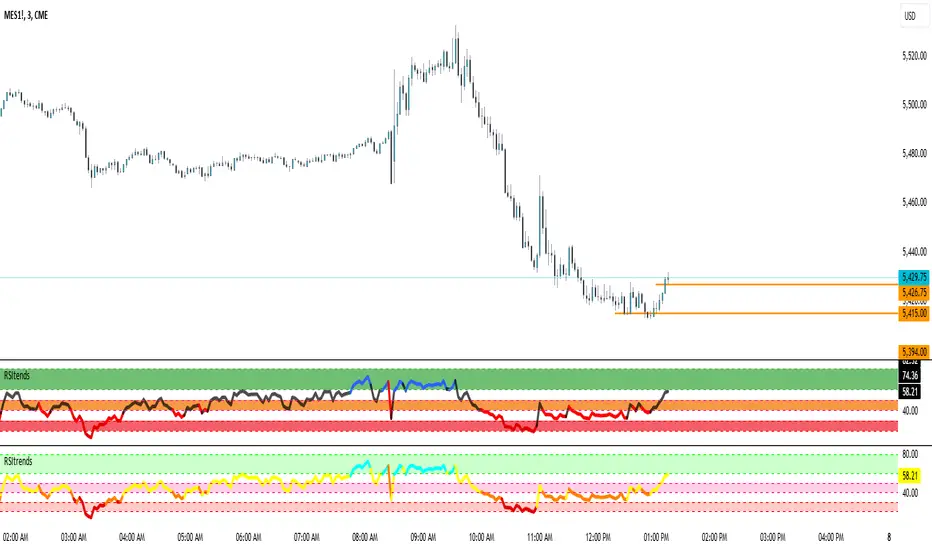
RSItrendsThis is to my friends and to my sons to use.
What Is the Relative Strength Index (RSI)?
The relative strength index (RSI) is a momentum indicator used in technical analysis. RSI measures the speed and magnitude of a security's recent price changes to evaluate overvalued or undervalued conditions in the price of that security.
The RSI is displayed as an oscillator (a line graph) on a scale of zero to 100. The indicator was developed by J. Welles Wilder Jr. and introduced in his seminal 1978 book, New Concepts in Technical Trading Systems.
1
The RSI can do more than point to overbought and oversold securities. It can also indicate securities that may be primed for a trend reversal or corrective pullback in price. It can signal when to buy and sell. Traditionally, an RSI reading of 70 or above indicates an overbought situation. A reading of 30 or below indicates an oversold condition.
Inverted SD Dema RSI | viResearchInverted SD Dema RSI | viResearch
The "Inverted SD Dema RSI" developed by viResearch introduces a new approach to trend analysis by combining the Double Exponential Moving Average (DEMA), Standard Deviation (SD), and Relative Strength Index (RSI). This unique indicator provides traders with a tool to capture market trends by integrating volatility-based thresholds. By using the smoothed DEMA along with standard deviation, the indicator offers improved responsiveness to price fluctuations, while RSI thresholds offer insight into overbought and oversold market conditions.
At the core of the "Inverted SD Dema RSI" is the combination of DEMA and standard deviation for a more nuanced view of market volatility. The use of RSI further aids in detecting price extremes and potential trend reversals.
DEMA Calculation (sublen): The Double Exponential Moving Average (DEMA) smoothes out price data over a user-defined period, reducing lag compared to traditional moving averages. This provides a clearer representation of the market's overall direction.
Standard Deviation Calculation (sublen_2): The standard deviation of the DEMA is used to define the upper (u) and lower (d) bands, highlighting areas where price volatility may signal a change in trend. These dynamic bands help traders gauge price volatility and potential breakouts or breakdowns.
RSI Calculation (len): The script applies the Relative Strength Index (RSI) to the smoothed DEMA values, allowing traders to detect momentum shifts based on a modified data set. This provides a more accurate reflection of market strength when combined with the DEMA.
Thresholds: The RSI is compared to user-defined thresholds (70 for overbought and 55 for oversold conditions). These thresholds help in identifying potential market reversals, especially when the price breaks outside of the calculated standard deviation bands.
Uptrend (L): An uptrend signal is generated when the RSI exceeds the upper threshold (70) and the price is not above the upper standard deviation band, indicating that there may be room for further price appreciation.
Downtrend (S): A downtrend signal occurs when the RSI falls below the lower threshold (55), indicating that the price may continue to decline.
The "Inverted SD Dema RSI" offers a wide range of customizable settings, allowing traders to adjust the indicator based on their trading style or market conditions.
DEMA Length (sublen): Controls the period used to smooth the price data, impacting the sensitivity of the DEMA to recent price movements.
Standard Deviation Length (sublen_2): Defines the length over which the standard deviation is calculated, helping traders control the width of the upper and lower bands.
RSI Length (len): Adjusts the period used for the RSI calculation, providing flexibility in determining overbought and oversold conditions.
RSI Thresholds: Traders can define their own levels for detecting trend reversals, with default values of 70 for an uptrend and 55 for a downtrend.
The "Inverted SD Dema RSI" is particularly well-suited for traders looking to capture trends while accounting for volatility and momentum. By using a smoothed DEMA as the foundation, it effectively filters out noise, making it ideal for detecting reliable trends in volatile markets.
Key Uses:
Trend Following: The indicator’s combination of DEMA, standard deviation, and RSI helps traders follow trends more effectively by reducing noise and identifying key momentum shifts.
Volatility Filtering: The use of standard deviation bands provides a dynamic measure of volatility, ensuring that traders are aware of potential breakouts or breakdowns in the market.
Momentum Detection: The inclusion of RSI ensures that the indicator is not only focused on trend direction but also on the strength of the underlying momentum, helping traders avoid entering trades during weak trends.
The "Inverted SD Dema RSI" provides several key advantages over traditional trend-following indicators:
Reduced Lag: The use of DEMA ensures faster trend detection, reducing the lag associated with simple moving averages.
Noise Reduction: The integration of standard deviation helps filter out irrelevant price movements, making it easier to identify significant trends.
Momentum Awareness: The addition of RSI provides valuable insight into the strength of trends, helping traders avoid false signals during periods of weak momentum.
The "Inverted SD Dema RSI" offers a powerful blend of trend-following and momentum detection, making it a versatile tool for modern traders. By integrating DEMA, standard deviation, and RSI, the indicator provides a comprehensive view of market trends and volatility. Traders are encouraged to experiment with different settings for the DEMA length, standard deviation, and RSI thresholds to fine-tune the indicator for their specific trading strategies. Whether used for trend confirmation, volatility assessment, or momentum analysis, the "Inverted SD Dema RSI" offers a valuable tool for traders seeking a comprehensive approach to market analysis.

ChartArt-Bankniftybuying5minName: ChartArt-BankNifty Buying Strategy (5-Minute)
Timeframe: 5-Minute Candles
Asset: BankNifty (Indian Stock Market Index)
Trading Hours: 9:30 AM - 2:45 PM IST (Indian Standard Time)
This strategy is designed for BankNifty intraday traders who want to capitalize on short-term price movements within a defined trading window. It combines technical indicators like Simple Moving Averages (SMA), Relative Strength Index (RSI), and candlestick patterns to identify potential buy signals during intraday downtrends. The strategy employs specific entry, stop-loss, and target conditions to manage trades effectively and minimize risk.
Technical Indicators Used
Simple Moving Averages (SMA):
EMA7: 7-period SMA on closing price.
EMA5: 5-period SMA on closing price.
Purpose: Used to identify the intraday trend by comparing short-term moving averages. The strategy focuses on situations where the market is in a minor downtrend, indicated by EMA5 being below EMA7.
Relative Strength Index (RSI):
RSI14: 14-period RSI, a momentum oscillator that measures the speed and change of price movements.
SMA14: 14-period SMA of the RSI.
Purpose: RSI is used to identify potential reversal points. The strategy looks for situations where the RSI is below its own moving average, suggesting weakening momentum in the downtrend.
Candlestick Patterns:
Relaxed Hammer or Doji (2nd Candle): A pattern where the second candle in a 3-candle sequence shows a potential reversal signal (Hammer or Doji), indicating indecision or a potential turning point.
Bearish 1st Candle: The first candle is bearish, setting up the context for a potential reversal.
Bullish 3rd Candle: The third candle must be bullish with specific characteristics (closing near the high, surpassing the previous high), confirming the reversal.
Strategy Conditions
Time Condition:
The strategy is only active during specific hours (9:30 AM to 2:45 PM IST). This ensures that trades are only taken during the most liquid hours of the trading day, avoiding potential volatility or lack of liquidity towards market close.
Intraday Downtrend Condition:
EMA5 < EMA7: Indicates that the market is in a minor downtrend. The strategy looks for reversal opportunities within this trend.
RSI Condition:
RSI14 <= SMA14: Indicates that the current RSI value is below its 14-period SMA, suggesting potential weakening momentum, which can precede a reversal.
Candlestick Patterns:
1st Candle: Must be bearish, setting up the context for a potential reversal.
2nd Candle: Must either be a Hammer or Doji, indicating a potential reversal pattern.
3rd Candle: Must be bullish, with specific characteristics (closing near the high, breaking the previous high, etc.), confirming the reversal.
RSI Crossover Condition:
A crossover of the RSI over its SMA in the last 5 periods is also checked, adding further confirmation to the reversal signal.
Entry and Exit Rules
Entry Signal:
A buy signal is generated when all the conditions (time, intraday downtrend, bearish 1st candle, hammer/doji 2nd candle, bullish 3rd candle, and RSI condition) are met. The trade is entered at the high of the bullish third candle.
Stop Loss:
The stop loss is calculated based on the difference between the entry price and the low of the second candle. If this difference is greater than 90 points, the stop loss is placed at the midpoint of the second candle's range (average of high and low). Otherwise, it is placed at the low of the second candle.
Target 1:
The first target is set at 1.8 times the difference between the entry price and the stop loss. When this target is hit, half of the position is exited to lock in partial profits.
Target 2:
The second target is set at 3 times the difference between the entry price and the stop loss. The remaining position is exited at this point, or if the price hits the stop loss.
Originality and Usefulness
This strategy is original in its combination of multiple technical indicators and candlestick patterns to identify potential reversals in a specific intraday timeframe. By focusing on minor downtrends and utilizing a 3-candle reversal pattern, the strategy seeks to capture quick price movements with a structured approach to risk management.
Key Benefits:
High Precision: The strategy’s multi-step filtering process (time condition, trend confirmation, candlestick pattern analysis, and momentum evaluation via RSI) increases the likelihood of accurate trade signals.
Risk Management: The use of a dynamic stop-loss based on candle characteristics, combined with partial profit-taking, allows traders to lock in profits while still giving the trade room to develop further.
Structured Approach: The strategy provides a clear, rule-based system for entering and exiting trades, which can help remove emotional decision-making from the trading process.
Charts and Signals
The strategy produces signals in the form of labels on the chart:
Buy Signal: A green label is plotted below the candle that meets all entry conditions, indicating a potential buy opportunity.
Stop Loss (SL): A red dashed line is drawn at the stop-loss level with a label indicating "SL".
Target 1 (1st TG): A blue dashed line is drawn at the first target level with a label indicating "1st TG".
Target 2 (2nd TG): Another blue dashed line is drawn at the second target level with a label indicating "2nd TG".
These visual aids help traders quickly identify entry points, stop loss levels, and target levels on the chart, making the strategy easy to follow and implement.
Backtesting and Optimization
Backtesting: The strategy can be backtested on TradingView using historical data to evaluate its performance. Traders should consider testing across different market conditions to ensure the strategy's robustness.
Optimization: Parameters such as the RSI period, moving averages, and target multipliers can be optimized based on backtesting results to refine the strategy further.
Conclusion
The ChartArt-BankNifty Buying Strategy offers a well-rounded approach to intraday trading, focusing on capturing reversals in minor downtrends. With a strong emphasis on technical analysis, precise entry and exit rules, and robust risk management, this strategy provides a solid framework for traders looking to engage in intraday trading on BankNifty.

Multi-Factor StrategyThis trading strategy combines multiple technical indicators to create a systematic approach for entering and exiting trades. The goal is to capture trends by aligning several key indicators to confirm the direction and strength of a potential trade. Below is a detailed description of how the strategy works:
Indicators Used
MACD (Moving Average Convergence Divergence):
MACD Line: The difference between the 12-period and 26-period Exponential Moving Averages (EMAs).
Signal Line: A 9-period EMA of the MACD line.
Usage: The strategy looks for crossovers between the MACD line and the Signal line as entry signals. A bullish crossover (MACD line crossing above the Signal line) indicates a potential upward movement, while a bearish crossover (MACD line crossing below the Signal line) signals a potential downward movement.
RSI (Relative Strength Index):
Usage: RSI is used to gauge the momentum of the price movement. The strategy uses specific thresholds: below 70 for long positions to avoid overbought conditions and above 30 for short positions to avoid oversold conditions.
ATR (Average True Range):
Usage: ATR measures market volatility and is used to set dynamic stop-loss and take-profit levels. A stop loss is set at 2 times the ATR, and a take profit at 3 times the ATR, ensuring that risk is managed relative to market conditions.
Simple Moving Averages (SMA):
50-day SMA: A short-term trend indicator.
200-day SMA: A long-term trend indicator.
Usage: The strategy uses the relationship between the 50-day and 200-day SMAs to determine the overall market trend. Long positions are taken when the price is above the 50-day SMA and the 50-day SMA is above the 200-day SMA, indicating an uptrend. Conversely, short positions are taken when the price is below the 50-day SMA and the 50-day SMA is below the 200-day SMA, indicating a downtrend.
Entry Conditions
Long Position:
-MACD Crossover: The MACD line crosses above the Signal line.
-RSI Confirmation: RSI is below 70, ensuring the asset is not overbought.
-SMA Confirmation: The price is above the 50-day SMA, and the 50-day SMA is above the 200-day SMA, indicating a strong uptrend.
Short Position:
MACD Crossunder: The MACD line crosses below the Signal line.
RSI Confirmation: RSI is above 30, ensuring the asset is not oversold.
SMA Confirmation: The price is below the 50-day SMA, and the 50-day SMA is below the 200-day SMA, indicating a strong downtrend.
Opposite conditions for shorts
Exit Strategy
Stop Loss: Set at 2 times the ATR from the entry price. This dynamically adjusts to market volatility, allowing for wider stops in volatile markets and tighter stops in calmer markets.
Take Profit: Set at 3 times the ATR from the entry price. This ensures a favorable risk-reward ratio of 1:1.5, aiming for higher rewards on successful trades.
Visualization
SMAs: The 50-day and 200-day SMAs are plotted on the chart to visualize the trend direction.
MACD Crossovers: Bullish and bearish MACD crossovers are highlighted on the chart to identify potential entry points.
Summary
This strategy is designed to align multiple indicators to increase the probability of successful trades by confirming trends and momentum before entering a position. It systematically manages risk with ATR-based stop loss and take profit levels, ensuring that trades are exited based on market conditions rather than arbitrary points. The combination of trend indicators (SMAs) with momentum and volatility indicators (MACD, RSI, ATR) creates a robust approach to trading in various market environments.

RSI Slope Filtered Signals [UAlgo]The "RSI Slope Filtered Signals " is a technical analysis tool designed to enhance the accuracy of RSI (Relative Strength Index) signals by incorporating slope analysis. This indicator not only considers the RSI value but also analyzes the slope of the RSI over a specified number of bars, providing a more refined signal that accounts for the momentum and trend strength. By utilizing both positive and negative slope arrays, the indicator dynamically adjusts its thresholds, ensuring that signals are responsive to changing market conditions. This tool is particularly useful for traders looking to identify overbought and oversold conditions with a higher degree of precision, filtering out noise and providing clear visual cues for potential market reversals.
🔶 Key Features
Dynamic Slope Analysis: Measures the slope of RSI over a customizable number of bars, offering insights into the momentum and trend direction.
Adaptive Thresholds: Uses historical slope data to calculate dynamic thresholds, adjusting signal sensitivity based on market conditions.
Normalized Slope Calculation: Normalizes the slope values to provide a consistent measure across different market conditions, making the indicator more versatile.
Clear Signal Visualization: The indicator plots both positive and negative normalized slopes with color gradients, visually representing the strength of the trend.
Overbought and Oversold Signals: Plots overbought and oversold signals directly on the chart when the calculated value reaches the user-specified threshold, helping traders identify potential reversal points.
Customizable Settings: Allows users to adjust the RSI length, slope measurement bars, and lookback periods, providing flexibility to tailor the indicator to different trading strategies.
🔶 Interpreting the Indicator
The "RSI Slope Filtered Signals " indicator is designed to be easy to interpret. Here's how you can use it:
Normalized Slope: The indicator plots the normalized slope of the RSI, with values above zero indicating positive momentum and values below zero indicating negative momentum. A higher positive slope suggests a strong upward trend, while a deeper negative slope indicates a strong downward trend.
Reversal Signals: The indicator plots several horizontal lines at different thresholds (+3, +2, +1, 0, -1, -2, -3). These levels are used to gauge the strength of the momentum based on the normalized slope. For example, a normalized slope crossing above the +2 threshold may indicate a strong bullish trend, while crossing below the -2 threshold may suggest a strong bearish trend. These thresholds help in understanding the intensity of the current trend and provide context for interpreting the indicator's signals.
This indicator generates overbought and oversold signals not solely based on the RSI entering extreme levels (above 70 for overbought and below 30 for oversold), but also by considering the behavior of the normalized slope relative to specific thresholds. Specifically, the Overbought Signal (🔽) is triggered when the RSI is above 70 and the normalized slope from the previous bar is greater than or equal to the upper threshold, with the current slope being lower than the previous slope, indicating a potential bearish reversal as momentum may be slowing down.
Similarly, the Oversold Signal (🔼) is generated when the RSI is below 30 and the normalized slope from the previous bar is less than or equal to the lower threshold, with the current slope being higher than the previous slope, signaling a potential bullish reversal as the downward momentum may be weakening.
Area Plots: The indicator also plots the positive and negative slopes as filled areas, providing a quick visual cue for the strength and direction of the trend. Green areas represent positive slopes (upward momentum), while red areas represent negative slopes (downward momentum).
By combining these elements, the "RSI Slope Filtered Signals " provides a comprehensive view of the market's momentum, helping traders make more informed decisions by filtering out false signals and focusing on the significant trends.
🔶 Disclaimer
Use with Caution: This indicator is provided for educational and informational purposes only and should not be considered as financial advice. Users should exercise caution and perform their own analysis before making trading decisions based on the indicator's signals.
Not Financial Advice: The information provided by this indicator does not constitute financial advice, and the creator (UAlgo) shall not be held responsible for any trading losses incurred as a result of using this indicator.
Backtesting Recommended: Traders are encouraged to backtest the indicator thoroughly on historical data before using it in live trading to assess its performance and suitability for their trading strategies.
Risk Management: Trading involves inherent risks, and users should implement proper risk management strategies, including but not limited to stop-loss orders and position sizing, to mitigate potential losses.
No Guarantees: The accuracy and reliability of the indicator's signals cannot be guaranteed, as they are based on historical price data and past performance may not be indicative of future results.

Uptrick: Bullish/Bearish Signal DetectorDetailed Explanation of the "Uptrick: Bullish/Bearish Signal Detector" Script
The "Uptrick: Bullish/Bearish Signal Detector" script is a sophisticated tool designed for the TradingView platform, leveraging Pine Script version 5. This script is crafted to enhance traders' ability to identify bullish (buy) and bearish (sell) signals directly on their trading charts. By combining the power of the MACD (Moving Average Convergence Divergence) and RSI (Relative Strength Index) indicators, this script provides a unique and efficient method for detecting potential trading opportunities. Below is an in-depth exploration of its purpose, features, and functionality.
Purpose
The primary purpose of this script is to assist traders in identifying potential entry and exit points in the market by signaling bullish and bearish conditions. This automated detection helps traders make more informed decisions without the need to manually analyze complex indicators. By overlaying signals directly on the price chart, the script allows for quick visual identification of market trends and reversals.
Uniqueness
What sets this script apart is its dual use of MACD and RSI indicators. While many trading strategies might rely on a single indicator, combining MACD and RSI enhances the reliability of the signals by filtering out false positives. The script not only identifies trends but also adds a layer of confirmation through the RSI, which measures the speed and change of price movements.
Inputs and Features
Customizable Label Appearance:
The script allows users to customize the appearance of the labels that indicate bullish and bearish signals. Users can set their preferred colors for the labels and the text, ensuring that the signals are easily distinguishable and aesthetically pleasing on their charts.
MACD Calculation:
The script calculates the MACD line and signal line using user-defined input values for the fast length, slow length, and signal length. The MACD histogram, which is the difference between the MACD line and the signal line, is used to determine the momentum of the market.
RSI Calculation:
The RSI is calculated using a user-defined input length. The RSI helps in identifying overbought or oversold conditions, which are crucial for confirming the strength of the trend detected by the MACD.
Bullish and Bearish Conditions:
The script defines bullish conditions as those where the MACD histogram is positive and the RSI is above 50. Bearish conditions are defined where the MACD histogram is negative and the RSI is below 50. This combination of conditions ensures that signals are generated based on both momentum and relative strength, reducing the likelihood of false signals.
Label Plotting:
The script plots labels on the chart to indicate bullish and bearish signals. When a bullish condition is met, and the previous signal was not bullish, a "LONG" label is plotted. Similarly, when a bearish condition is met, and the previous signal was not bearish, a "SHORT" label is plotted. This feature helps in clearly marking the points of interest for traders, making it easier to spot potential trades.
Tracking Previous Signals:
To avoid repetitive signals, the script keeps track of the last signal. If the last signal was bullish, it avoids plotting another bullish signal immediately. The same logic applies to bearish signals. This tracking ensures that signals are spaced out and only significant changes in market conditions are highlighted.
How It Works
The script operates in a loop, processing each bar (or candlestick) on the chart as new data comes in. It calculates the MACD and RSI values for each bar and checks if the current conditions meet the criteria for a bullish or bearish signal. If a signal is detected and it is different from the last signal, a label is plotted on the chart at the current bar's price level. This real-time processing allows traders to see the signals as they form, providing timely insights into market movements.
Practical Application
For practical use, a trader would add this script to their TradingView chart. They can customize the input parameters for the MACD and RSI calculations to fit their trading strategy or preferred settings. Once added, the script will automatically analyze the price data and start plotting "LONG" and "SHORT" labels based on the detected signals. Traders can then use these labels to make decisions on entering or exiting trades, adjusting their strategy as necessary based on the signals provided.
Conclusion
The "Uptrick: Bullish/Bearish Signal Detector" script is a powerful tool for any trader looking to leverage technical indicators for better trading decisions. By combining MACD and RSI, it offers a robust method for detecting market trends and potential reversals. The customizable features and real-time signal plotting make it a versatile and user-friendly addition to any trading toolkit. This script not only simplifies the process of technical analysis but also enhances the accuracy of trading signals, thereby potentially increasing the trader's success rate in the market.

Fisher Transform on RSIOverview
The Fisher Transform on RSI indicator combines the Relative Strength Index (RSI) with the Fisher Transform to offer a refined tool for identifying market turning points and trends. By applying the Fisher Transform to the RSI, this indicator converts RSI values into a Gaussian normal distribution, enhancing the precision of detecting overbought and oversold conditions. This method provides a clearer and more accurate identification of potential market reversals than the standard RSI.
Key/Unique Features
Fisher Transform Applied to RSI : Transforms RSI values into a Gaussian normal distribution, improving the detection of overbought and oversold conditions.
Smoothing : Applies additional smoothing to the Fisher Transform, reducing noise and providing clearer signals.
Signal Line : Includes a signal line to identify crossover points, indicating potential buy or sell signals.
Custom Alerts : Built-in alert conditions for bullish and bearish crossovers, keeping traders informed of significant market movements.
Visual Enhancements : Background color changes based on crossover conditions, offering immediate visual cues for potential trading opportunities.
How It Works
RSI Calculation : The indicator calculates the Relative Strength Index (RSI) based on the selected source and period length.
Normalization : The RSI values are normalized to fit within a range of -1 to 1, which is essential for the Fisher Transform.
Fisher Transform : The normalized RSI values undergo the Fisher Transform, converting them into a Gaussian normal distribution.
Smoothing : The transformed values are smoothed using a simple moving average to reduce noise and provide more reliable signals.
Signal Line : A signal line, which is a simple moving average of the smoothed Fisher Transform, is plotted to identify crossover points.
Alerts and Visuals : Custom alert conditions are set for bullish and bearish crossovers, and the background color changes to indicate these conditions.
Usage Instructions
Trend Identification : Use the Fisher Transform on RSI to identify overbought and oversold conditions with enhanced precision, aiding in spotting potential trend reversals.
Trade Signals : Monitor the crossovers between the smoothed Fisher Transform and the signal line. A bullish crossover suggests a potential buying opportunity, while a bearish crossover indicates a potential selling opportunity.
Alerts : Set custom alerts based on the built-in conditions to receive notifications when important crossover events occur, ensuring you never miss a trading opportunity.
Visual Cues : Utilize the background color changes to quickly identify bullish (green) and bearish (red) conditions, providing immediate visual feedback on market sentiment.
Complementary Analysis : Combine this indicator with other technical analysis tools and indicators to enhance your overall trading strategy and make more informed decisions.

Wall Street Cheat Sheet IndicatorThe Wall Street Cheat Sheet Indicator is a unique tool designed to help traders identify the psychological stages of the market cycle based on the well-known Wall Street Cheat Sheet. This indicator integrates moving averages and RSI to dynamically label market stages, providing clear visual cues on the chart.
Key Features:
Dynamic Stage Identification: The indicator automatically detects and labels market stages such as Disbelief, Hope, Optimism, Belief, Thrill, Euphoria, Complacency, Anxiety, Denial, Panic, Capitulation, Anger, and Depression. These stages are derived from the emotional phases of market participants, helping traders anticipate market movements.
Technical Indicators: The script uses two key technical indicators:
200-day Simple Moving Average (SMA): Helps identify long-term market trends.
50-day Simple Moving Average (SMA): Aids in recognizing medium-term trends.
Relative Strength Index (RSI): Assesses the momentum and potential reversal points based on overbought and oversold conditions.
Clear Visual Labels: The current market stage is displayed directly on the chart, making it easy to spot trends and potential turning points.
Usefulness:
This indicator is not just a simple mashup of existing tools. It uniquely combines the concept of market psychology with practical technical analysis tools (moving averages and RSI). By labeling the psychological stages of the market cycle, it provides traders with a deeper understanding of market sentiment and potential future movements.
How It Works:
Disbelief: Detected when the price is below the 200-day SMA and RSI is in the oversold territory, indicating a potential bottom.
Hope: Triggered when the price crosses above the 50-day SMA, with RSI starting to rise but still below 50, suggesting an early uptrend.
Optimism: Occurs when the price is above the 50-day SMA and RSI is between 50 and 70, indicating a strengthening trend.
Belief: When the price is well above the 50-day SMA and RSI is between 70 and 80, showing strong bullish momentum.
Thrill and Euphoria: Identified when RSI exceeds 80, indicating overbought conditions and potential for a peak.
Complacency to Depression: These stages are identified based on price corrections and drops relative to moving averages and declining RSI values.
Best Practices:
High-Time Frame Focus: This indicator works best on high-time frame charts, specifically the 1-week Bitcoin (BTCUSDT) chart. The longer time frame provides a clearer picture of the overall market cycle and reduces noise.
Trend Confirmation: Use in conjunction with other technical analysis tools such as trendlines, Fibonacci retracement levels, and support/resistance zones for more robust trading strategies.
How to Use:
Add the Indicator: Apply the Wall Street Cheat Sheet Indicator to your TradingView chart.
Analyze Market Stages: Observe the dynamic labels indicating the current stage of the market cycle.
Make Informed Decisions: Use the insights from the indicator to time your entries and exits, aligning your trades with the market sentiment.
This indicator is a valuable tool for traders looking to understand market psychology and make informed trading decisions based on the stages of the market cycle.

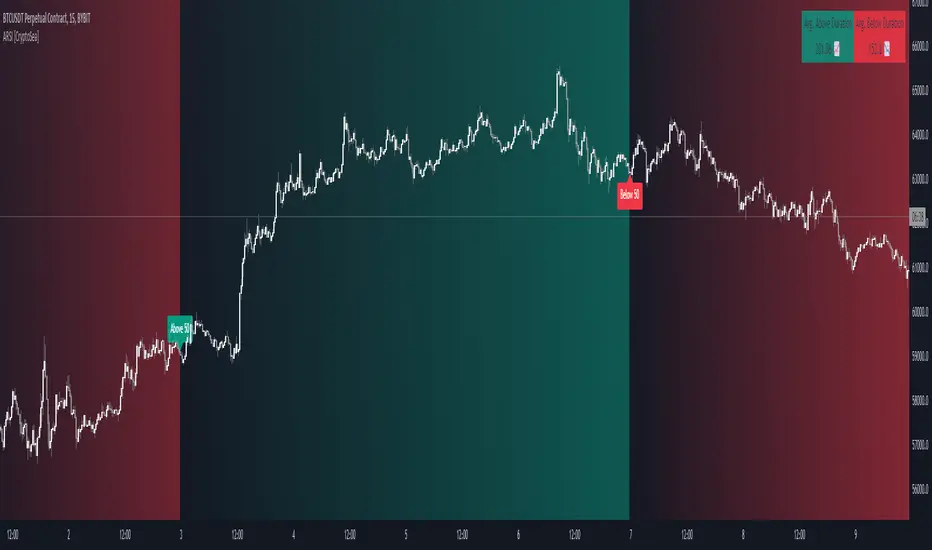
Advanced RSI [CryptoSea]The Advanced RSI Duration (ARSI) is a unique tool crafted to deepen your market insights by focusing on the duration the Relative Strength Index (RSI) spends above or below key thresholds. This innovative approach is designed to help traders anticipate potential market reversals by observing sustained overbought and oversold conditions.
Core Feature
Duration Monitoring ARSI's standout feature is its ability to track how long the RSI remains in overbought (>70) or oversold (<30) conditions. By quantifying these durations, traders can gauge the strength of current market trends and the likelihood of reversals.
Enhanced Functionality
Multi-Timeframe Flexibility : Analyze the RSI duration from any selected timeframe on your current chart, offering a layered view of market dynamics.
Customizable Alerts : Receive notifications when the RSI maintains its position above or below set levels for an extended period, signaling sustained market pressure.
Visual Customization : Adjust the visual elements, including colors for overbought and oversold durations, to match your analytical style and preferences.
Label Management : Control the frequency of labels marking RSI threshold crossings, ensuring clarity and focus on significant market events.
Settings Overview
RSI Timeframe & Length : Tailor the RSI calculation to fit your analysis, choosing from various timeframes and period lengths.
Threshold Levels : Define what you consider overbought and oversold conditions with customizable upper and lower RSI levels.
Duration Alert Threshold : Set a specific bar count for how long the RSI should remain beyond these thresholds to trigger an alert.
Visualization Options : Choose distinct colors for durations above and below thresholds, and adjust label visibility to suit your charting approach.
Application & Strategy
Use ARSI to identify potential turning points in the market
Trend Exhaustion : Extended periods in overbought or oversold territories may indicate a strong trend but also warn of possible exhaustion and impending reversals.
Comparative Analysis : By evaluating the current duration against historical averages, traders can assess the relative strength of ongoing market conditions.
Strategic Entries/Exits : Utilize duration insights to refine entry and exit points, capitalizing on the predictive nature of prolonged RSI levels.
Alert Conditions
The Advanced RSI (ARSI) offers critical alert mechanisms to aid traders in identifying prolonged market conditions that could lead to actionable trading opportunities. These conditions are designed to alert traders when the RSI remains at extremes longer than typical durations, signaling sustained market behaviors.
Above Upper Level Alert: This alert is triggered when the RSI sustains above the upper threshold (usually 70) for more than the configured duration, indicating strong bullish momentum or potential overbought conditions.
Below Lower Level Alert: Similarly, this alert is activated when the RSI stays below the lower threshold (commonly 30) for an extended period, suggesting significant bearish momentum or potential oversold conditions.
These alerts enable traders to respond swiftly to extend market conditions, enhancing their strategy by providing timely insights into potential trend reversals or continuations.
The Advanced RSI Duration Analysis empowers traders with a nuanced understanding of market states, beyond mere RSI values. It highlights the significance of how long markets remain in extreme conditions, offering a predictive edge in anticipating reversals. Whether you're strategizing entries or preparing for shifts in market momentum, ARSI is your companion for informed trading decisions.
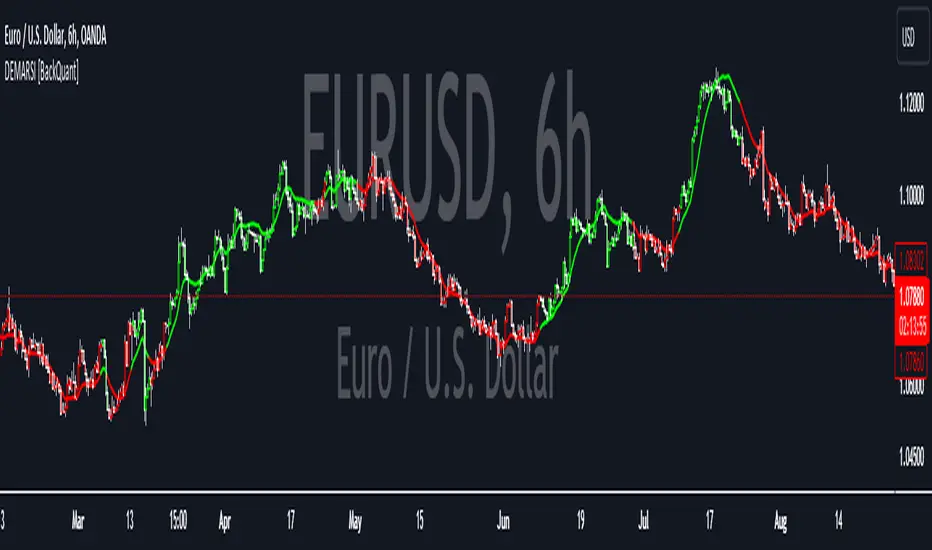
DEMA RSI Overlay [BackQuant]DEMA RSI Overlay
PLEASE Read the following, knowing what an indicator does at its core before adding it into a system is pivotal. The core concepts can allow you to include it in a logical and sound manner.
Anyways,
BackQuant's new trading indicator that blends the Double Exponential Moving Average (DEMA) with the Relative Strength Index (RSI) to create a unique overlay on the trading chart. This combination is not arbitrary; both the DEMA and RSI are revered for their distinct advantages in trading strategy development. Let's delve into the core components of this script, the rationale behind choosing DEMA and RSI, the logic of long and short signals, and its practical trading applications.
Understanding DEMA
DEMA is an enhanced version of the conventional exponential moving average that aims to reduce the lag inherent in traditional averages. It does this by applying more weight to recent prices. The reduction in lag makes DEMA an excellent tool for tracking price trends more closely. In the context of this script, DEMA serves as the foundation for the RSI calculation, offering a smoother and more responsive signal line that can provide clearer trend indications.
Why DEMA?
DEMA is chosen for its responsiveness to price changes. This characteristic is particularly beneficial in fast-moving markets where entering and exiting positions quickly is crucial. By using DEMA as the price source, the script ensures that the signals generated are timely and reflective of the current market conditions, reducing the risk of entering or exiting a trade based on outdated information.
Integrating RSI
The RSI, a momentum oscillator, measures the speed and change of price movements. It oscillates between zero and 100 and is typically used to identify overbought or oversold conditions. In this script, the RSI is calculated based on DEMA, which means it inherits the responsiveness of DEMA, allowing traders to spot potential reversals or continuation signals sooner.
Why RSI?
Incorporating RSI offers a measure of price momentum and market conditions relative to past performance. By setting thresholds for long (buy) and short (sell) signals, the script uses RSI to identify potential turning points in the market, providing traders with strategic entry and exit points.
Calculating Long and Short Signals
Long Signals : These are generated when the RSI of the DEMA crosses above the longThreshold (set at 70 by default) and the closing price is not above the upper volatility band. This suggests that the asset is gaining upward momentum while not being excessively overbought, presenting a potentially favorable buying opportunity.
Short Signals : Generated when the RSI of the DEMA falls below the shortThreshold (set at 55 by default). This indicates that the asset may be losing momentum or entering a downtrend, signaling a possible selling or shorting opportunity.
Logical Soundness
The logic of combining DEMA with RSI for generating trade signals is sound for several reasons:
Timeliness : The use of DEMA ensures that the price source for RSI calculation is up-to-date, making the momentum signals more relevant.
Balance : By setting distinct thresholds for long and short signals, the script balances sensitivity and specificity, aiming to minimize false signals while capturing genuine market movements.
Adaptability : The inclusion of user inputs for periods and thresholds allows traders to customize the indicator to fit various trading styles and timeframes.
Trading Use-Cases
This DEMA RSI Overlay indicator is versatile and can be applied across different markets and timeframes. Its primary use-cases include:
Trend Following: Traders can use it to identify the start of a new trend or the continuation of an existing trend.
Swing Trading: The indicator's sensitivity to price changes makes it ideal for swing traders looking to capitalize on short to medium-term price movements.
Risk Management: By providing clear long and short signals, it helps traders manage their positions more effectively, potentially reducing the risk of significant losses.
Final Note
We have also decided to add in the option of standard deviation bands, calculated on the DEMA, this can be used as a point of confluence rendering trading ranges. Expanding when volatility is high and compressing when it is low.
For example:
This provides the user with a 1, 2, 3 standard deviation band of the DEMA.
Thus following all of the key points here are some sample backtests on the 1D Chart
Disclaimer: Backtests are based off past results, and are not indicative of the future.
INDEX:BTCUSD
INDEX:ETHUSD
BINANCE:SOLUSD
CAPACE MARKETThis custom indicator combines the Moving Average Convergence Divergence (MACD) and the Relative Strength Index (RSI) into a single trading tool. It calculates the MACD and RSI values, then averages these two indicators to create a composite line. This average line is intended to capture the momentum and relative strength of the market simultaneously, potentially offering a more nuanced view of market conditions.
Key features of the indicator include:
Visualization of MACD and RSI Lines: It plots the MACD and RSI values as separate lines on the chart, allowing traders to see the behavior of each indicator clearly.
Average Line: A line representing the average of the MACD and RSI indicators is plotted, providing a synthesized view of both momentum and strength.
Entry Points Indication: The indicator uses red dots to mark the points where the average line crosses over or under the MACD or RSI lines. These intersections are meant to signal potential entry points for traders.
Market Condition Highlighting: The background color changes based on whether the average line is above or below zero. A green background suggests a positive market condition (bullish), while a red background indicates a negative market condition (bearish).
This tool aims to offer traders an integrated perspective by combining the insights of both MACD and RSI, potentially aiding in the identification of entry and exit points as well as the overall market sentiment.

RSI MFI WPR Combo [The_lurker]The "RSI MFI WPR Combo" is a sophisticated trading indicator developed for the TradingView platform, which synergistically combines the insights of three renowned technical analysis tools: the Relative Strength Index (RSI), the Money Flow Index (MFI), and the Williams Percent Range (WPR). This indicator is meticulously designed to assist traders in identifying potential buying and selling opportunities through the nuanced interpretation of market momentum, volume, and price position relative to recent highs and lows.
Purpose
The primary objective of the "RSI MFI WPR Combo" indicator is to offer a comprehensive tool that leverages the combined power of RSI, MFI, and WPR to detect overbought and oversold conditions, signaling potential reversal points in the market. This multifaceted approach aims to provide traders with a more robust framework for making informed decisions, enhancing their trading strategy with a multi-indicator analysis.
Indicator Conditions Explained
The core of this indicator lies in its strategic conditions that signal potential entry and exit points:
Oversold Condition (condition): This is identified when the MFI and RSI are both below 30, and the WPR falls below -91, suggesting a strong oversold market state. Such a scenario typically indicates a buying opportunity, assuming the market might rebound from this excessively sold condition.
Divergence Condition (condition1): It checks if the MFI exceeds 1.93 times the RSI. This unique condition aims to spotlight instances where there's a significant influx of money into an asset, which is not proportionately reflected in its RSI, potentially signaling an upcoming price increase or highlighting an unusual market situation for further analysis.
Overbought Warning (conditionExit): The exit signal is triggered when both the MFI and RSI exceed 85, and the WPR is above -15. This combination is indicative of an overbought market condition, suggesting the asset might be overvalued and a price correction or reversal could be imminent, hence signaling a potential selling opportunity or a caution against initiating new positions.
Application and Visualization
The "RSI MFI WPR Combo" not only provides numerical insights but also visualizes these conditions on the TradingView chart. By employing color-coding and plotting shapes, it offers traders an intuitive way to discern market states, enabling quick and effective decision-making. The integration of alert conditions ensures that traders are promptly notified of significant market events, aligning with their strategic trading objectives.
Plotting and Alerts in "RSI MFI WPR Combo"
Combined Alert Condition
The combinedAlertCondition is a logical statement that consolidates all individual conditions (condition, condition1, conditionExit, and The_lurkerMFI_oversold) into a single alert trigger. This condition becomes true and triggers an alert if any of the specified conditions for potential trading opportunities or warnings are met. It's designed to provide a comprehensive alert system that notifies the trader of any significant signal identified by the indicator, encompassing both entry and exit signals as well as oversold conditions.
Visual Indicators
Background Color for Oversold Condition: The script sets the background color to a specific shade of blue (#13c2e9 with 90% transparency) when the custom MFI indicates an oversold condition (The_lurkerMFI_oversold). This visual cue helps traders quickly identify periods when the market might be undervalued and potentially poised for a rebound.
Plotting Warning and Exit Signals:
Entry Signals: For the condition and condition1, which identify potential entry points, the indicator plots upward-pointing triangles below the price bars. These triangles are colored in specific shades to differentiate between the signals from the basic oversold condition and the divergence condition, making it visually intuitive for traders to recognize the signal type.
Exit Signals: For the conditionExit, signaling overbought conditions that might suggest an imminent price correction, downward-pointing red triangles are plotted above the price bars. This acts as a clear visual warning to consider exiting positions or to proceed with caution.
Alert Configuration
The script utilizes the alertcondition function to create an alert based on the combinedAlertCondition. When this condition is met, indicating any of the predefined signa
Conclusion
In summary, the "RSI MFI WPR Combo" stands out as a versatile and dynamic indicator that enriches a trader's toolkit by combining the analytical strengths of RSI, MFI, and WPR. By delineating clear conditions for market entry and exit points, it facilitates a proactive approach to trading, grounded in a detailed examination of market dynamics. This indicator exemplifies how blending multiple technical tools can lead to a more informed and nuanced market analysis, aiming to elevate the trading experience on the TradingView platform

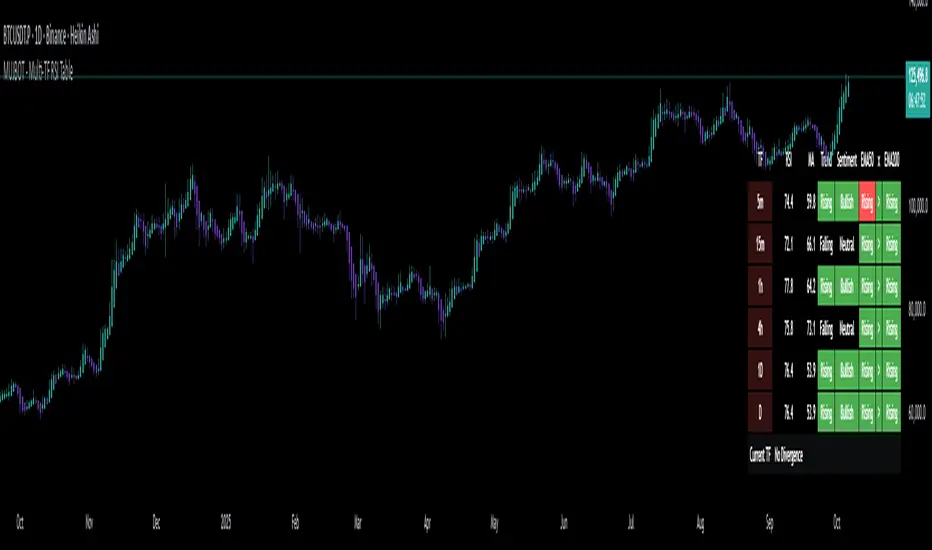
MUJBOT - Multi-TF RSI Table
The "Multi-TF RSI Table" indicator is a comprehensive tool designed to present traders with a quick visual summary of the Relative Strength Index (RSI) across multiple timeframes, all within a single glance. It is crafted for traders who incorporate multi-timeframe analysis into their trading strategy, aiming to enhance decision-making by identifying overall market sentiment and trend direction. Here's a rundown of its features:
User Inputs: The indicator includes customizable inputs for the RSI and Moving Average (MA) lengths, allowing users to tailor the calculations to their specific trading needs. Additionally, there is an option to display or hide the RSI & MA table as well as to position it in various places on the chart for optimal visibility.
Multi-Timeframe RSI & MA Calculations: It fetches RSI and MA values from different timeframes, such as 1 minute (1m), 5 minutes (5m), 15 minutes (15m), 1 hour (1h), 4 hours (4h), and 1 day (1D). This multi-timeframe approach provides a thorough perspective of the momentum and trend across different market phases.
Trend and Sentiment Analysis: For each timeframe, the script determines whether the average RSI is above or below the MA, categorizing the trend as "Rising", "Falling", or "Neutral". Moreover, it infers market sentiment as "Bullish" or "Bearish", based on the relationship between the RSI and its MA.
Dynamic Color-Coding: The indicator uses color-coding to convey information quickly. It highlights the trend and sentiment cells in the table with green for "Bullish" and red for "Bearish" conditions. It also shades the timeframe cells based on the RSI value, with varying intensities of green for "Oversold" conditions and red for "Overbought" conditions, providing an immediate visual cue of extreme market conditions.
Customization and Adaptability: The script is designed with customization in mind, enabling users to adjust the RSI and MA lengths according to their trading strategy. Its adaptable interface, which offers the option to display or hide the RSI & MA table, ensures that the tool fits into different trading setups without cluttering the chart.
Ease of Use: By consolidating critical information into a simple table, the "Multi-TF RSI Table" indicator saves time and simplifies the analysis process for traders. It eliminates the need to switch between multiple charts or timeframes, thus streamlining the trading workflow.
In essence, the "Multi-TF RSI Table" is a powerful indicator for Pine Script users on TradingView, offering a multi-dimensional view of market dynamics. It is ideal for both novice and experienced traders who seek to enhance their technical analysis with an at-a-glance summary of RSI trends and market sentiment across various timeframes.
RSI/MFI Selling Sentiment IndexPsychological Sales Index (Psychological Sales Index)
Fundamental Indicators of Market Sentiment: The Importance of MFI and RSI
The two fundamental indicators that best reflect market sentiment are Money Flow Index (MFI) and Relative Strength Index (RSI). MFI is an indicator of the flow of funds in a market by combining price and volume, which is used to determine whether a stock is over-bought or over-selling. RSI is an indicator of the overheating of the market by measuring the rise and fall of prices, which is applied to the analysis of the relative strength of stock prices. These two indicators allow a quantitative assessment of the market's buying and selling pressure, which provides important information to understand the psychological state of market participants.
Using timing and fundamental metrics
In order to grasp the effective timing of the sale, in-depth consideration was needed on how to use basic indicators. MFI and RSI represent the buying and selling pressures of the market, respectively, but there is a limit to reflecting the overall trend of the market alone. As a result, a study on how to capture more accurate selling points was conducted by comprehensively considering technical analysis along with psychological factors of the market.
The importance of ADX integration and weighting
The "Average Regional Index (ADX)" was missing in the early version. ADX is an indicator of the strength of a trend, and has experienced a problem of less accuracy in selling sentiment indicators, especially in the upward trend. To address this, we incorporated ADX and adopted a method of adjusting the weights of MFI and RSI according to the values of ADX. A high ADX value implies the existence of a strong trend, in which case it is appropriate to reduce the influence of MFI and RSI to give more importance to the strength of the trend. Conversely, a low ADX value increases the influence of MFI and RSI, putting more weight on the psychological elements of the market.
How to use and interpret
The user can adjust several parameters. Key inputs include 'Length', 'Overbought Threshold', 'DI Length', and 'ADX Smoothing'. These parameters are used to set the calculation period, overselling threshold, DI length, and ADX smoothing period of the indicator, respectively. The script calculates the psychological selling index based on MFI, RSI, and ADX. The calculated index is normalized to values between 0 and 100 and is displayed in the graph. Values above 'Overbought Threshold' indicate an overselling state, which can be interpreted as a potential selling signal. This index allows investors to comprehensively evaluate the psychological state of the market and the strength of trends, which can be used to make more accurate selling decisions.

Amazing Oscillator (AO) [Algoalpha]Description:
Introducing the Amazing Oscillator indicator by Algoalpha, a versatile tool designed to help traders identify potential trend shifts and market turning points. This indicator combines the power of the Awesome Oscillator (AO) and the Relative Strength Index (RSI) to create a new indicator that provides valuable insights into market momentum and potential trade opportunities.
Key Features:
Customizable Parameters: The indicator allows you to customize the period of the RSI calculations to fine-tune the indicator's responsiveness.
Visual Clarity: The indicator uses user-defined colors to visually represent upward and downward movements. You can select your preferred colors for both bullish and bearish signals, making it easy to spot potential trade setups.
AO and RSI Integration: The script combines the AO and RSI indicators to provide a comprehensive view of market conditions. The RSI is applied to the AO, which results in a standardized as well as a less noisy version of the Awesome Oscillator. This makes the indicator capable of pointing out overbought or oversold conditions as well as giving fewer false signals
Signal Plots: The indicator plots key levels on the chart, including the RSI threshold(Shifted down by 50) at 30 and -30. These levels are often used by traders to identify potential trend reversal points.
Signal Alerts: For added convenience, the indicator includes "x" markers to signal potential buy (green "x") and sell (red "x") opportunities based on RSI crossovers with the -30 and 30 levels. These alerts can help traders quickly identify potential entry and exit points.

MA RSI @KINGThis Pine Script is designed to create a trading indicator with moving averages (MA) and relative strength index (RSI), along with arrow signals and background color changes based on those signals. Here's a description of its functions:
1. Moving Averages and RSI Calculation:
- Two moving averages (`fastMA` and `slowMA`) are calculated based on user-input lengths.
- The Relative Strength Index (`rsi`) is calculated based on a user-defined length.
2. Crossover Conditions:
- `crossoverUp` is true when the fastMA crosses above the slowMA and RSI is above an overbought level.
- `crossoverDown` is true when the fastMA crosses below the slowMA and RSI is below an oversold level.
3. Arrow Signals:
- Triangle-shaped arrows (`arrowUp` and `arrowDown`) are plotted below and above bars, indicating buy (green) and sell (red) signals, respectively.
4. Background Color Changes:
- The background color (`bgColor`) changes based on buy and sell signals.
- If there's a buy signal (`crossoverUp`), the background color is set to a light blue with 40% transparency.
- If there's a sell signal (`crossoverDown`), the background color is set to a light red with 40% transparency.
- On the next opposite signal, the background color is scaled up (transparency set to 80%) to indicate a stronger signal.
In summary, this script provides visual cues through arrows and background color changes to assist traders in identifying potential buy and sell signals based on moving average crossovers and RSI conditions. The background color variations aim to highlight the strength of the signal, with scaling based on consecutive signals in the same direction.
********************************************************************************
1. Buy Signal:
- Condition: The arrow points up (green) with a background color indicating a buy signal.
- Confirmation: Ensure that there is a strong upward crossover (fastMA above slowMA) and RSI is above the overbought level.
2. Sell Signal:
- Condition: The arrow points down (red) with a background color indicating a sell signal.
- Confirmation: Ensure that there is a strong downward crossover (fastMA below slowMA) and RSI is below the oversold level.
3. Exit Signal:
- Condition: No arrow is present, and the background color is reset.
- Confirmation: Confirm that there is no active buy or sell signal.
Example Trading Rules:
Opening a Long Position (Buy):
- Enter a long (buy) position when:
- The green arrow appears with a light blue background.
- Confirm that the fastMA is above the slowMA.
- Confirm that RSI is above the overbought level.
Opening a Short Position (Sell):
- Enter a short (sell) position when:
- The red arrow appears with a light red background.
- Confirm that the fastMA is below the slowMA.
- Confirm that RSI is below the oversold level.
Exiting a Position:
- Close the position when:
- There is no arrow present (neither green nor red).
- The background color is reset, indicating no active signal.
Risk Management:
Position Sizing: Determine the size of your positions based on your risk tolerance and the size of your trading account.
Stop-Loss and Take-Profit: Set stop-loss orders to limit potential losses and take-profit orders to secure profits.
Risk-Reward Ratio: Consider maintaining a favorable risk-reward ratio in your trades.
Notes:
Backtesting: Before applying this strategy in a live market, it's crucial to backtest it using historical data to assess its performance.
Market Conditions: Adapt the strategy to different market conditions, and be aware that no strategy is guaranteed to be profitable.
Continuous Monitoring: Regularly monitor the performance of the strategy and make adjustments as needed.
Educational Purpose: This strategy is for educational purposes only. Always consult with financial professionals and use your judgment when making trading decisions.
Remember that trading involves risk, and past performance is not indicative of future results. It's recommended to paper trade or use a demo account to test the strategy before risking real capital.
Best wishes on your trading journey! May your strategies be profitable, your risks well-managed, and your decisions guided by wisdom and success. Happy trading!