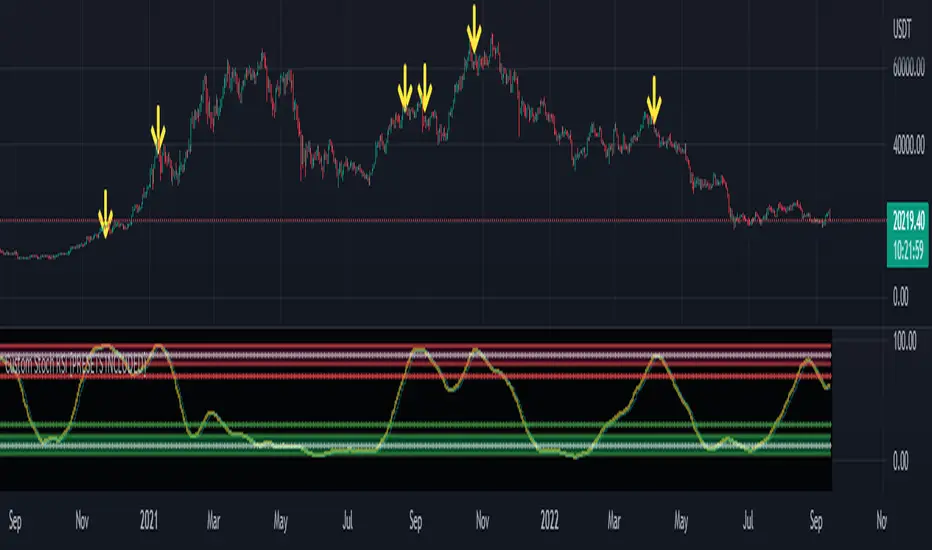
Trend System Oscillator Averages RatingThis is a trend system made with multiple oscillator averages designed especially for trending markets such as stocks or crypto.
It can be used with any timeframe.
Its made of multiple moving oscillators such as
RSI
Stochastic
ADX
CCI
AO
MACD
MOM
STOCH RSI
WPR
BP
UO
Avg of all oscillators
It has also a rating, making an avg from all of the oscillators , going from -100 (all ma's are telling to go short ) to 100 ( all ma are telling to go long).
If you have any questions let me know !
Cerca negli script per "STOCH RSI"

[KBCUSTOM] Histogramified Stochastic RSI The public and regular stoch RSI does not come with a histogram which makes it hard to tell the magnitude of any cross. This version comes with one enabled by default and with includes buy and sell triggers on specified crosses.
Buy & Sell Options:
KB Cross Factor: this is the minimum stochastic change between candles that needs to be exceeded in order to trigger a buy or sell signal. For instance, if the previous candle has a value of -20, and the next one has 10, then the factor should be 30 in order for it to trigger a signal.
KB Cross Threshold: in order to minimize bad signals due to weak trend, you can set the minimum stochastic value any candle should have for an order signal to trigger. For instance, say the stochastic has a good cross factor (i.e. 30) and is met, and the stochastic has a value of 10 but your cross threshold is set at 20, then the signal will not trigger unless it is actually 20 or higher.
Let me know how it works.
Cheers.

Momentum Strategy (BTC/USDT; 30m) - STOCH RSI (with source code)Here's a strategy for low time frames (30min suggested) for BTC , based on momentum Analysis using Stochastic RSI
By default the strategy will use the 50% of the specified capital for each trade; if "Gamble Sizing" is enabled, it will add the specified amount of capital (25% by default, until reaching the 100% limit or lower) for the next trade after having detected a loss in the previous trade; if the next trade is successful, the size for the next trade comes back to 50%
• Trend Filter LONG: If the fast exponential moving average is UNDER the slow exponential moving average , it won't open LONG positions
• Trend Filter SHORT: If the fast exponential moving average is ABOVE the slow exponential moving average , it won't open SHORT positions
• Bars delay: the strategy will wait the specified amount of bars before closing the current position; the counter is triggered as soon as the closing trade condition is verified
BY MAKING USE OF THIS STRATEGY, YOU ACKNOWLEDGE AND AGREE THAT: (1) YOU ARE AWARE OF THE RISKS ASSOCIATED WITH TRANSACTIONS OF DIGITAL CURRENCIES AND THEIR DERIVATIVES; (2) YOU SHALL ASSUME ALL RISKS RELATED TO THE USE OF THIS STRATEGY AND TRANSACTIONS OF DIGITAL CURRENCIES AND THEIR DERIVATIVES; AND (3) I SHALL NOT BE LIABLE FOR ANY SUCH RISKS OR ADVERSE OUTCOMES.
SOURCE CODE BELOW

Evan Cabral's Quarter Theory by MrTuanDoanThis indicator is based on Evan Cabral's Market Timing Strategy.
In Binary Option or High Frequency Forex (HFX), it's very common to see the market make reversals at hours and half hours.
This indicator just simply draw vertical lines at each quarter of the hour.
You should change the color and opacity to fit your chart style.
With this indicator, you're going to know when to positions yourself with more accuracy on trade setups.
Note
It works best if you take your reversal trade at the top of the hour using your other (overbought/oversold) confirmation using RSI, Stoch RSI, DMI, etc.
It works better if you take your trade at resistance/support zones
You should pay attention to the direction the market is going before the hour (or half hour) and looking at how the direction changes going into the hour or after it.
Please backtest before taking real trades

MTF Stoch RSI ScreenerDisplays when multiple timeframes of Stochastic RSI are overbought/oversold. Multiple consecutive timeframes being overbought/oversold can signify a short term top or bottom.
Thanks to Micse in Pinescripters telegram who helped remove a few errors from this.

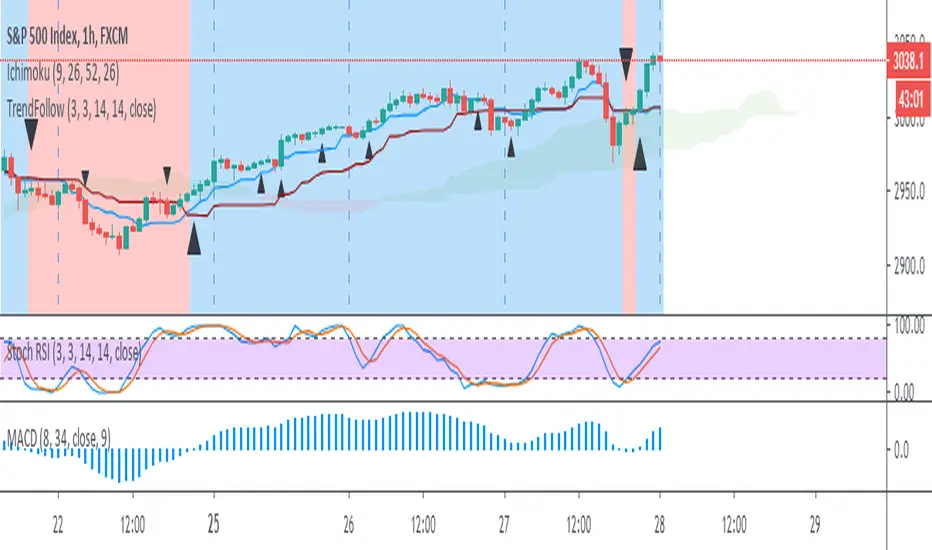
Trend Follow with 8/34 EMA and Stoch RSI for 1 Hour SPX
The script determines and plots entry points for 1 hour S&P index using 8/34 emas and stochastic RSI. When 8 ema above/below 34 ema up/down crosses of stochastic RSI are considered as long/short entries. Entry prices should be above/below high/low of the signal bars accordingly. Ichimoku cloud can be used as extra filtering.
Technical Analysis - Panel Info//A. Oscillators & B. Moving Averages base on TradingView's Technical Analysis by ThiagoSchmitz
//C.Pivot base on Ultimate Pivot Points Alerts by elbartt
//D. Summary & Panel info by anhnguyen14
Panel Info base on these indicators:
A. Oscillators
1. Rsi (14)
2. Stochastic (14,3,3)
3. CCI (20)
4. ADX (14)
5. AO
6. Momentum (10)
7. MACD (12,26)
8. Stoch RSI (3,3,14,14)
9. %R (14)
10. Bull bear
11. UO (7,14,28)
B. Moving Averages
1. SMA & EMA: 5-10-20-30-50-100-200
2. Ichimoku Cloud - Baseline (26)
3. Hull MA (9)
C. Pivot
1. Traditional
2. Fibonacci
3. Woodie
4. Camarilla
D. Summary
Sum_red=A_red+B_red+C_red
Sum_blue=A_blue+B_blue+C_blue
sell_point=(Sum_red/32)*100
buy_point=(Sum_blue/32)*100
sell =
Sum_red>Sum_blue
and sell_point>50
Strong_sell =
A_red>A_blue
and B_red>B_blue
and C_red>C_blue
and sell_point>50
and not crossunder(sell_point,75)
buy =
Sum_red>Sum_blue
and buy_point>50
Strong_buy =
A_red50
and not crossunder(buy_point,75)
neutral = not sell and not Strong_sell and not buy and not Strong_buy


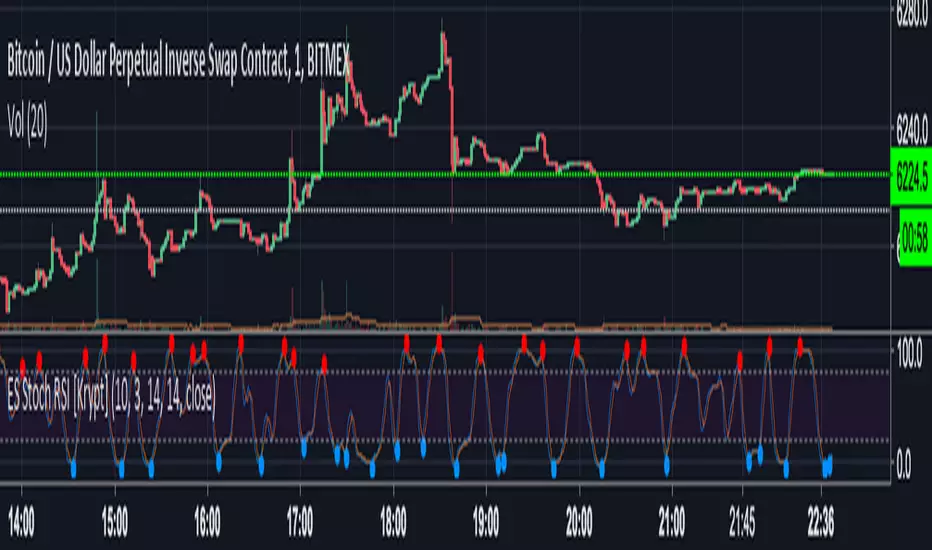
Ehlers-Smoothed Stochastic RSI StrategyI have been asked by several people for a Strategy based on the ES Stoch RSI Alert so here it is. The strategy has an adjustable backtest date range so that you can adjust the test time period to whatever you like. This strategy is based on a script by fskrypt.

Ehlers-Smoothed Stochastic RSI AlertES Stoch RSI Alert for use with AutoView using script by fskrypt.
Sell Alert <=20.0
Buy Alert >=80.0
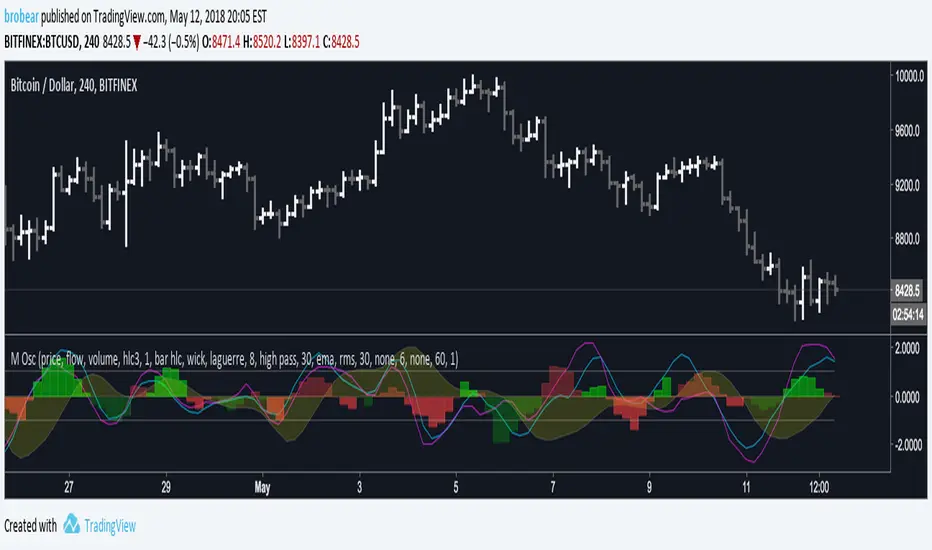
Multi OscillatorAn oscillator toolbox. Highly configurable.
Three oscillators can be selected to show the momentum of:
price
flow -> the change in price
volume
money -> (volume * flow)
See the comments at the beginning of the script for a complete description.
--------------------------------
As my interest in oscillators increased, I was baffled by the vast jungle of available options. Over time, I did my best to distill the essence of what each indicator offered: RSI, Stoch RSI, CMF, OBV, MFI, MACD, VPT, Accum/Dist Index, Ehler's roofing...
Standing on the shoulders of giants, this indicator is a humble re-synthesis of all these indicators. The "value add" is in the organization, which facilitates the cohesive processing of different oscillators in one plot.
In this script, an oscillator is composed in stages:
Construct signal -> Remove noise -> Compose Oscillation -> Normalize -> Smooth -> Shape
where each stage is configurable.
There is a lot of flexibility, but once defined, each source (price, flow, volume, money) is constructed in the same way. This facilitates a degree of cohesion that is hard for my brain to render otherwise.
While I find the default settings valuable in my trading, there are so many ways to experiment. Find out what works for you! Share comments of new configurations... as we all learn!
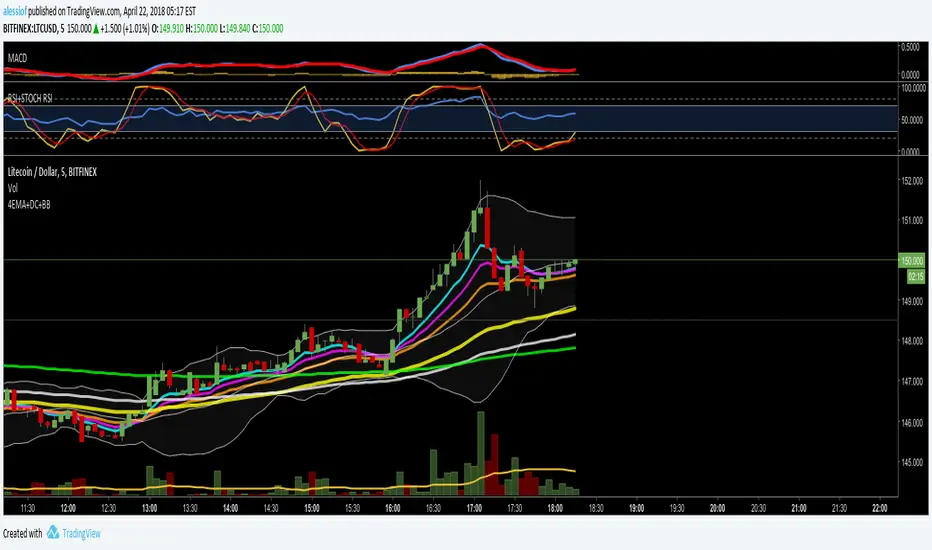
4EMA (8,13,21,55) + Bollinger BandsFive indicators in one.
4 Moving Average Exponential : 8, 13, 21, 55 - as per @Philakone strategy
Bollinger Bands
Check out my other scripts for RSI and Stoch RSI all in one, and 4EMA + Death Cross + Bollinger Bands.

4EMA (8,13,21,55) + Death Cross (100,200) + Bollinger BandsUnited three indicators in one.
4 Moving Average Exponential: 8, 13, 21, 55 - as per @Philakone strategy
Moving Average Exponential - Death Cross: 100, 200
Bollinger Bands
Check out my other script for RSI and Stoch RSI all in one.

Bats Bearish Divergence Detector (BRED-)After the release of BUBD+ here comes BRED- for calling the tops.
6 indicators are tested for the presence of any bearish Divergences and are plotted on chart as soon as they are.
Note - Price can move up after bearish divergence as well so its not foolproof. However multiple bearish divergences signify that bulls are losing power and price might reverse downwards.
Instead of blindly trusting the divergence on this indicator I suggest that you use this as a tracking mechanism instead. Once you spot a bearish divergence here, go to the oscillator that was called by the indicator and see the strength of the divergence involved.
This way you dont have to look at the indicators for divergence all the time, just only when the indicator calls for it. (Note that different timeframes will have different divergences so make sure you watch most of them. Higher timeframes indicate larger potential reversals)
Colour -
MACD- Aqua blue
RSI - Red
Stoch RSI - pink
CCI - Orange
MFI - Teal (Blue)
RVI - Silver
If you want to change the number of indicators you can do so from the bottom and remove the indicators you dont want to see by commenting them out.

Customisable Stoch RSI [10 PRESETS INCLUDED]Customisable Stochastic by Nicholas Kormanik
A stochastic oscillator is a momentum indicator comparing a particular closing price of a security to a range of its prices over a certain period of time.
The sensitivity of the oscillator to market movements is reducible by adjusting that time period or by taking a moving average of the result.
It is used to generate overbought and oversold trading signals, utilizing a 0–100 bounded range of values.
In this version we have 4 levels
top levels are
95 - extra overbought
80 - semi-extra overbought
70 - standart overbought
bottom levels are
5 - extra oversold
20 - semi-extra oversold
30 - standart oversold
Message by Nicholas Kormanik :
" The formula I've adopted was put on the Silicon Investor web site thread by
'bdog'. Basically, I just leave the Slowing Periods (mp3) to 1, so it
really plays no part in things. However, if somebody presents a good
argument for using other than 1 ... hey, I'm amenable.
Chande, the original inventor, didn't use a moving average on the whole
thing. Chande's result was therefore sort of choppy. I guess along the way
people decided to add the EMA Periods to smooth things out. "
There are 10 presets, try to find your best!
1. 5 -- 5 -- 3
2. 8 -- 8 -- 5
3. 13 -- 13 -- 13
4. 21 -- 15 -- 13
5. 21 -- 21 -- 13
6. 34 -- 34 -- 13
7. 55 -- 55 -- 21
8. 89 -- 13 -- 34
9. 89 -- 89 -- 21
10. 233 -- 233 -- 34
On the chart im using 9th preset and the timeframe is daily on BTCUSD pair.
*DISCLAIMER*
Use this indicator for educational purpose only, i don't recommend you to use it to trade for real money!
Nasdaq DowJones STOCH+RSIAlternative & UPDATED version of my previous indicator for spread trading.
This indicator can work pretty well also with other indices or correlated assets such as nasdaq100 and dax40.
The spikes from one side of the channel or the orizzontal lines signal a possible entry signal for a spread trading strategy.

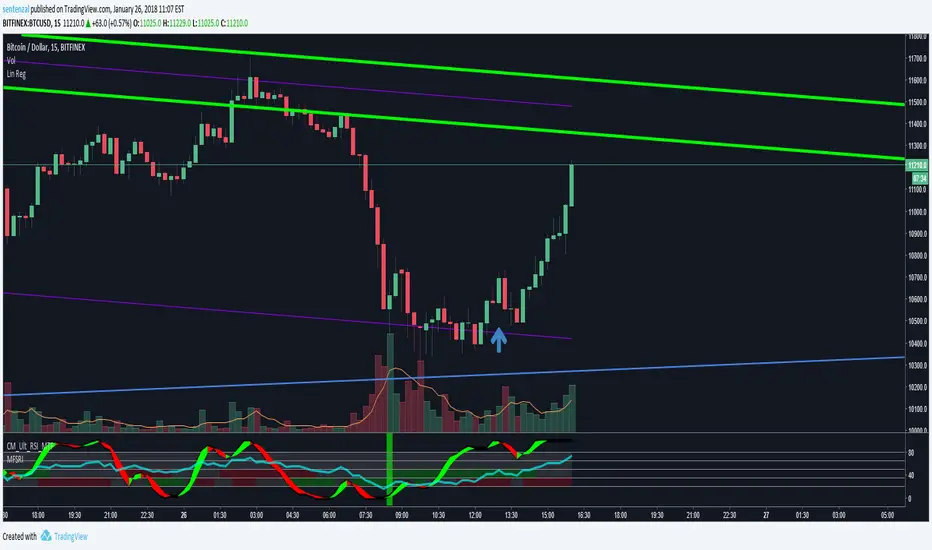
EmperorBTC's VWAP StrategyEmperorBTC's VWAP Indicator & Strategy
v2.1
coded by Bogdan Vaida
This indicator was created after EmperorBTC's conditions.
Good timeframes for it: 30', 15', 5'
To convert from strategy to study switch the commented lines in the beginning
and at the end of the script and vice versa.
What this indicator does is to check if:
o Pivot Point was crossed
o Stoch-RSI and VWAP were crossed in current or previous candle
o Candle (or previous candle) close is in the trend direction
If all these are true then it will go long or short based on direction.

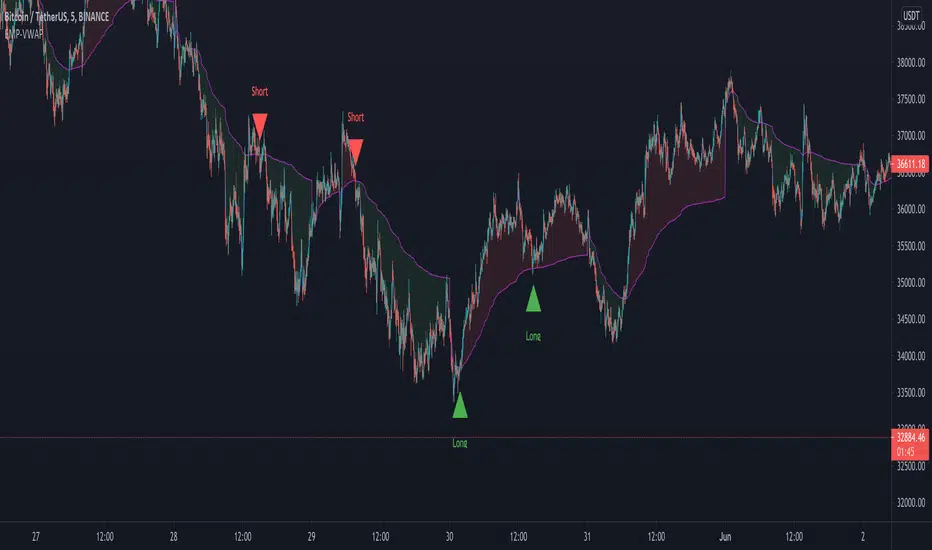
EmperorBTC's VWAP IndicatorThis indicator was created after EmperorBTC's conditions. Conditions displayed below:
Good timeframes for it: 30', 15', 5'
To convert from strategy to study switch the commented lines in the beginning and at the end of the script
What this indicator does is:
1) Check if Pivot Point was crossed
2) Stoch-RSI and VWAP were crossed up in current or previous candle
3) Candle (or previous candle) is green
Then, it will plot a Long opportunity.
FUTURE IDEAS:
- Volume Expansion
- Candle Stick patterns
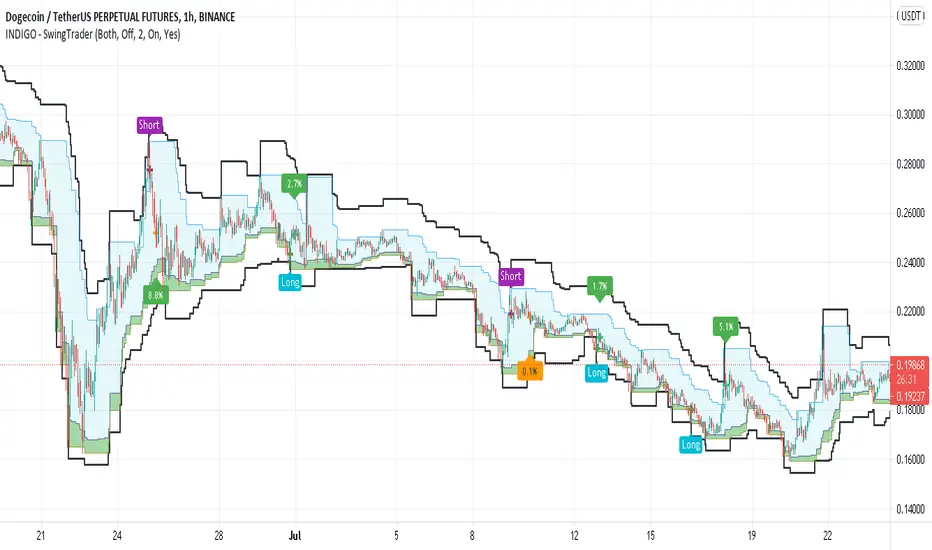
INDIGO - SwingTraderThis is a script that uses a couple of other indicators to find good swing trade entry's and exit's. You can choose which signals the script uses to calculate the position of the signals.
It uses the following:
- Stoch RSI
- MACD
- POC
- INDIGO Cloud
Also added are volume candles, acceleration of momentum indicators (triangle) and MACD candles. This way you can see more info to decide if the entry is valid.
I have used a couple of public scripts and tried to give credit to the original creators. If there is any script that hasn't been credited, please contact me.
Feedback is very much appreciated, positive and negative. Also If you have any question, feel free to ask me. I'll try to answer asap.
Enjoy the script :)

GLANTALL AT A DEEP GLANCE
Monitor the whole market at a glance
Give your analysis double-dimensional depth
With the help of this assistant , you can quickly aware about the various dimensions of the market and improve the quality of your trading experience.
Everything is clear in the picture so I will avoid further explanation.
All functions are controllable and highly customizable
Get instantly and accurate report of
Volume
Volume changes
Volume is higher or lower than average
Volume significant increase
2 oscillators of your choice, each one at 4 time frame of your choice, at the same time (Stoch, RSI, StochRSI, MFI, StochMFI)
Selected oscillators changes and direction
Selected oscillators divergences with full coordinate
Bollinger bands
Bollinger bands middle line changes
Bollinger bands width changes and direction
Amount of volatility
4 moving averages as type as your choice at a same time (SMA, EMA, WMA, HMA)
Mark up the moving averages as dynamic support or resistance
Crosses of the 4 averages as type as your choice at a same time (SMA, EMA, WMA, HMA) (completely separately than above mentined MAs) with full coordinate
More than 500 line code.. but Clean and Clear !
Gifts to all of you dear ones.
