Machine Learning: Optimal RSI [YinYangAlgorithms]This Indicator, will rate multiple different lengths of RSIs to determine which RSI to RSI MA cross produced the highest profit within the lookback span. This ‘Optimal RSI’ is then passed back, and if toggled will then be thrown into a Machine Learning calculation. You have the option to Filter RSI and RSI MA’s within the Machine Learning calculation. What this does is, only other Optimal RSI’s which are in the same bullish or bearish direction (is the RSI above or below the RSI MA) will be added to the calculation.
You can either (by default) use a Simple Average; which is essentially just a Mean of all the Optimal RSI’s with a length of Machine Learning. Or, you can opt to use a k-Nearest Neighbour (KNN) calculation which takes a Fast and Slow Speed. We essentially turn the Optimal RSI into a MA with different lengths and then compare the distance between the two within our KNN Function.
RSI may very well be one of the most used Indicators for identifying crucial Overbought and Oversold locations. Not only that but when it crosses its Moving Average (MA) line it may also indicate good locations to Buy and Sell. Many traders simply use the RSI with the standard length (14), however, does that mean this is the best length?
By using the length of the top performing RSI and then applying some Machine Learning logic to it, we hope to create what may be a more accurate, smooth, optimal, RSI.
Tutorial:
This is a pretty zoomed out Perspective of what the Indicator looks like with its default settings (except with Bollinger Bands and Signals disabled). If you look at the Tables above, you’ll notice, currently the Top Performing RSI Length is 13 with an Optimal Profit % of: 1.00054973. On its default settings, what it does is Scan X amount of RSI Lengths and checks for when the RSI and RSI MA cross each other. It then records the profitability of each cross to identify which length produced the overall highest crossing profitability. Whichever length produces the highest profit is then the RSI length that is used in the plots, until another length takes its place. This may result in what we deem to be the ‘Optimal RSI’ as it is an adaptive RSI which changes based on performance.
In our next example, we changed the ‘Optimal RSI Type’ from ‘All Crossings’ to ‘Extremity Crossings’. If you compare the last two examples to each other, you’ll notice some similarities, but overall they’re quite different. The reason why is, the Optimal RSI is calculated differently. When using ‘All Crossings’ everytime the RSI and RSI MA cross, we evaluate it for profit (short and long). However, with ‘Extremity Crossings’, we only evaluate it when the RSI crosses over the RSI MA and RSI <= 40 or RSI crosses under the RSI MA and RSI >= 60. We conclude the crossing when it crosses back on its opposite of the extremity, and that is how it finds its Optimal RSI.
The way we determine the Optimal RSI is crucial to calculating which length is currently optimal.
In this next example we have zoomed in a bit, and have the full default settings on. Now we have signals (which you can set alerts for), for when the RSI and RSI MA cross (green is bullish and red is bearish). We also have our Optimal RSI Bollinger Bands enabled here too. These bands allow you to see where there may be Support and Resistance within the RSI at levels that aren’t static; such as 30 and 70. The length the RSI Bollinger Bands use is the Optimal RSI Length, allowing it to likewise change in correlation to the Optimal RSI.
In the example above, we’ve zoomed out as far as the Optimal RSI Bollinger Bands go. You’ll notice, the Bollinger Bands may act as Support and Resistance locations within and outside of the RSI Mid zone (30-70). In the next example we will highlight these areas so they may be easier to see.
Circled above, you may see how many times the Optimal RSI faced Support and Resistance locations on the Bollinger Bands. These Bollinger Bands may give a second location for Support and Resistance. The key Support and Resistance may still be the 30/50/70, however the Bollinger Bands allows us to have a more adaptive, moving form of Support and Resistance. This helps to show where it may ‘bounce’ if it surpasses any of the static levels (30/50/70).
Due to the fact that this Indicator may take a long time to execute and it can throw errors for such, we have added a Setting called: Adjust Optimal RSI Lookback and RSI Count. This settings will automatically modify the Optimal RSI Lookback Length and the RSI Count based on the Time Frame you are on and the Bar Indexes that are within. For instance, if we switch to the 1 Hour Time Frame, it will adjust the length from 200->90 and RSI Count from 30->20. If this wasn’t adjusted, the Indicator would Timeout.
You may however, change the Setting ‘Adjust Optimal RSI Lookback and RSI Count’ to ‘Manual’ from ‘Auto’. This will give you control over the ‘Optimal RSI Lookback Length’ and ‘RSI Count’ within the Settings. Please note, it will likely take some “fine tuning” to find working settings without the Indicator timing out, but there are definitely times you can find better settings than our ‘Auto’ will create; especially on higher Time Frames. The Minimum our ‘Auto’ will create is:
Optimal RSI Lookback Length: 90
RSI Count: 20
The Maximum it will create is:
Optimal RSI Lookback Length: 200
RSI Count: 30
If there isn’t much bar index history, for instance, if you’re on the 1 Day and the pair is BTC/USDT you’ll get < 4000 Bar Indexes worth of data. For this reason it is possible to manually increase the settings to say:
Optimal RSI Lookback Length: 500
RSI Count: 50
But, please note, if you make it too high, it may also lead to inaccuracies.
We will conclude our Tutorial here, hopefully this has given you some insight as to how calculating our Optimal RSI and then using it within Machine Learning may create a more adaptive RSI.
Settings:
Optimal RSI:
Show Crossing Signals: Display signals where the RSI and RSI Cross.
Show Tables: Display Information Tables to show information like, Optimal RSI Length, Best Profit, New Optimal RSI Lookback Length and New RSI Count.
Show Bollinger Bands: Show RSI Bollinger Bands. These bands work like the TDI Indicator, except its length changes as it uses the current RSI Optimal Length.
Optimal RSI Type: This is how we calculate our Optimal RSI. Do we use all RSI and RSI MA Crossings or just when it crosses within the Extremities.
Adjust Optimal RSI Lookback and RSI Count: Auto means the script will automatically adjust the Optimal RSI Lookback Length and RSI Count based on the current Time Frame and Bar Index's on chart. This will attempt to stop the script from 'Taking too long to Execute'. Manual means you have full control of the Optimal RSI Lookback Length and RSI Count.
Optimal RSI Lookback Length: How far back are we looking to see which RSI length is optimal? Please note the more bars the lower this needs to be. For instance with BTC/USDT you can use 500 here on 1D but only 200 for 15 Minutes; otherwise it will timeout.
RSI Count: How many lengths are we checking? For instance, if our 'RSI Minimum Length' is 4 and this is 30, the valid RSI lengths we check is 4-34.
RSI Minimum Length: What is the RSI length we start our scans at? We are capped with RSI Count otherwise it will cause the Indicator to timeout, so we don't want to waste any processing power on irrelevant lengths.
RSI MA Length: What length are we using to calculate the optimal RSI cross' and likewise plot our RSI MA with?
Extremity Crossings RSI Backup Length: When there is no Optimal RSI (if using Extremity Crossings), which RSI should we use instead?
Machine Learning:
Use Rational Quadratics: Rationalizing our Close may be beneficial for usage within ML calculations.
Filter RSI and RSI MA: Should we filter the RSI's before usage in ML calculations? Essentially should we only use RSI data that are of the same type as our Optimal RSI? For instance if our Optimal RSI is Bullish (RSI > RSI MA), should we only use ML RSI's that are likewise bullish?
Machine Learning Type: Are we using a Simple ML Average, KNN Mean Average, KNN Exponential Average or None?
KNN Distance Type: We need to check if distance is within the KNN Min/Max distance, which distance checks are we using.
Machine Learning Length: How far back is our Machine Learning going to keep data for.
k-Nearest Neighbour (KNN) Length: How many k-Nearest Neighbours will we account for?
Fast ML Data Length: What is our Fast ML Length? This is used with our Slow Length to create our KNN Distance.
Slow ML Data Length: What is our Slow ML Length? This is used with our Fast Length to create our KNN Distance.
If you have any questions, comments, ideas or concerns please don't hesitate to contact us.
HAPPY TRADING!
Cerca negli script per "TDI"

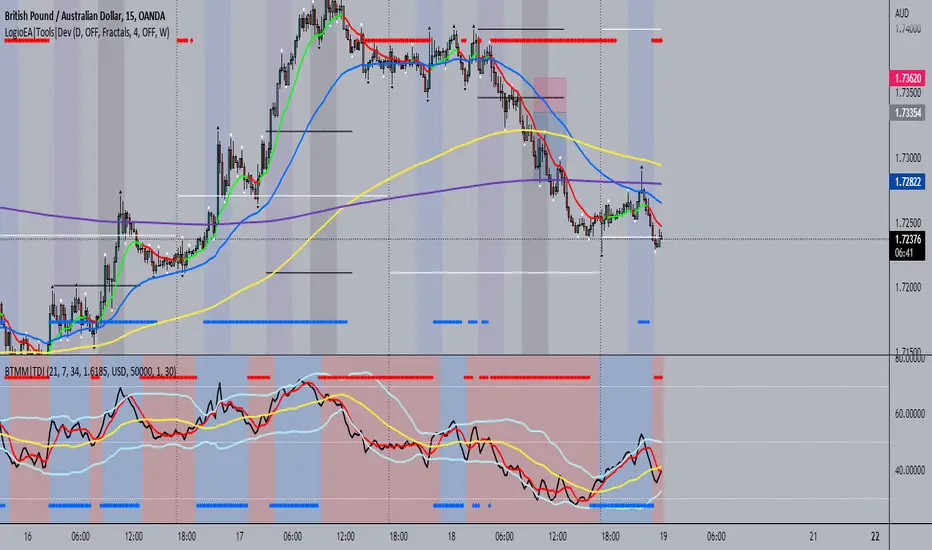
BTMM|TDIThis is the trader's dynamic index inspired by Steve Mauro's BTMM strategy.
In addition to the RSI, Trendline, Baseline, Volatility Bands I have also included additional trend biases that are painted in the background to provide more confluence when the markets break out in either direction.
For convenience, a position size calculator is included for all users to quickly calculate lot sizes on forex pairs with difference account balance currencies. The calculator works accurately on forex pairs. DO NOT USE for crypto or indices as some brokers have unique contract sizes that could not be fully incorporated into the tool.
There is also data table that displays historical values of the RSI, Trendline, Baseline, and an EMA vs Price scoring procedure that covers the current candle (t0) and up to 3 candles back. The table is meant to provide a snapshot view of either bullish or bearish dominance that can be deciphered with a quick glance.
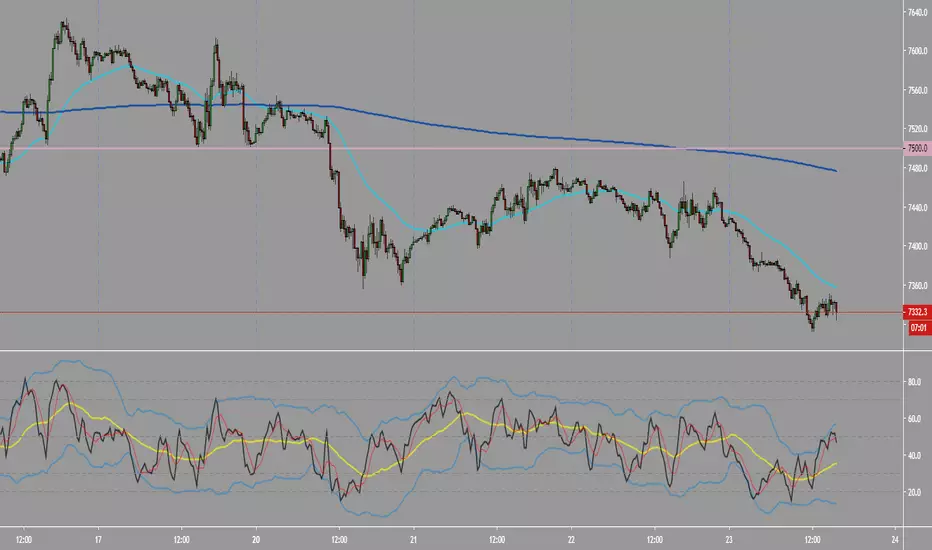
Delorean TDI - Traders Dynamic IndexTraders Dynamic Index (for the Delorean Strategy)
===============================================================
This indicator helps to decipher and monitor market conditions related to trend direction, market strength, and market volatility.
TDI has the following components:
* Green line = RSI Price line
* Red line = Trade Signal line
* Blue lines = Volatility Bands
* Yellow line = Market Base Line
Trend Direction - Immediate and Overall:
----------------------------------------------------
* Yellow line trends up and down generally between the lines 32 & 68. Watch for Yellow line to bounces off these lines for market reversal. Trade long when price is above the Yellow line, and trade short when price is below.
Market Strength & Volatility - Immediate and Overall:
----------------------------------------------------
* Immediate = Green Line -> Strong = Steep slope up or down.
* Immediate = Green Line -> Weak = Moderate to Flat slope.
* Overall = Blue Lines -> When expanding, market is strong and trending.
* Overall = Blue Lines -> When constricting, market is weak and in a range.
* Overall = Blue Lines -> When the Blue lines are extremely tight in a narrow range, expect an economic announcement or other market condition to spike the market.
Note Credit: LazyBear - altered for the Delorean Strategy


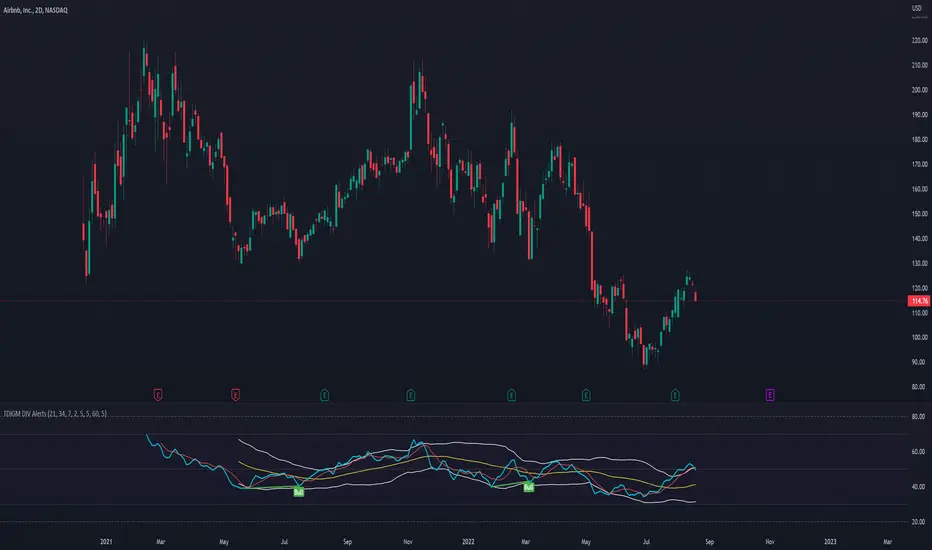
TDI - Traders Dynamic Index [Goldminds] with DIV RSI AlertsOriginally from Goldminds. Later modified by Jakub a Babo. I just added RSI DIV alerts. You're welcome. :)
Instruction: once you have have this indicator and press Alt + A to create alert.
TDI RespiroTradingEsta es la Estrategia Millonaria con el oro , si deseas saber como usar la estrategia correctamente puedes contactame en mis redes sociales como respirotrading o camilorespiro. Mentoria online profesional. Puedes usarla en cualquier momento y es muy efectiva.


Advanced Session Profile Predictor with SR Boxes & ORAdvanced Session Profile Predictor with Momentum Arrows
Designed for intraday traders, this indicator analyzes price action across Asia, London, and New York sessions to predict market profiles and highlight key trading opportunities. By combining session-based profiling, Opening Range (OR) visualization, and momentum signals from Traders Dynamic Index (TDI), it offers a unique tool for anticipating trends, reversals, and breakouts. Ideal for forex, indices, and crypto on 15M–1H charts.
What Makes This Indicator Unique?
Unlike typical session indicators that only mark time zones or standard TDI scripts that focus on momentum, this tool:
Predicts market profiles (e.g., "Trend Continuation," "NY Manipulation") by analyzing session ranges and directional moves, offering actionable insights into how sessions interact.
Visualizes Opening Range (OR) boxes for the first 15 minutes of each session, helping traders spot early breakout levels.
Integrates TDI with momentum to generate precise bullish/bearish arrows, filtered by session context for improved reliability.
Simplifies decision-making with dynamic profile labels showing real-time long/short conditions based on price levels.
How Does It Work?
Session Tracking:
Asia (00:00–08:00 UTC, yellow), London (08:00–16:00 UTC, red), and New York (13:00–21:00 UTC, blue) sessions are highlighted with background colors and high/low lines (crosses).
OR boxes (first 15 minutes) are drawn for each session: yellow for Asia, red for London, blue for NY.
Profile Prediction:
Compares Asia and London session ranges and directions (e.g., trending if range > 1.5x 5-period SMA).
Examples:
Trend Continuation: Asia and London trend in the same direction—long above Asia high (uptrend) or short below Asia low (downtrend).
NY Manipulation: Asia trends, London consolidates—watch for NY breakouts at London high/low.
Displays the predicted profile and entry conditions in labels (e.g., "IF price hits 1.2000 LONG").
Momentum Arrows:
Uses TDI (RSI period 21, bands 34, fast MA 2) and 12-period momentum.
Green up arrow: Fast MA > upper band (>68) and momentum rising (bullish).
Red down arrow: Fast MA < lower band (<32) and momentum falling (bearish).
Support/Resistance (SR):
Plots dynamic SR boxes based on pivot highs/lows, filtered by volume (inspired by ChartPrime’s methodology, credited below).
How to Use It
Setup: Apply to a 15M–1H chart. Adjust time zone (default: UTC) and session times if needed. Customize TDI/momentum settings for sensitivity.
Trading:
Check the top-right labels for the current profile and entry conditions (e.g., "IF price hits LONG/SHORT").
Confirm entries with green up arrows (bullish) or red down arrows (bearish).
Use OR boxes and session high/low lines to identify breakout or reversal levels.
Example: In "NY Manipulation," wait for price to hit London high (long) or low (short) during NY session, confirmed by an arrow.
Best Markets: Forex (EUR/USD), indices (SPX500), crypto (BTC/USD) with sufficient intraday volatility.
Underlying Concepts
Session Profiling: Detects trends (range > SMA * threshold) and manipulation (e.g., London breaking Asia’s high/low) to predict NY behavior.
OR Boxes: Marks the first 15 minutes’ high/low as a breakout zone (time-based, 900,000 ms).
TDI + Momentum: Combines RSI-based bands with price change (close – close ) for momentum signals.
SR Boxes: Identifies pivots over a lookback period (default 20), scaled by ATR and filtered by volume thresholds.
Credits
The SR box logic is inspired by ChartPrime’s volume-filtered support/resistance methodology, adapted with custom breakout/hold detection. Original authors are credited for their foundational work.
Chart Setup
Displays session backgrounds, OR boxes, high/low lines, TDI arrows, and profile labels. Keep other indicators off for clarity.

Indicators: Traders Dynamic Index, HLCTrends and Trix Ribbon1) Trix Ribbon
===============================================================
This was built on request. Many Stock/FX traders overlay multiple Trix lines to form the ribbon, this indicator makes it easy.
Also, optionally this can plot a BollingerBand on Trix_1.
More info on Trix:
stockcharts.com
2) High/Low/Close Trend Indicator
===============================================================
Simple indicator using EMAs of H/L/C. If blue line is above the red line, the trend is up, else down. Keep an eye on the zero line too.
3) Traders Dynamic Index
===============================================================
This hybrid indicator helps to decipher and monitor market conditions related to trend direction, market strength, and market volatility.
TDI has the following components:
* Green line = RSI Price line
* Red line = Trade Signal line
* Blue lines = Volatility Bands
* Orange line = Market Base Line
Trend Direction - Immediate and Overall:
----------------------------------------------------
* Immediate = Green over Red...price action is moving up.
Red over Green...price action is moving down.
* Overall = Orange line trends up and down generally between the lines 32 & 68. Watch for Orange line to bounces off these lines for market reversal. Trade long when price is above the Orange line, and trade short when price is below.
Market Strength & Volatility - Immediate and Overall:
----------------------------------------------------
* Immediate = Green Line - Strong = Steep slope up or down.
Weak = Moderate to Flat slope.
* Overall = Blue Lines - When expanding, market is strong and trending. When constricting, market is weak and in a range. When the Blue lines are extremely tight in a narrow range, expect an economic announcement or other market condition to spike the market.
Entry conditions:
----------------------------------------------------
* Scalping - Long = Green over Red,
Short = Red over Green
* Active - Long = Green over Red & Orange lines
Short = Red over Green & Orange lines
* Moderate - Long = Green over Red, Orange, & 50 lines
Short= Red over Green, Green below Orange & 50 line
Exit conditions:
----------------------------------------------------
If Green crosses either Blue lines, consider exiting when the Green line crosses back over the Blue line.
* Long = Green crosses below Red
* Short = Green crosses above Red
More info on a complete system using TDI:
www.forexmt4.com

Musashi_Fractal_Dimension === Musashi-Fractal-Dimension ===
This tool is part of my research on the fractal nature of the markets and understanding the relation between fractal dimension and chaos theory.
To take full advantage of this indicator, you need to incorporate some principles and concepts:
- Traditional Technical Analysis is linear and Euclidean, which makes very difficult its modeling.
- Linear techniques cannot quantify non-linear behavior
- Is it possible to measure accurately a wave or the surface of a mountain with a simple ruler?
- Fractals quantify what Euclidean Geometry can’t, they measure chaos, as they identify order in apparent randomness.
- Remember: Chaos is order disguised as randomness.
- Chaos is the study of unstable aperiodic behavior in deterministic non-linear dynamic systems
- Order and randomness can coexist, allowing predictability.
- There is a reason why Fractal Dimension was invented, we had no way of measuring fractal-based structures.
- Benoit Mandelbrot used to explain it by asking: How do we measure the coast of Great Britain?
- An easy way of getting the need of a dimension in between is looking at the Koch snowflake.
- Market prices tend to seek natural levels of ranges of balance. These levels can be described as attractors and are determinant.
Fractal Dimension Index ('FDI')
Determines the persistence or anti-persistence of a market.
- A persistent market follows a market trend. An anti-persistent market results in substantial volatility around the trend (with a low r2), and is more vulnerable to price reversals
- An easy way to see this is to think that fractal dimension measures what is in between mainstream dimensions. These are:
- One dimension: a line
- Two dimensions: a square
- Three dimensions: a cube.
--> This will hint you that at certain moment, if the market has a Fractal Dimension of 1.25 (which is low), the market is behaving more “line-like”, while if the market has a high Fractal Dimension, it could be interpreted as “square-like”.
- 'FDI' is trend agnostic, which means that doesn't consider trend. This makes it super useful as gives you clean information about the market without trying to include trend stuff.
Question: If we have a game where you must choose between two options.
1. a horizontal line
2. a vertical line.
Each iteration a Horizontal Line or a Square will appear as continuation of a figure. If it that iteration shows a square and you bet vertical you win, same as if it is horizontal and it is a line.
- Wouldn’t be useful to know that Fractal dimension is 1.8? This will hint square. In the markets you can use 'FD' to filter mean-reversal signals like Bollinger bands, stochastics, Regular RSI divergences, etc.
- Wouldn’t be useful to know that Fractal dimension is 1.2? This will hint Line. In the markets you can use 'FD' to confirm trend following strategies like Moving averages, MACD, Hidden RSI divergences.
Calculation method:
Fractal dimension is obtained from the ‘hurst exponent’.
'FDI' = 2 - 'Hurst Exponent'
Musashi version of the Classic 'OG' Fractal Dimension Index ('FDI')
- By default, you get 3 fast 'FDI's (11,12,13) + 1 Slow 'FDI' (21), their interaction gives useful information.
- Fast 'FDI' cross will give you gray or red dots while Slow 'FDI' cross with the slowest of the fast 'FDI's will give white and orange dots. This are great to early spot trend beginnings or trend ends.
- A baseline (purple) is also provided, this is calculated using a 21 period Bollinger bands with 1.618 'SD', once calculated, you just take midpoint, this is the 'TDI's (Traders Dynamic Index) way. The indicator will print purple dots when Slow 'FDI' and baseline crosses, I see them as Short-Term cycle changes.
- Negative slope 'FDI' means trending asset.
- Positive most of the times hints correction, but if it got overextended it might hint a rocket-shot.
TDI Ranges:
- 'FDI' between 1.0≤ 'FDI' ≤1.4 will confirm trend following continuation signals.
- 'FDI' between 1.6≥ 'FDI' ≥2.0 will confirm reversal signals.
- 'FDI' == 1.5 hints a random unpredictable market.
Fractal Attractors
- As you must know, fractals tend orbit certain spots, this are named Attractors, this happens with any fractal behavior. The market of course also shows them, in form of Support & Resistance, Supply Demand, etc. It’s obvious they are there, but now we understand that they’re not linear, as the market is fractal, so simple trendline might not be the best tool to model this.
- I’ve noticed that when the Musashi version of the 'FDI' indicator start making a cluster of multicolor dots, this end up being an attractor, I tend to draw a rectangle as that area as price tend to come back (I still researching here).
Extra useful stuff
- Momentum / speed: Included by checking RSI Study in the indicator properties. This will add two RSI’s (9 and a 7 periods) plus a baseline calculated same way as explained for 'FDI'. This gives accurate short-term trends. It also includes RSI divergences (regular and hidden), deactivate with a simple check in the RSI section of the properties.
- BBWP (Bollinger Bands with Percentile): Efficient way of visualizing volatility as the percentile of Bollinger bands expansion. This line varies color from Iced blue when low volatility and magma red when high. By default, comes with the High vols deactivated for better view of 'FDI' and RSI while all studies are included. DDWP is trend agnostic, just like 'FDI', which make it very clean at providing information.
- Ultra Slow 'FDI': I noticed that while using BBWP and RSI, the indicator gets overcrowded, so there is the possibility of adding only one 'FDI' + its baseline.
Final Note: I’ve shown you few ways of using this indicator, please backtest before using in real trading. As you know trading is more about risk and trade management than the strategy used. This still a work in progress, I really hope you find value out of it. I use it combination with a tool named “Musashi_Katana” (also found in TradingView).
Best!
Musashi

KK_Traders Dynamic Index_Bar HighlightingHey guys,
this is one of my favorite scripts as it represents a whole trading system that has given me very good results!
I have only used it on Bitcoin so far but I am sure it will also work for other instruments.
The original code to this was created by LazyBear, so all props to him for this great script!
I have linked his original post down below.
You can find the full rules to the system in this PDF (which has also been taken from LBs post):
www.forexmt4.com
Here is a short summary of the rules:
Go long when (all conditions have to be met):
The green line is above 50
The green line is above the red line
The green line is above the orange line
The close is above the upper Band of the Price Action Channel
The candles close is above its open
(The green line is below 68)
Go short when (all conditions have to be met):
The green line is below 50
The green line is below the red line
The green line is below the orange line
The close is below the lower band of the Price Action Channel
The candles close is below its open
(The green line is above 32)
Close when:
Any of these conditions aren't true anymore.
I have marked two of the rules in brackets as they seem to cut out a lot of the profits this system generates. You can choose to still use these rules by checking the box that says "Use Original Ruleset" in the options.
The system also contains rules regarding the Heiken Ashi bars. However these aren't as specific as the other rules. This is where your personal judgement comes in and this part is hard to explain. Take a look at the PDF I have linked to get a better understanding.
So far, this is just the TDI trading system and LBs script, now what have I changed?
I have incorporated the Price Action Channel to the system and changed it so that it highlights the bars whenever the system is giving a signal. As long as the bars are green the system is giving a long signal, as long as they are red the system is giving a short signal. Keep in mind that this doesn't consider the bar size of the HA bars. I recommend coloring all bars grey via the chart settings in order to be able to see the bar highlighting properly.
I have also published the Price Action Channel seperately in case some of you wish to view the Channel.
I am fairly new to creating scripts so use it with caution and let me know what you think!
LBs original post:
The seperate Price Action Channel script:

EMA Spread Exhaustion DetectorEMA Spread Exhaustion – Reversal Scalper's Tool
Identifies trend exhaustion for high-probability counter-trend entries. Triggers when EMA(4/9/20) stack is fully aligned and spread stretches beyond ±ATR threshold. Ideal confluence for TDI hooks + strong rejection candles on 15s charts. Visual markers, fills, and alerts for quick scalps.

FX Master Confluence v41 (Smart TDI Filter)How to read your new Dashboard:
Top Row (The Boss): This is your 8-Hour WaveTrend status.
DARK GREEN: Strong Bull (Bias is Up & Above Zero). Aggressively look for buys.
LIGHT GREEN: Weak Bull (Bias is Up but Below Zero). Be cautious, could be a deep pullback.
DARK RED: Strong Bear (Bias is Down & Below Zero). Aggressively look for sells.
LTF Rows (15m - 6h):
"GOLDEN ZERO": This is the Holy Grail signal you asked for. The LTF WaveTrend just crossed the Zero line in agreement with the 8H Boss.
"REV SETUP": Standard reversal signal (useful, but lower confidence than Golden).
"TREND UP/DOWN": No signal right now, but tells you the flow of that specific timeframe.

XAU/USD Scalping Bot [Jake-Style 1500+] FINALDescription:
This advanced scalping bot is engineered for XAU/USD using Jake-style visual overlays with predictive trade triggers, early entry signals, and multi-layer confirmation tools.
Key Features:
• EMA Cloud System with color-coded directional bias (5/13/21/55/144/377)
• PSAR Flip-Only Dots to highlight trend reversal moments without chart clutter
• Bollinger Band Zones to visualize volatility channels
• Predictive Entry Flags for early buy/sell signals before momentum candles (≥2 pip move)
• TRUE Candle Logic for confirmed trend-following entries
• Multi-Level TP/SL Lines with real-time alerts:
• TP1 / TP2 / TP3 with precise trigger logic
• Stop Loss hit detection
• Red Flag Warnings for exit caution during reversal zones (overbought TDI / failed breakouts)
Optimized For:
• 1m / 3m / 5m / 15m / 30m timeframes
• Scalping & intraday trading with high-precision entries
• Traders who prefer visual confirmation before committing to entries
Created by: @Livingstonedan
Powered by: ChatGPT x Jake-style automation logic

Traders Reality MainThis indicator serves as the Tradingview equivalent of an MT4 indicator suite.
It differentiates from existing TV indicators in its style and total feature set (most notably PVSRA and PVSRA Override)
It was originally designed for forex markets, and it will work for crypto as well, but it has not been tested on stocks.
List of features:
PVSRA Candles
Market boxes (NY/JP/ HK /UK/ FR and Brinks Boxes)
5/13/50/200/800 EMAs (cloud for 50EMA)
Pivot points (S/M/R 1,2,3; PP )
Yesterday and Last Week price range
Average Daily Range (Weekly and Monthly as well)
Daily Open
PVSRA Override
Psychological High/Low
Vector Candle Zones
All of these are configurable in the indicator settings.
Usage instructions:
PVSRA Candle colors meaning:
Green (bull) and red (bear): Candles with volume >= 200% of the average volume of the 10 previous chart candles, and candles where the product of candle spread x candle volume is >= the highest for the 10 previous chart time candles.
Blue (bull) and blue-violet (bear): Candles with volume >= 150% of the average volume of the 10 previous chart candles
PVSRA Override
In order to get reliable bar coloring, we need accurate data. If you're on a chart with low volume on some obscure exchange, you may want to use another exchanges datafeed for the symbol you are on to calculate the PVSRA bar colors with. This lets you do exactly that. By default it's off, but you can turn it on and use INDEX:BTCUSD, or really any other chart you want. You can combine charts too, e.g. use BINANCE:BTCUSDT+COINBASE:BTCUSD.
PVSRA Alerts
Alerts can be made for PVSRA "vector"/"climax" candles:
1. Create Alert (Clock with + sign)
2. Set Condition: "Traders Reality",
3. Select "Alert on Vector Candle",
4. Set it to Once per Bar,
5. choose your notification options.
Market boxes
The market boxes times are configurable and will change depending on the exchange timezone. I recommend to pick your main exchange/chart and adjust the times so that they are correct. Technically you will need to shift the time from the exchanges' timezone to GMT . Default values should be good for UTC based exchanges in current US+UK summer time.
Psychological High/Low
Configurable for Crypto or Forex - draws the perceived Psychological High/Low ranges for the week. Can display historical values too.
Vector Candle Zones
displays unrecovered liquidity left behind on unrecovered vectors. Configurable to take into account candle bodies or candles and wicks.
Recommended additional Tradingview indicator(s):
- TDI - Goldminds, Edited for Market Makers Method by Jakub Donovan
Footnotes
The code was originally by plasmapug, continued development (with permission) is now done by infernix and peshocore and xtech5192 in collaboration with TradersReality.
If you have suggestions or questions, you can message me or leave a comment.
Indicateur C17V2 Not long ago I discovered the TDI(kiss Soxman),
but I needed to know where my market was framed so I started tampering with the open source indicators on TV to make one my way, I'm not not a developer, just a trader homeless.

EBB & Flow: a multi-EMA-based BB cloudIntro
This is an idea evolved out of the market maker method and EMA convergence, divergence, and mean reversion.
The market maker method informs us that the 5, 13, 50 and 200 EMAs are important to regulating price. Those EMA lengths are multiples of the 50 and 200 on lower major timeframes -- the 1 minute, 5, 15, 1H, 4H, 1D. I include the 21 because it is also a multiple and in crypto very often respected.
When market makers are testing price, they set their range and spike in the direction they test for liquidity. This can get chaotic. For instance, in a shorter time frame consolidation inside a bigger timeframe uptrend, it can be too easy to forget where you are in the many trends playing out.
When the EMAs are dragged over each other during normal price movement, you get these crisscrossing tracks of price, and the individual breaks can be hard to trace.
The range is what matters, ultimately, and the range is dynamic. In that case, the Bollinger Band is a great tool for detecting outliers in this case.
The Answer
So the answer this indicator seeks to give, is to look for outliers. This gives you a scalping strategy built on Traders Reality thinking and best put together with the PVSRA indicator, which I may include in this indicator just for the sake of concision, but they can work alongside each other or separately.
The key thing is the different EMA clouds, which are bollinger bands. Tight bands mean imminent breaks, favouring the trend. Vector candles out of a zone, pins to the low/high, etc. are all very relevant alongside this indicator.
You can also use it on its own and scalp the breaks of a cloud.
How it works
Each cloud is a standard deviation from their respective EMA, all in the same colour. The deviation multiple is 1.618 by default. Yes, fibonacci sequences are usually nonsense, but it works better with the BB than 2, 2.5 or 3.
Using just the clouds, you can see where each EMA is headed and how it behaves within the deviation of the others.
But that on its own isn't enough.
The indicator will also print snowflakes above and below the candle for notable outliers. It will be in the colour of the cloud it breaks, but only if that break is also breaking the smaller EMA clouds too.
The most snowflakes will be yellow because that's the 13 EMA. That one is dependent on nothing else and every break will print a snowflake. The 21 will be dependent on the 13. The 50 dependent on the 13 and 21 breaks. The 200 the most important.
For example, if the 200 EMA-BB or EBB is broken at the upper band, deviating by more than 162% of price over a 200 period EMA, and that break is not above the 50 EMA cloud, there will be no snowflake. However, if it exceeds the 13, 21, 50, and 200 clouds, then a purple snowflake will appear above the bar.
Any snowflake is an extreme in price. The purple is an especially good point of entry. That doesn't mean it is a perfect entry. You can build position from it, though, and be relatively certain of a price correction in the near future, because not only was this major EMA cloud violated, but all of the smaller ones too.
Reminder
You still need your PVSRA and candlesticks. This indicator on its own may have a nice hit rate for scalping and building position, as an alternative to the TDI or alongside it, but it is not enough on its own, just like the TDI.
Enjoy!

ASFX A1 Strategyidentify's 2CF and Shift Candle formations
along with Perfect EMA
Note: TDI to be checked manually

M.H Pee indicatorsHere is a collection of Trend Indicators as defined by M.H Pee and presented
in various articles of the "STOCKS & COMMODITIES Magazine"
The actual implementation of the indicators here are made by: everget
I thought they were rather cool, so I have gather them here so that they easily can be tested.
My own test was made using 15 companies from the OMXS30 list
during the time period of 2016-2018, and I only went LONG.
The result was as follows (Average Net Profit , StdDev):
TDI 3.04% 5.97
TTF 1.22%. 5.73
TII 1.07% 6.2
TCF 0.32% 2.68
Would be interesting to hear what other people get as test result from these indicators.
To do that just run this strategy, and chose the indicator from the setup menu.
