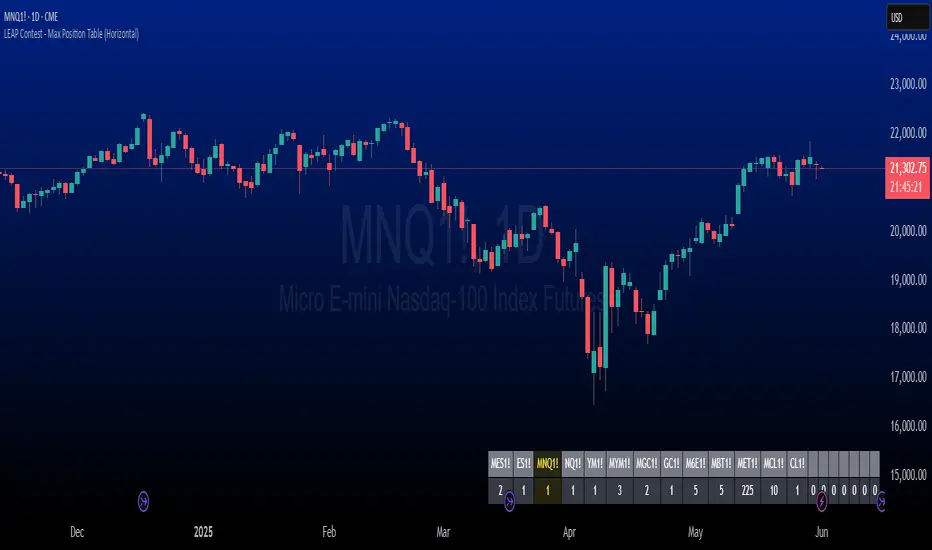
The LEAP Contest - Symbol & Max Position Table TrackerDescription:
This indicator tracks the maximum contracts allowed to be traded for TradingView’s *"The Leap"* Contest. It displays a horizontal table at the bottom right of your chart showing up to 20 symbols along with their maximum allowable open contract positions.
Use case:
Designed specifically for traders participating in *The Leap* Contest on TradingView.
Users need to enter the symbol and the maximum contracts allowed for that symbol in the settings menu for each new contest.
It provides a quick reference to ensure compliance with contest rules on maximum position sizes.
How it works:
The table shows two rows: the top row displays the symbol name, and the bottom row shows the max contract limit.
If the currently loaded chart symbol matches any symbol in the list, its text color changes to yellow .
Customization:
Symbols and limits must be updated in the indicator’s settings before each contest to reflect the current rules.
Cerca negli script per "Table"
OBV Z-Score + Table📘 OBV Z-Score — Indicator Description
Overview
This indicator converts the On-Balance Volume (OBV) into a Z-Score oscillator, providing a normalized statistical view of volume flow strength relative to its recent history.
How It Works
OBV Calculation
The On-Balance Volume accumulates volume based on price direction, showing whether volume is flowing into or out of an asset.
Z-Score Transformation
The OBV values are normalized via Z-Score:
ini
Kopieren
Bearbeiten
Z = (OBV - Mean) / Standard Deviation
This reveals how unusually strong or weak volume momentum is compared to recent norms.
Smoothing
An optional moving average smoothing (SMA, EMA, VWMA, etc.) can be applied for cleaner signals.
Z-Score Table
A live Z-Score value is displayed in a table on the top-right of the indicator pane, clamped between +2 and -2:
+2 indicates unusually high positive volume momentum
-2 indicates unusually high negative volume momentum
How to Use It
Bullish Signal: Z-Score crossing above +1.5 or +2 signals strong buying volume pressure
Bearish Signal: Z-Score crossing below -1.5 or -2 signals strong selling volume pressure
Combine with Price Action: Use alongside price trends or other Z-Score indicators to improve decision making in SDCA or volume-based trading systems

RSI Z-Score + TableHow It Works
RSI Calculation
The standard RSI is computed over a user-defined period (default: 14), measuring the strength of recent price movements.
Z-Score Transformation
The RSI is then normalized using the Z-Score formula:
ini
Kopieren
Bearbeiten
Z = (RSI - Mean) / Standard Deviation
This highlights whether RSI is unusually high or low compared to its historical behavior.
Smoothing
An optional EMA is applied to the Z-Score for smoother and more reliable signals (default: 10-period smoothing).
Z-Score Table
A real-time value of the RSI Z-Score is displayed in a table in the top-right of the indicator pane.
The value is clamped between +2 and -2
+2 aligns with strong overbought RSI conditions
-2 aligns with strong oversold RSI conditions
How to Use It
Buy Signal Potential: When the Z-Score drops below -1.5 or -2 → statistically oversold RSI
Sell Signal Potential: When the Z-Score rises above +1.5 or +2 → statistically overbought RSI
Use in Confluence: Combine with price action, trend filters, or other Z-Score indicators (e.g. OBV, VWAP, VIX) for SDCA or mean-reversion strategies

VWAP Z-Score Oscillator + Scaled TableVWAP Z-Score Oscillator + Scaled Table
This indicator calculates the Z-Score of the VWAP (Volume Weighted Average Price) based on your chosen source price and reset period (Session, Week, Month, Quarter, or Year).
The Z-Score represents how many standard deviations the current price is from the VWAP, visualized as an oscillator oscillating between ±3 sigma levels. The indicator also features three standard deviation bands for easy reference.
To enhance readability, a scaled Z-Score is displayed in a clean, minimalistic table on the top right of the indicator panel. This score is linearly capped between -2 and +2, mapping the raw Z-Score values with limits at ±3 sigma for clarity and quick assessment.
Use this tool to identify extreme deviations from the VWAP, which may signal potential reversals or continuation of price trends.

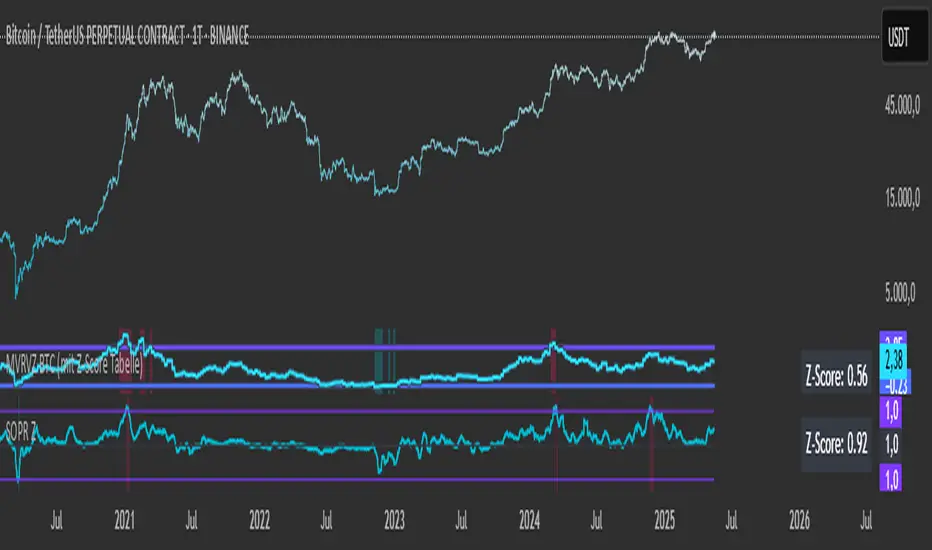
SOPR with Z-Score Table📊 Glassnode SOPR with Dynamic Z-Score Table
ℹ️ Powered by Glassnode On-Chain Metrics
📈 Description:
This indicator visualizes the Spent Output Profit Ratio (SOPR) for major cryptocurrencies — Bitcoin, Ethereum, and Litecoin — along with a dynamically normalized Z-Score. SOPR is a key on-chain metric that reflects whether coins moved on-chain are being sold at a profit or a loss.
🔍 SOPR is calculated using Glassnode’s entity-adjusted SOPR feed, and a custom SMA is applied to smooth the signal. The normalized Z-Score helps identify market sentiment extremes by scaling SOPR relative to its historical context.
📊 Features:
Selectable cryptocurrency: Bitcoin, Ethereum, or Litecoin
SOPR smoothed by user-defined SMA (default: 10 periods)
Upper & lower bounds (±4%) for SOPR, shown as red/green lines
Background highlighting when SOPR moves outside normal range
Normalized Z-Score scaled between –2 and +2
Live Z-Score display in a compact top-right table
🧮 Calculations:
SOPR data is sourced daily from Glassnode:
Bitcoin: XTVCBTC_SOPR
Ethereum: XTVCETH_SOPR
Litecoin: XTVCLTC_SOPR
Z-Score is calculated as:
SMA of SOPR over zscore_length periods
Standard deviation of SOPR
Z-Score = (SOPR – mean) / standard deviation
Z-Score is clamped between –2 and +2 for visual consistency
🎯 Interpretation:
SOPR > 1 implies coins are sold in profit
SOPR < 1 suggests coins are sold at a loss
When SOPR is significantly above or below its recent range (e.g., +4% or –4%), it may signal overheating or capitulation
The Z-Score contextualizes how extreme the current SOPR is relative to history
📌 Notes:
Best viewed on daily charts
Works across selected assets (BTC, ETH, LTC)
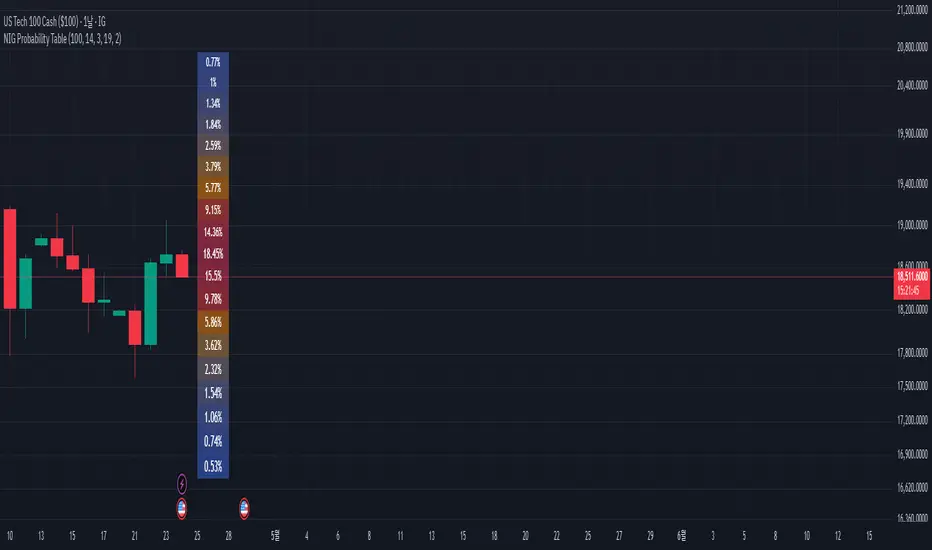
NIG Probability TableNormal-Inverse Gaussian Probability Table
This indicator implements the Normal-Inverse Gaussian (NIG) distribution to estimate the likelihood of future price based on recent market behavior.
📊 Key Features:
- Estimates the parameters (α: tail heaviness, β: skewness, δ: scale, μ: location)
of the NIG distribution using a sliding window over log returns.
- Uses a numerically approximated version of the modified Bessel function (K₁)
to calculate the NIG probability density function (PDF).
- Normalizes the total probability across all bins to ensure the values are interpretable.
- Displays a dynamic probability table showing the chance of future returns falling into each bin.
⚠️ Notes:
- This is a real-time approximation. The Bessel function and posterior inference are simplified.
- Tail probabilities and shape parameters are sensitive to the window size and input settings.
- Useful for risk analysis, option overlays, and strategy filters.
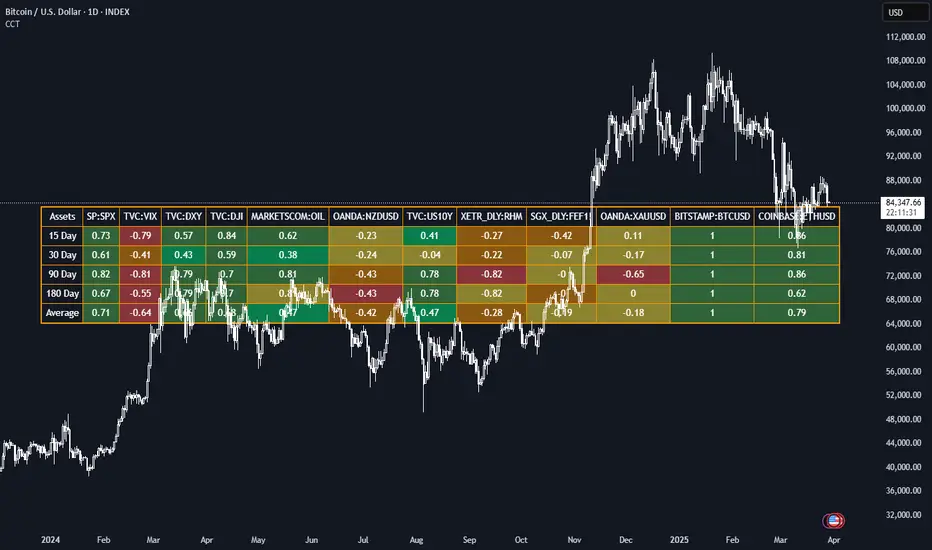
Correlation Coefficient TableThis Pine Script generates a dynamic table for analyzing how multiple assets correlate with a chosen benchmark (e.g., NZ50G). Users can input up to 12 asset symbols, customize the benchmark, and define the beta calculation periods (e.g., 15, 30, 90, 180 days). The script calculates Correlation values for each asset over these periods and computes the average beta for better insights.
The table includes:
Asset symbols: Displayed in the first row.
Correlation values: Calculated for each defined period and displayed in subsequent columns.
Average Correlation: Presented in the final column as an overall measure of correlation strength.
Color coding: Background colors indicate beta magnitude (green for high positive beta, yellow for near-neutral beta, red for negative beta).
ATR & PTR TableThe ATR & PTR Table Indicator displays a dynamic table that provides Average True Range (measures market volatility over 1D, 1W, and 1M timeframes), Price trading range (difference between the high and low prices over the same periods) & percentage of the typical range that has been traded. This indicator will help traders identify potential breakout zones and assess volatility across multiple timeframes.
This had been optimized to show ATR and PTR on every time frame. The (1D) represents ATR on whatever timeframe you are currently on.

Trading Sessions with TableTrading Sessions with Table is a dynamic TradingView indicator that displays the status of major global trading sessions directly on your chart. The script features a customizable table listing key sessions—Sydney, Tokyo, London, and New York—along with their open and close times and current status ("Open" or "Closed").
Key features include:
Custom Time Inputs: Easily set your session times by entering HH:MM formatted strings.
Dynamic Timestamps: The script calculates session timestamps for the current day and automatically adjusts for sessions that span midnight.
Visual Cues: Active sessions are highlighted with distinct background colors for quick reference.
Alert Conditions: Built-in alerts notify you when each session starts and ends, so you can stay informed of market shifts.
Ideal for traders managing multi-market strategies, this tool offers a clear, at-a-glance overview of session activity and helps streamline your trading decisions across different time zones.

Annual Performance Table with Average PeformanceAn indicator that displays annual performance in a table format, providing a quick overview of yearly returns with historical context.
It calculates the performance based on the first and last monthly close prices of each year. It displays returns chronologically from left to right, concluding with an average performance column.
Features :
Works exclusively on monthly timeframes
Customizable number of years to display (1-50 years)
Shows year-by-year performance percentages
Color-coded returns (green for positive, red for negative)
Includes average performance across displayed years
Semi-transparent overlay design for better chart visibility
Performance calculation method:
Performance = ((December Close - January Close) / January Close) × 100%
Usage :
Apply to any chart on monthly timeframe
Adjust the "Number of Years to Display" parameter as needed
Table appears as an overlay with years, individual performances, and average
Note: The indicator will display an error message if applied to any timeframe other than monthly.

Pearson Analysis TableHere's the English translation:
The main functionality of the script lies in calculating the Pearson correlation coefficient over a given period. This coefficient quantifies the relationship between time and price movements, offering traders an objective measure of market trend linearity and, if applicable, its direction. A smoothing option is included to filter out noise and pressure.
The key parameters include the analysis window length, data source (by default, the closing price), and thresholds for identifying strong correlations. These thresholds allow trends to be classified as "bearish," "bullish," or "neutral," with the script reversing traditional interpretation for a unique perspective. For example, a positive correlation indicates a bearish trend, while a negative correlation-
The visual component of the script is a dynamic statistics table displayed on the chart. This table provides the current Pearson coefficient, correlation strength (classified as Strong, Medium, Weak, or Neutral), the inferred trend, and the analysis period. Values are color-coded for easy identification, thus enhancing trader understanding.
Additionally, the script offers alert conditions to inform traders of important market events, such as when the Pearson coefficient crosses key thresholds or changes direction. These alerts can be used to identify strong bearish or bullish trends or transitions through the neutral zone.
This tool is particularly useful for traders seeking to identify and act on statistically significant trends, providing them with an analytical edge and helping them align their strategies with market dynamics. The combination of real-time calculations, customizable thresholds, and clear visual feedback makes this indicator a robust addition to any technology.

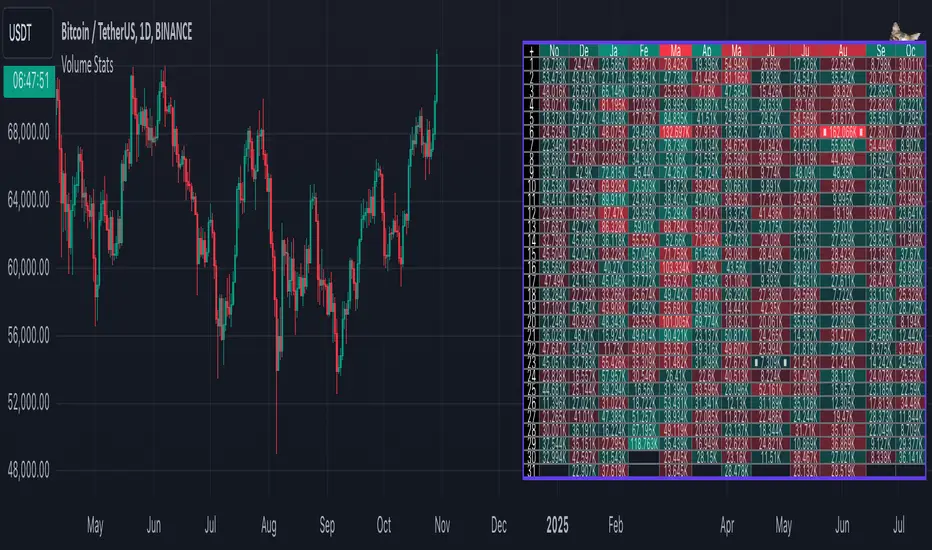
Volume StatsDescription:
Volume Stats displays volume data and statistics for every day of the year, and is designed to work on "1D" timeframe. The data is displayed in a table with columns being months of the year, and rows being days of each month. By default, latest data is displayed, but you have an option to switch to data of the previous year as well.
The statistics displayed for each day is:
- volume
- % of total yearly volume
- % of total monthly volume
The statistics displayed for each column (month) is:
- monthly volume
- % of total yearly volume
- sentiment (was there more bullish or bearish volume?)
- min volume (on which day of the month was the min volume)
- max volume (on which day of the month was the max volume)
The cells change their colors depending on whether the volume is bullish or bearish, and what % of total volume the current cell has (either yearly or monthly). The header cells also change their color (based either on sentiment or what % of yearly volume the current month has).
This is the first (and free) version of the indicator, and I'm planning to create a "PRO" version of this indicator in future.
Parameters:
- Timezone
- Cell data -> which data to display in the cells (no data, volume or percentage)
- Highlight min and max volume -> if checked, cells with min and max volume (either monthly or yearly) will be highlighted with a dot or letter (depending on the "Cell data" input)
- Cell stats mode -> which data to use for color and % calculation (All data = yearly, Column = monthly)
- Display data from previous year -> if checked, the data from previous year will be used
- Header color is calculated from -> either sentiment or % of the yearly volume
- Reverse theme -> the table colors are automatically changed based on the "Dark mode" of Tradingview, this checkbox reverses the logic (so that darker colors will be used when "Dark mode" is off, and lighter colors when it's on)
- Hide logo -> hides the cat logo (PLEASE DO NOT HIDE THE CAT)
Conclusion:
Let me know what you think of the indicator. As I said, I'm planning to make a PRO version with more features, for which I already have some ideas, but if you have any suggestions, please let me know.
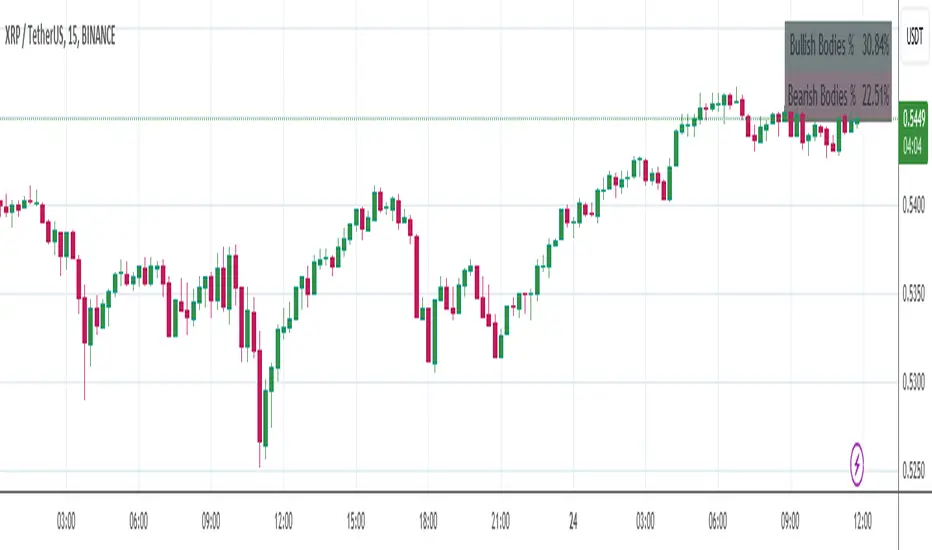
Candle Body Percentages TableThis script is designed as an analysis tool to visually represent the relative strength of bullish and bearish market sentiments over a specified number of candles. It calculates and displays the percentages of bullish and bearish "candle bodies" as part of the total price range observed in the chosen period.
Here's a breakdown of its functionalities:
User-Defined Period Analysis: Users can specify the number of candles they wish to analyze, allowing for flexible and dynamic examination of market trends over different time frames.
Bullish Body Percentage: The script calculates the combined length of all bullish candle bodies (where the closing price is higher than the opening price) within the selected range and expresses this total as a percentage of the combined price range of all candles analyzed.
Bearish Body Percentage: Similarly, it computes the aggregate length of all bearish candle bodies (where the closing price is lower than the opening price) and presents this sum as a percentage of the total price range.
Visual Representation: The results are displayed in a table format on the chart, providing an immediate visual summary of the prevailing market dynamics. The table shows the percentages of price movement dominated by bullish or bearish sentiment.
Market Sentiment Indicator: This tool can be particularly useful for traders and analysts looking to gauge market sentiment. High bullish body percentages might indicate strong buying pressure, while high bearish body percentages could suggest significant selling pressure.
Strategic Decision Making: By providing a clearer picture of market sentiment over a user-defined period, the script aids in making informed trading decisions, potentially enhancing trading strategies that are sensitive to trends and market momentum.
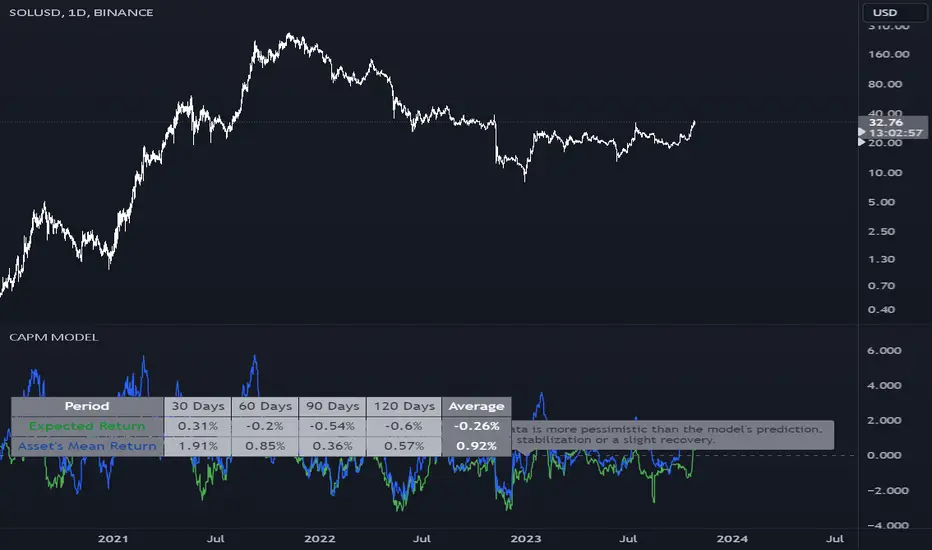
CAPM Model with Returns TableThe given Pine Script is designed to implement the Capital Asset Pricing Model (CAPM) to calculate the expected return for a specified asset over various user-defined periods and compare it with the asset's historical mean return. The core features and functionalities of the script include:
Inputs:
Benchmark Symbol: Defaulted to "CRYPTOCAP:TOTAL". This serves as a comparison metric.
Risk-free Rate: Represents the return on an investment that is considered risk-free.
Benchmark Period: Used for plotting purposes. It doesn't affect table calculations.
Period Settings: Allows users to specify four different time periods for calculations.
Functionalities:
Computes daily returns for the benchmark and asset.
Calculates beta, which represents the volatility of the asset as compared to the volatility of the benchmark.
Uses CAPM to estimate expected returns over user-defined periods.
Generates a table displaying the expected return and asset's mean return for each period.
Provides implications based on the comparison between the expected returns and the asset's historical returns. This is showcased through a mutable label that is updated with each bar.
Visualization:
Plots expected return and asset's mean return over the benchmark period.
Provides a horizontal line to represent zero return.
Use Case:
This script can be helpful for traders or analysts looking to gauge the potential return of an asset compared to its historical performance using the CAPM. The implications provided by the script can serve as useful insights for making investment decisions. It's especially beneficial for those trading or analyzing assets in the cryptocurrency market, given the default benchmark setting.
Note: Before relying on this script for trading decisions, ensure a thorough understanding of its methodology and validate its assumptions against your research.
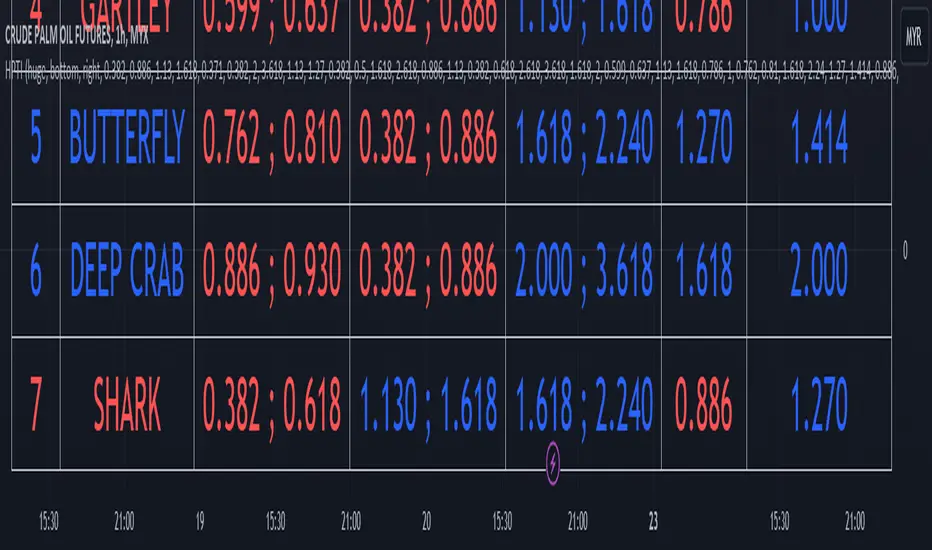
Harmonic Pattern Table Inputs█ OVERVIEW
This indicator was intended as educational purpose only based on Harmonic Pattern Table (Source Code) .
Some user have different ratios in mind, thus I add input to allow user to change those ratios.
█ CREDITS
Scott M Carney, Trading Volume 3: Reaction vs. Reversal
█ CREDITS
1. List Harmonic Patterns.
2. Font size small for mobile app and font size normal for desktop.
3. Font color does automatically change follow dark / light chart theme.
4. Inputs to change ratio values.
█ USAGE / EXAMPLES
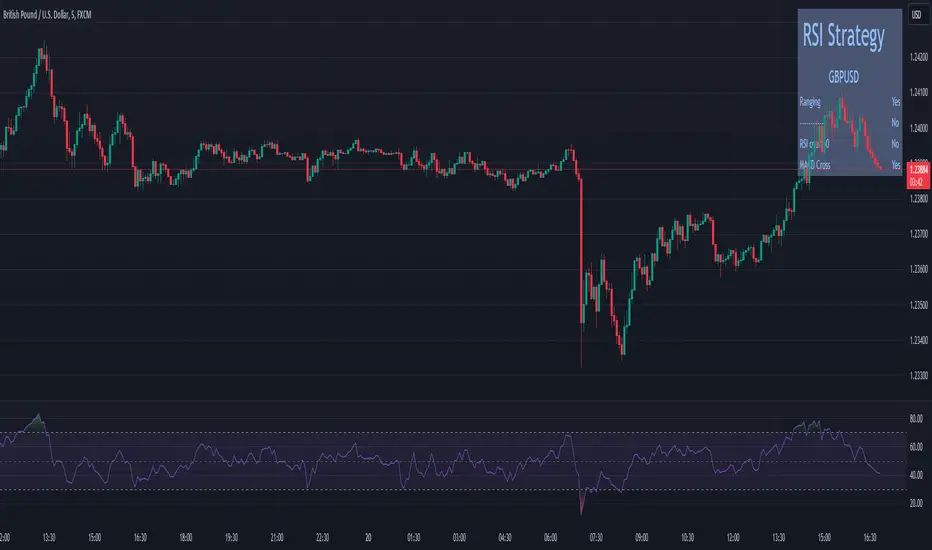
TradersCheckListThe Traders Check List is a unique and innovative tool designed to assist traders in their decision-making process. Unlike traditional indicators that provide signals or visual representations of market data, the Traders Check List offers a structured and customizable checklist that traders can use to ensure they're adhering to their trading plan and strategy.
While there are countless indicators available for trend detection, momentum, volatility, and other market aspects, very few tools focus on the trader's process. The Traders Check List fills this gap by providing a visual reminder of key trading considerations directly on the chart.
Functionality:
Upon applying the Traders Check List to a chart, users will see a table displayed, typically in the top right corner. This table contains rows that represent different trading considerations, such as trend direction, risk management, and psychological factors. Each row can be customized by the user to fit their specific trading plan.
For instance, a trader might have a row labeled "Trending Lower" with a corresponding "Yes/No" column to confirm if the current instrument is indeed trending downward.
Underlying Concepts:
The Traders Check List is based on the principle that successful trading is not just about market analysis but also about discipline and consistency. By having a visual checklist on the chart, traders are constantly reminded of their strategy's key components, reducing the likelihood of impulsive or emotional decisions.
How to Use:
Apply the Traders Check List to your desired chart.
Customize the rows based on your trading strategy's key considerations.
As you analyze the market, update the checklist to reflect the current conditions and your analysis.
Before entering a trade, review the checklist to ensure all criteria are met.
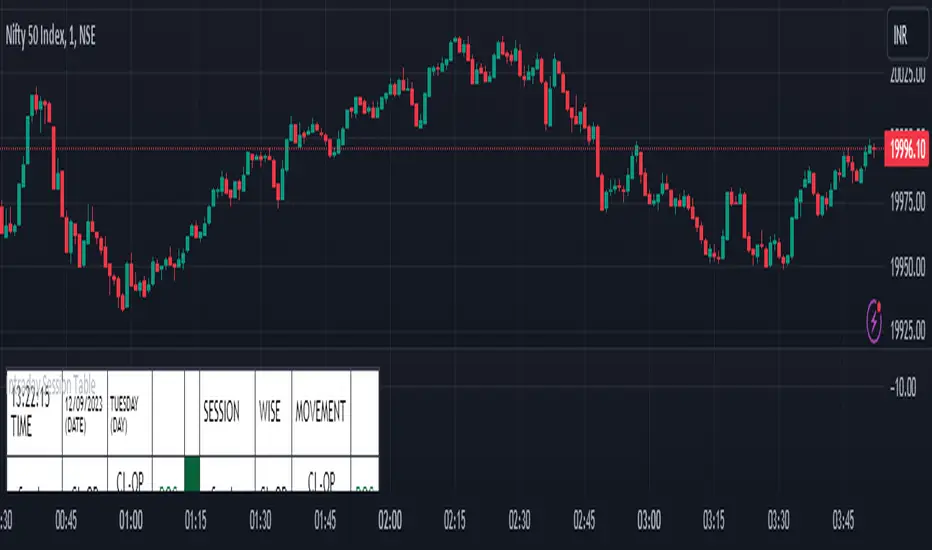
Intraday Session Table Intraday Session Table indicator up dates the values as per session input. By default session input duration is for 15 minutes. It updates the Intraday Closing Price- Open Price (CL-OP) of session at the end of the session. The next column displays the increase / decrease in CL-OP
The third column displays various values viz ROC, Closing Price, RSI(14 bars), MA20, MA50,Momentum(10 bars),Closing Price-Open Price,Net number of bars (Intraday Red bars minus Green bars) and Net intraday volume in millions.The parameters can be selected from the dropdown list in Input Box.
User can CHECK OUT Table input Box and select from the list to see individual charts.
User can analyze the movement of values to ascertain the trend.It gives fair idea of the up and down movement based on the session wise movement of values. The access to individual charts of some of the values help the user to have a graphic picture of the situation.
DISCLAIMER: For educational and entertainment purpose only .Nothing in this content should be interpreted as financial advice or a recommendation to buy or sell any sort of security/ies or investment/s.
Multi-Timeframe Trend TableThis is the first publication of an indicator to show trend on the higher timeframes and is an English version of the "Mtf Supertrend Table" coded by FxTraderProAsistan. Credit goes to him for the genesis of this work. I updated the original code to Pinescript V.5 and modified it to suit my needs. Please enjoy.
This trend table indicator has the following features:
1. Trend Mode : Option to select the method of determining trend, using the Pinescript built-in ta.supertrend function or finding trend based on the cross of 20 and 50 EMA
2. 6 trend timeframes of your choosing, with show/hide
3. Optional feature to include the DXY (US dollar) trends, for the timeframes chosen. Useful for instruments that react to changes in the US dollar
4. ATR settings to adjust the Supertrend parameters. Default values are an ATR length of 10 and a Factor of 3

Strategy Template + Performance & Returns table + ExtrasA script I've been working on since summer 2022. A template for any strategy so you just have to write or paste the code and go straight into risk management settings
Features:
>Signal only Longs/only Shorts/Both
>Leverage system
>Proper fees calculation (even with leverage on)
>Different Stop Loss systems: Simple percentage, 4 different "move to Break Even" systems and Scaling SL after each TP order (read the disclaimer at the bottom regarding this and the TV % profitable metric)
>2 Take Profit systems: Simple percentages, or Risk/reward ratios based on SL level
>Additional option on TP so last one "rides free" until closure of position or Stoploss is hit (for more than 1 orders)
>Up to 5 TP orders
>Show or hide SL/TP levels on demand
>2 date filters. Manual filter is nothing new, enter two dates/hours and filter will turn on. BUT automatic filter is another thing (thanks to user @bfr_ for his help in codingthis feature)
>AUTOMATIC DATE FILTER. Allows you to split all historical data on the chart in X periods, then choose the range of periods used. Up to 10 but that can be changed, instructions included. Useful for WalkForward simulations, haven't seen a script in TradingView that allows you to do this and test your strategy on "unseen data" automatically
EXTRA SETTINGS
Besides, some additions I like to add to my codes:
>Returns table for monthly and weekly performance. Requires recalculation on every tick. This is a modified version of @QuantNomad's work. May add lower TF options later on
>Volume Based S/R system. Original work from @shtcoinr
>One feature that was made by me, the "portfolio table". Yields info and metrics of your strategy, current position and balance. You're able to turn it off and change its size
Should anyone find an error, or have any idea on how to improve this code, please contact me. Future updates could come, stay tuned
DISCLAIMER:
In order to have accurate StopLoss hit, I had to change the previous system, which was a "close position on candle close" instead at actual stoploss level. It was fixed, but resulted on inflation of the number of trading orders, thus reducing the percent profitable and making it strongly biased and unreal. Keep that in mind, that "real" profitability could be 2x or 3x the metric TradingView says. If your strategy has a really high trading frequency, resulting in 3000+ orders, might be a problem. Try to make use of the automatic/manual date filter as workaround, I have no means of changing this, seems it is not a bug but an intended design of the PineScript Code

Volume Price and FundamentalsVolume Price and Fundamentals indicators contains 4 exponential moving averages based upon Fibonnaci numbers as period (8, 21, 55 & 144) with crossovers and crossunders.
It also contain a table for volume and 50 Day Avg. Volume, Relative volume, Change in Volume, Volume Value, Up-Down Closing Basis days in last 50 days, Volume ratio (U/D Ratio) on last 50-day Up / Down days and along with fundamental analysis table with various Fundamental Analysis parameters and QoQ & YoY comparison basis for better investment decision making.

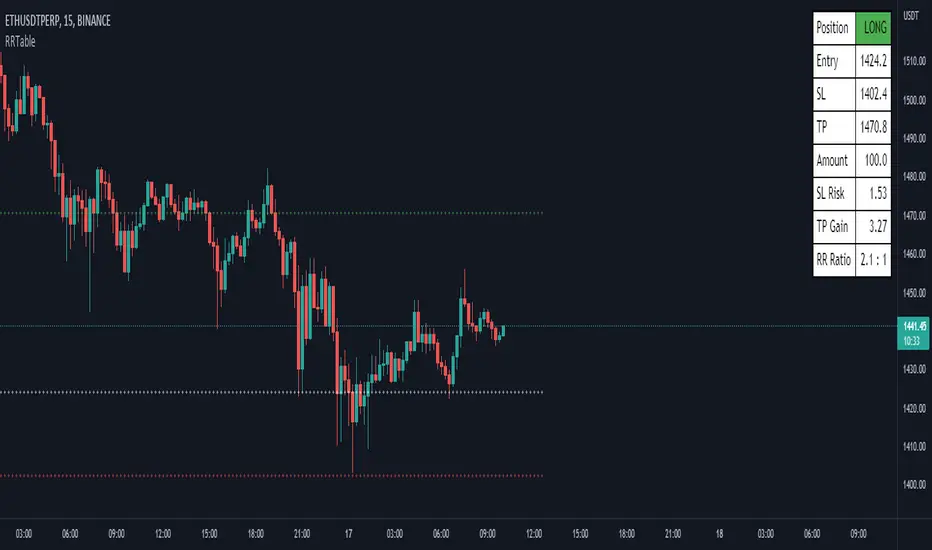
Risk Calculation Table - Amount BasedHello, this is my first script, and I believe that understanding the Risk and Reward is also the first essential step to become a successful trader.
Well maybe there are a lot of script like this but I think no one was suitable for me, so I learnt how to make one.
I think I need to explain some aspects about this script:
Input Section :
1. Entry = Entry Price.
2. SL = Stop Loss Price.
3. TP = Take Profit Price.
4. Amount = How much dollars you trade on this trade.
4. Ticker's Decimal = The number behind the decimal, to adjust this just type how much 0 you want behind the decimal.
Output Section :
1. You can adjust the lines plotted on the chart to automatically enter your entry, stop loss, and take profit price.
2. The table's appearance can be repositioned and resized.
3. The terms in the table, I think it's clear enough for everyone to understand.
If there are any critics or suggestions, I will appreciate it so much.
Greetings from Indonesia :)
Annual Returns % Comparison [By MUQWISHI]Overview
The Annual Returns % Comparison indicator aimed to compare the historical annual percentage change of any two symbols. The indicator output shows a column-plot that was developed by two using a pine script table, so each period has pair columns showing the yearly percentage change for entered symbols.
Features
- Enter date range.
- Fill up with any two symbols.
- Choose the output data whether adjusted or not.
- Change the location of the table plot
- Color columns by a symbol.
- Size the height and width of columns.
- Color background, border, and text.
- The tooltip of the column value appears once the cursor sets above the specific column. As it seen below.
Let me know if you have any questions.
Thanks.

Multi-timeframe Moving Average with Summary TableThis script aims to keep you orientated with regard to moving averages on higher time frames when working in the lower timeframe. It will show the given MA specification from you current timeframe and the timeframes above. In addition, it also shows a summary table of what the MAs on the other timeframes are doing (trending up/down, flat).
So if you are on the 15 minute timeframe looking at the 20SMA you will know where the 20SMA is on the 1hour, 4hour, 1D, 1W, 1M. You also know the direction of the upper timeframe mas (the 1 hour is trending up but the 4hour is flat etc).
Defining whether an MA is trending is a little subjective but the script making a reasonable job of it - it compares the current MA level to the MA level the defined bars back and compares that to the average true range. (That way it works the same across all currencies regardless of their natural volatility. There is a check feature so you can understand the results your settings are creating.
summary table
show mas
check feature
