Clenow MomentumClenow Momentum Method
The Clenow Momentum Method, developed by Andreas Clenow, is a systematic, quantitative trading strategy focused on capturing medium- to long-term price trends in financial markets. Popularized through Clenow’s book, Stocks on the Move: Beating the Market with Hedge Fund Momentum Strategies, the method leverages momentum—an empirically observed phenomenon where assets that have performed well in the recent past tend to continue performing well in the near future.
Theoretical Foundation
Momentum investing is grounded in behavioral finance and market inefficiencies. Investors often exhibit herding behavior, underreact to new information, or chase trends, causing prices to trend beyond fundamental values. Clenow’s method builds on academic research, such as Jegadeesh and Titman (1993), which demonstrated that stocks with high returns over 3–12 months outperform those with low returns over similar periods.
Clenow’s approach specifically uses **annualized momentum**, calculated as the rate of return over a lookback period (typically 90 days), annualized to reflect a yearly percentage. The formula is:
Momentum=(((Close N periods agoCurrent Close)^N252)−1)×100
- Current Close: The most recent closing price.
- Close N periods ago: The closing price N periods back (e.g., 90 days).
- N: Lookback period (commonly 90 days).
- 252: Approximate trading days in a year for annualization.
This metric ranks stocks by their momentum, prioritizing those with the strongest upward trends. Clenow’s method also incorporates risk management, diversification, and volatility adjustments to enhance robustness.
Methodology
The Clenow Momentum Method involves the following steps:
1. Universe Selection:
- A broad universe of liquid stocks is chosen, often from major indices (e.g., S&P 500, Nasdaq 100) or global exchanges.
- Filters should exclude illiquid stocks (e.g., low average daily volume) or those with extreme volatility.
2. Momentum Calculation:
- Stocks are ranked based on their annualized momentum over a lookback period (typically 90 days, though 60–120 days can be common tests).
- The top-ranked stocks (e.g., top 10–20%) are selected for the portfolio.
3. Volatility Adjustment (Optional):
- Clenow sometimes adjusts momentum scores by volatility (e.g., dividing by the standard deviation of returns) to favor stocks with smoother trends.
- This reduces exposure to erratic price movements.
4. Portfolio Construction:
- A diversified portfolio of 10–25 stocks is constructed, with equal or volatility-weighted allocations.
- Position sizes are often adjusted based on risk (e.g., 1% of capital per position).
5. Rebalancing:
- The portfolio is rebalanced periodically (e.g., weekly or monthly) to maintain exposure to high-momentum stocks.
- Stocks falling below a momentum threshold are replaced with higher-ranked candidates.
6. Risk Management:
- Stop-losses or trailing stops may be applied to limit downside risk.
- Diversification across sectors reduces concentration risk.
Implementation in TradingView
Key features include:
- Customizable Lookback: Users can adjust the lookback period in pinescript (e.g., 90 days) to align with Clenow’s methodology.
- Visual Cues: Background colors (green for positive, red for negative momentum) and a zero line help identify trend strength.
- Integration with Screeners: TradingView’s stock screener can filter high-momentum stocks, which can then be analyzed with the custom indicator.
Strengths
1. Simplicity: The method is straightforward, relying on a single metric (momentum) that’s easy to calculate and interpret.
2. Empirical Support: Backed by decades of academic research and real-world hedge fund performance.
3. Adaptability: Applicable to stocks, ETFs, or other asset classes, with flexible lookback periods.
4. Risk Management: Diversification and periodic rebalancing reduce idiosyncratic risk.
5. TradingView Integration: Pine Script implementation enables real-time visualization, enhancing decision-making for stocks like NVDA or SPY.
Limitations
1. Mean Reversion Risk: Momentum can reverse sharply in bear markets or during sector rotations, leading to drawdowns.
2. Transaction Costs: Frequent rebalancing increases trading costs, especially for retail traders with high commissions. This is not as prevalent with commission free trading becoming more available.
3. Overfitting Risk: Over-optimizing lookback periods or filters can reduce out-of-sample performance.
4. Market Conditions: Underperforms in low-momentum or highly volatile markets.
Practical Applications
The Clenow Momentum Method is ideal for:
Retail Traders: Use TradingView’s screener to identify high-momentum stocks, then apply the Pine Script indicator to confirm trends.
Portfolio Managers: Build diversified momentum portfolios, rebalancing monthly to capture trends.
Swing Traders: Combine with volume filters to target short-term breakouts in high-momentum stocks.
Cross-Platform Workflow: Integrate with Python scanners to rank stocks, then visualize on TradingView for trade execution.
Comparison to Other Strategies
Vs. Minervini’s VCP: Clenow’s method is purely quantitative, while Minervini’s Volatility Contraction Pattern (your April 11, 2025 query) combines momentum with chart patterns. Clenow is more systematic but less discretionary.
Vs. Mean Reversion: Momentum bets on trend continuation, unlike mean reversion strategies that target oversold conditions.
Vs. Value Investing: Momentum outperforms in bull markets but may lag value strategies in recovery phases.
Conclusion
The Clenow Momentum Method is a robust, evidence-based strategy that capitalizes on price trends while managing risk through diversification and rebalancing. Its simplicity and adaptability make it accessible to retail traders, especially when implemented on platforms like TradingView with custom Pine Script indicators. Traders must be mindful of transaction costs, mean reversion risks, and market conditions. By combining Clenow’s momentum with volume filters and alerts, you can optimize its application for swing or position trading.
Cerca negli script per "TradingView+手机版"

GIGANEVA V6.61 PublicThis enhanced Fibonacci script for TradingView is a powerful, all-in-one tool that calculates Fibonacci Levels, Fans, Time Pivots, and Golden Pivots on both logarithmic and linear scales. Its ability to compute time pivots via fan intersections and Range interactions, combined with user-friendly features like Bool Fib Right, sets it apart. The script maximizes TradingView’s plotting capabilities, making it a unique and versatile tool for technical analysis across various markets.
1. Overview of the Script
The script appears to be a custom technical analysis tool built for TradingView, improving upon an existing script from TradingView’s Community Scripts. It calculates and plots:
Fibonacci Levels: Standard retracement levels (e.g., 0.236, 0.382, 0.5, 0.618, etc.) based on a user-defined price range.
Fibonacci Fans: Trendlines drawn from a high or low point, radiating at Fibonacci ratios to project potential support/resistance zones.
Time Pivots: Points in time where significant price action is expected, determined by the intersection of Fibonacci Fans or their interaction with key price levels.
Golden Pivots: Specific time pivots calculated when the 0.5 Fibonacci Fan (on a logarithmic or linear scale) intersects with its counterpart.
The script supports both logarithmic and linear price scales, ensuring versatility across different charting preferences. It also includes a feature to extend Fibonacci Fans to the right, regardless of whether the user selects the top or bottom of the range first.
2. Key Components Explained
a) Fibonacci Levels and Fans from Top and Bottom of the "Range"
Fibonacci Levels: These are horizontal lines plotted at standard Fibonacci retracement ratios (e.g., 0.236, 0.382, 0.5, 0.618, etc.) based on a user-defined price range (the "Range"). The Range is typically the distance between a significant high (top) and low (bottom) on the chart.
Example: If the high is $100 and the low is $50, the 0.618 retracement level would be at $80.90 ($50 + 0.618 × $50).
Fibonacci Fans: These are diagonal lines drawn from either the top or bottom of the Range, radiating at Fibonacci ratios (e.g., 0.382, 0.5, 0.618). They project potential dynamic support or resistance zones as price evolves over time.
From Top: Fans drawn downward from the high of the Range.
From Bottom: Fans drawn upward from the low of the Range.
Log and Linear Scale:
Logarithmic Scale: Adjusts price intervals to account for percentage changes, which is useful for assets with large price ranges (e.g., cryptocurrencies or stocks with exponential growth). Fibonacci calculations on a log scale ensure ratios are proportional to percentage moves.
Linear Scale: Uses absolute price differences, suitable for assets with smaller, more stable price ranges.
The script’s ability to plot on both scales makes it adaptable to different markets and user preferences.
b) Time Pivots
Time pivots are points in time where significant price action (e.g., reversals, breakouts) is anticipated. The script calculates these in two ways:
Fans Crossing Each Other:
When two Fibonacci Fans (e.g., one from the top and one from the bottom) intersect, their crossing point represents a potential time pivot. This is because the intersection indicates a convergence of dynamic support/resistance zones, increasing the likelihood of a price reaction.
Example: A 0.618 fan from the top crosses a 0.382 fan from the bottom at a specific bar on the chart, marking that bar as a time pivot.
Fans Crossing Top and Bottom of the Range:
A fan line (e.g., 0.5 fan from the bottom) may intersect the top or bottom price level of the Range at a specific time. This intersection highlights a moment where the fan’s projected support/resistance aligns with a key price level, signaling a potential pivot.
Example: The 0.618 fan from the bottom reaches the top of the Range ($100) at bar 50, marking bar 50 as a time pivot.
c) Golden Pivots
Definition: Golden pivots are a special type of time pivot calculated when the 0.5 Fibonacci Fan on one scale (logarithmic or linear) intersects with the 0.5 fan on the opposite scale (or vice versa).
Significance: The 0.5 level is the midpoint of the Fibonacci sequence and often acts as a critical balance point in price action. When fans at this level cross, it suggests a high-probability moment for a price reversal or significant move.
Example: If the 0.5 fan on a logarithmic scale (drawn from the bottom) crosses the 0.5 fan on a linear scale (drawn from the top) at bar 100, this intersection is labeled a "Golden Pivot" due to its confluence of key Fibonacci levels.
d) Bool Fib Right
This is a user-configurable setting (a boolean input in the script) that extends Fibonacci Fans to the right side of the chart.
Functionality: When enabled, the fans project forward in time, regardless of whether the user selected the top or bottom of the Range first. This ensures consistency in visualization, as the direction of the Range selection (top-to-bottom or bottom-to-top) does not affect the fan’s extension.
Use Case: Traders can use this to project future support/resistance zones without worrying about how they defined the Range, improving usability.
3. Why Is This Code Unique?
Original calculation of Log levels were taken from zekicanozkanli code. Thank you for giving me great Foundation, later modified and applied to Fib fans. The script’s uniqueness stems from its comprehensive integration of Fibonacci-based tools and its optimization for TradingView’s plotting capabilities. Here’s a detailed breakdown:
All-in-One Fibonacci Tool:
Most Fibonacci scripts on TradingView focus on either retracement levels, extensions, or fans.
This script combines:
Fibonacci Levels: Static horizontal lines for retracement and extension.
Fibonacci Fans: Dynamic trendlines for projecting support/resistance.
Time Pivots: Temporal analysis based on fan intersections and Range interactions.
Golden Pivots: Specialized pivots based on 0.5 fan confluences.
By integrating these functions, the script provides a holistic Fibonacci analysis tool, reducing the need for multiple scripts.
Log and Linear Scale Support:
Many Fibonacci tools are designed for linear scales only, which can distort projections for assets with exponential price movements. By supporting both logarithmic and linear scales, the script caters to a wider range of markets (e.g., stocks, forex, crypto) and user preferences.
Time Pivot Calculations:
Calculating time pivots based on fan intersections and Range interactions is a novel feature. Most TradingView scripts focus on price-based Fibonacci levels, not temporal analysis. This adds a predictive element, helping traders anticipate when significant price action might occur.
Golden Pivot Innovation:
The concept of "Golden Pivots" (0.5 fan intersections across scales) is a unique addition. It leverages the symmetry of the 0.5 level and the differences between log and linear scales to identify high-probability pivot points.
Maximized Plot Capabilities:
TradingView imposes limits on the number of plots (lines, labels, etc.) a script can render. This script is coded to fully utilize these limits, ensuring that all Fibonacci levels, fans, pivots, and labels are plotted without exceeding TradingView’s constraints.
This optimization likely involves efficient use of arrays, loops, and conditional plotting to manage resources while delivering a rich visual output.
User-Friendly Features:
The Bool Fib Right option simplifies fan projection, making the tool intuitive even for users who may not consistently select the Range in the same order.
The script’s flexibility in handling top/bottom Range selection enhances usability.
4. Potential Use Cases
Trend Analysis: Traders can use Fibonacci Fans to identify dynamic support/resistance zones in trending markets.
Reversal Trading: Time pivots and Golden Pivots help pinpoint moments for potential price reversals.
Range Trading: Fibonacci Levels provide key price zones for trading within a defined range.
Cross-Market Application: Log/linear scale support makes the script suitable for stocks, forex, commodities, and cryptocurrencies.
The original code was from zekicanozkanli . Thank you for giving me great Foundation.

Dskyz (DAFE) AI Adaptive Regime - Beginners VersionDskyz (DAFE) AI Adaptive Regime - Pro: Revolutionizing Trading for All
Introduction
In the fast-paced world of financial markets, traders need tools that can keep up with ever-changing conditions while remaining accessible. The Dskyz (DAFE) AI Adaptive Regime - Pro is a groundbreaking TradingView strategy that delivers advanced, AI-driven trading capabilities to everyday traders. Available on TradingView (TradingView Scripts), this Pine Script strategy combines sophisticated market analysis with user-friendly features, making it a standout choice for both novice and experienced traders.
Core Functionality
The strategy is built to adapt to different market regimes—trending, ranging, volatile, or quiet—using a robust set of technical indicators, including:
Moving Averages (MA): Fast and slow EMAs to detect trend direction.
Average True Range (ATR): For dynamic stop-loss and volatility assessment.
Relative Strength Index (RSI) and MACD: Multi-timeframe confirmation of momentum and trend.
Average Directional Index (ADX): To identify trending markets.
Bollinger Bands: For assessing volatility and range conditions.
Candlestick Patterns: Recognizes patterns like bullish engulfing, hammer, and double bottoms, confirmed by volume spikes.
It generates buy and sell signals based on a scoring system that weighs these indicators, ensuring trades align with the current market environment. The strategy also includes dynamic risk management with ATR-based stops and trailing stops, as well as performance tracking to optimize future trades.
What Sets It Apart
The Dskyz (DAFE) AI Adaptive Regime - Pro distinguishes itself from other TradingView strategies through several unique features, which we compare to common alternatives below:
| Feature | Dskyz (DAFE) | Typical TradingView Strategies|
|---------|-------------|------------------------------------------------------------|
| Regime Detection | Automatically identifies and adapts to **four** market regimes | Often static or limited to trend/range detection |
| Multi‑Timeframe Analysis | Uses higher‑timeframe RSI/MACD for confirmation | Rarely incorporates multi‑timeframe data |
| Pattern Recognition | Detects candlestick patterns **with volume confirmation** | Limited or no pattern recognition |
| Dynamic Risk Management | ATR‑based stops and trailing stops | Often uses fixed stops or basic risk rules |
| Performance Tracking | Adjusts thresholds based on past performance | Typically static parameters |
| Beginner‑Friendly Presets | Aggressive, Conservative, Optimized profiles | Requires manual parameter tuning |
| Visual Cues | Color‑coded backgrounds for regimes | Basic or no visual aids |
The Dskyz strategy’s ability to integrate regime detection, multi-timeframe analysis, and user-friendly presets makes it uniquely versatile and accessible, addressing the needs of everyday traders who want professional-grade tools without the complexity.
-Key Features and Benefits
[Why It’s Ideal for Everyday Traders
⚡The Dskyz (DAFE) AI Adaptive Regime - Pro democratizes advanced trading by offering professional-grade tools in an accessible package. Unlike many TradingView strategies that require deep technical knowledge or fail in changing market conditions, this strategy simplifies complex analysis while maintaining robustness. Its presets and visual aids make it easy for beginners to start, while its adaptive features and performance tracking appeal to advanced traders seeking an edge.
🔄Limitations and Considerations
Market Dependency: Performance varies by market and timeframe. Backtesting is essential to ensure compatibility with your trading style.
Learning Curve: While presets simplify use, understanding regimes and indicators enhances effectiveness.
No Guaranteed Profits: Like all strategies, success depends on market conditions and proper execution. The Reddit discussion highlights skepticism about TradingView strategies’ universal success (Reddit Discussion).
Instrument Specificity: Optimized for futures (e.g., ES, NQ) due to fixed tick values. Test on other instruments like stocks or forex to verify compatibility.
📌Conclusion
The Dskyz (DAFE) AI Adaptive Regime - Pro is a revolutionary TradingView strategy that empowers everyday traders with advanced, AI-driven tools. Its ability to adapt to market regimes, confirm signals across timeframes, and manage risk dynamically. sets it apart from typical strategies. By offering beginner-friendly presets and visual cues, it makes sophisticated trading accessible without sacrificing power. Whether you’re a novice looking to trade smarter or a pro seeking a competitive edge, this strategy is your ticket to mastering the markets. Add it to your chart, backtest it, and join the elite traders leveraging AI to dominate. Trade like a boss today! 🚀
Use it with discipline. Use it with clarity. Trade smarter.
**I will continue to release incredible strategies and indicators until I turn this into a brand or until someone offers me a contract.
-Dskyz

Fibonacci Circle Zones🟩 The Fibonacci Circle Zones indicator is a technical visualization tool, building upon the concept of traditional Fibonacci circles. It provides configurable options for analyzing geometric relationships between price and time, used to identify potential support and resistance zones derived from circle-based projections. The indicator constructs these Fibonacci circles based on two user-selected anchor points (Point A and Point B), which define the foundational price range and time duration for the geometric analysis.
Key features include multiple mathematical Circle Formulas for radius scaling and several options for defining the circle's center point, enabling exploration of complex, non-linear geometric relationships between price and time distinct from traditional linear Fibonacci analysis. Available formulas incorporate various mathematical constants (π, e, φ variants, Silver Ratio) alongside traditional Fibonacci ratios, facilitating investigation into different scaling hypotheses. Furthermore, selecting the Center point relative to the A-B anchors allows these circular time-price patterns to be constructed and analyzed from different geometric perspectives. Analysis can be further tailored through detailed customization of up to 12 Fibonacci levels, including their mathematical values, colors, and visibility..
📚 THEORY and CONCEPT 📚
Fibonacci circles represent an application of Fibonacci principles within technical analysis, extending beyond typical horizontal price levels by incorporating the dimension of time. These geometric constructions traditionally use numerical proportions, often derived from the Fibonacci sequence, to project potential zones of price-time interaction, such as support or resistance. A theoretical understanding of such geometric tools involves considering several core components: the significance of the chosen geometric origin or center point , the mathematical principles governing the proportional scaling of successive radii, and the fundamental calculation considerations (like chart scale adjustments and base radius definitions) that influence the resulting geometry and ensure its accurate representation.
⨀ Circle Center ⨀
The traditional construction methodology for Fibonacci circles begins with the selection of two significant anchor points on the chart, usually representing a key price swing, such as a swing low (Point A) and a subsequent swing high (Point B), or vice versa. This defined segment establishes the primary vector—representing both the price range and the time duration of that specific market move. From these two points, a base distance or radius is derived (this calculation can vary, sometimes using the vertical price distance, the time duration, or the diagonal distance). A center point for the circles is then typically established, often at the midpoint (time and price) between points A and B, or sometimes anchored directly at point B.
Concentric circles are then projected outwards from this center point. The radii of these successive circles are calculated by multiplying the base distance by key Fibonacci ratios and other standard proportions. The underlying concept posits that markets may exhibit harmonic relationships or cyclical behavior that adheres to these proportions, suggesting these expanding geometric zones could highlight areas where future price movements might decelerate, reverse, or find equilibrium, reflecting a potential proportional resonance with the initial defining swing in both price and time.
The Fibonacci Circle Zones indicator enhances traditional Fibonacci circle construction by offering greater analytical depth and flexibility: it addresses the origin point of the circles: instead of being limited to common definitions like the midpoint or endpoint B, this indicator provides a selection of distinct center point calculations relative to the initial A-B swing. The underlying idea is that the geometric source from which harmonic projections emanate might vary depending on the market structure being analyzed. This flexibility allows for experimentation with different center points (derived algorithmically from the A, B, and midpoint coordinates), facilitating exploration of how price interacts with circular zones anchored from various perspectives within the defining swing.
Potential Center Points Setup : This view shows the anchor points A and B , defined by the user, which form the basis of the calculations. The indicator dynamically calculates various potential Center points ( C through N , and X ) based on the A-B structure, representing different geometric origins available for selection in the settings.
Point X holds particular significance as it represents the calculated midpoint (in both time and price) between A and B. This 'X' point corresponds to the default 'Auto' center setting upon initial application of the indicator and aligns with the centering logic used in TradingView's standard Fibonacci Circle tool, offering a familiar starting point.
The other potential center points allow for exploring circles originating from different geometric anchors relative to the A-B structure. While detailing the precise calculation for each is beyond the scope of this overview, they can be broadly categorized: points C through H are derived from relationships primarily within the A-B time/price range, whereas points I through N represent centers projected beyond point B, extrapolating the A-B geometry. Point J, for example, is calculated as a reflection of the A-X midpoint projected beyond B. This variety provides a rich set of options for analyzing circle patterns originating from historical, midpoint, and extrapolated future anchor perspectives.
Default Settings (Center X, FibCircle) : Using the default Center X (calculated midpoint) with the default FibCircle . Although circles begin plotting only after Point B is established, their curvature shows they are geometrically centered on X. This configuration matches the standard TradingView Fib Circle tool, providing a baseline.
Centering on Endpoint B : Using Point B, the user-defined end of the swing, as the Center . This anchors the circular projections directly to the swing's termination point. Unlike centering on the midpoint (X) or start point (A), this focuses the analysis on geometric expansion originating precisely from the conclusion of the measured A-B move.
Projected Center J : Using the projected Point J as the Center . Its position is calculated based on the A-B swing (conceptually, it represents a forward projection related to the A-X midpoint relationship) and is located chronologically beyond Point B. This type of forward projection often allows complete circles to be visualized as price develops into the corresponding time zone.
Time Symmetry Projection (Center L) : Uses the projected Point L as the Center . It is located at the price level of the start point (A), projected forward in time from B by the full duration of the A-B swing . This perspective focuses analysis on temporal symmetry , exploring geometric expansions from a point representing a full time cycle completion anchored back at the swing's origin price level.
⭕ Circle Formula
Beyond the center point , the expansion of the projected circles is determined by the selected Circle Formula . This setting provides different mathematical methods, or scaling options , for scaling the circle radii. Each option applies a distinct mathematical constant or relationship to the base radius derived from the A-B swing, allowing for exploration of various geometric proportions.
eScaled
Mathematical Basis: Scales the radius by Euler's number ( e ≈ 2.718), the base of natural logarithms. This constant appears frequently in processes involving continuous growth or decay.
Enables investigation of market geometry scaled by e , exploring relationships potentially based on natural exponential growth applied to time-price circles, potentially relevant for analyzing phases of accelerating momentum or volatility expansion.
FibCircle
Mathematical Basis: Scales the radius to align with TradingView’s built-in Fibonacci Circle Tool.
Provides a baseline circle size, potentially emulating scaling used in standard drawing tools, serving as a reference point for comparison with other options.
GoldenFib
Mathematical Basis: Scales the radius by the Golden Ratio (φ ≈ 1.618).
Explores the fundamental Golden Ratio proportion, central to Fibonacci analysis, applied directly to circular time-price geometry, potentially highlighting zones reflecting harmonic expansion or retracement patterns often associated with φ.
GoldenContour
Mathematical Basis: Scales the radius by a factor derived from Golden Ratio geometry (√(1 + φ²) / 2 ≈ 0.951). It represents a specific geometric relationship derived from φ.
Allows analysis using proportions linked to the geometry of the Golden Rectangle, scaled to produce circles very close to the initial base radius. This explores structural relationships often associated with natural balance or proportionality observed in Golden Ratio constructions.
SilverRatio
Mathematical Basis: Scales the radius by the Silver Ratio (1 + √2 ≈ 2.414). The Silver Ratio governs relationships in specific regular polygons and recursive sequences.
Allows exploration using the proportions of the Silver Ratio, offering a significant expansion factor based on another fundamental metallic mean for comparison with φ-based methods.
PhiDecay
Mathematical Basis: Scales the radius by φ raised to the power of -φ (φ⁻ᵠ ≈ 0.53). This unique exponentiation explores a less common, non-linear transformation involving φ.
Explores market geometry scaled by this specific phi-derived factor which is significantly less than 1.0, offering a distinct contractile proportion for analysis, potentially relevant for identifying zones related to consolidation phases or decaying momentum.
PhiSquared
Mathematical Basis: Scales the radius by φ squared, normalized by dividing by 3 (φ² / 3 ≈ 0.873).
Enables investigation of patterns related to the φ² relationship (a key Fibonacci extension concept), visualized at a scale just below 1.0 due to normalization. This scaling explores projections commonly associated with significant trend extension targets in linear Fibonacci analysis, adapted here for circular geometry.
PiScaled
Mathematical Basis: Scales the radius by Pi (π ≈ 3.141).
Explores direct scaling by the fundamental circle constant (π), investigating proportions inherent to circular geometry within the market's time-price structure, potentially highlighting areas related to natural market cycles, rotational symmetry, or full-cycle completions.
PlasticNumber
Mathematical Basis: Scales the radius by the Plastic Number (approx 1.3247), the third metallic mean. Like φ and the Silver Ratio, it is the solution to a specific cubic equation and relates to certain geometric forms.
Introduces another distinct fundamental mathematical constant for geometric exploration, comparing market proportions to those potentially governed by the Plastic Number.
SilverFib
Mathematical Basis: Scales the radius by the reciprocal Golden Ratio (1/φ ≈ 0.618).
Explores proportions directly related to the core 0.618 Fibonacci ratio, fundamental within Fibonacci-based geometric analysis, often significant for identifying primary retracement levels or corrective wave structures within a trend.
Unscaled
Mathematical Basis: No scaling applied.
Provides the base circle defined by points A/B and the Center setting without any additional mathematical scaling, serving as a pure geometric reference based on the A-B structure.
🧪 Advanced Calculation Settings
Two advanced settings allow further refinement of the circle calculations: matching the chart's scale and defining how the base radius is calculated from the A-B swing.
The Chart Scale setting ensures geometric accuracy by aligning circle calculations with the chart's vertical axis display. Price charts can use either a standard (linear) or logarithmic scale, where vertical distances represent price changes differently. The setting offers two options:
Standard : Select this option when the price chart's vertical axis is set to a standard linear scale.
Logarithmic : It is necessary to select this option if the price chart's vertical axis is set to a logarithmic scale. Doing so ensures the indicator adjusts its calculations to maintain correct geometric proportions relative to the visual price action on the log-scaled chart.
The Radius Calc setting determines how the fundamental base radius is derived from the A-B swing, offering two primary options:
Auto : This is the default setting and represents the traditional method for radius calculation. This method bases the radius calculation on the vertical price range of the A-B swing, focusing the geometry on the price amplitude.
Geometric : This setting provides an alternative calculation method, determining the base radius from the diagonal distance between Point A and Point B. It considers both the price change and the time duration relative to the chart's aspect ratio, defining the radius based on the overall magnitude of the A-B price-time vector.
This choice allows the resulting circle geometry to be based either purely on the swing's vertical price range ( Auto ) or on its combined price-time movement ( Geometric ).
🖼️ CHART EXAMPLES 🖼️
Default Behavior (X Center, FibCircle Formula) : This configuration uses the midpoint ( Center X) and the FibCircle scaling Formula , representing the indicator's effective default setup when 'Auto' is selected for both options initially. This is designed to match the output of the standard TradingView Fibonacci Circle drawing tool.
Center B with Unscaled Formula : This example shows the indicator applied to an uptrend with the Center set to Point B and the Circle Formula set to Unscaled . This configuration projects the defined levels (0.236, 0.382, etc.) as arcs originating directly from the swing's termination point (B) without applying any additional mathematical scaling from the formulas.
Visualization with Projected Center J : Here, circles are centered on the projected point J, calculated from the A-B structure but located forward in time from point B. Notice how using this forward-projected origin allows complete inner circles to be drawn once price action develops into that zone, providing a distinct visual representation of the expanding geometric field compared to using earlier anchor points. ( Unscaled formula used in this example).
PhiSquared Scaling from Endpoint B : The PhiSquared scaling Formula applied from the user-defined swing endpoint (Point B). Radii expand based on a normalized relationship with φ² (the square of the Golden Ratio), creating a unique geometric structure and spacing between the circle levels compared to other formulas like Unscaled or GoldenFib .
Centering on Swing Origin (Point A) : Illustrates using Point A, the user-defined start of the swing, as the circle Center . Note the significantly larger scale and wider spacing of the resulting circles. This difference occurs because centering on the swing's origin (A) typically leads to a larger base radius calculation compared to using the midpoint (X) or endpoint (B). ( Unscaled formula used).
Center Point D : Point D, dynamically calculated from the A-B swing, is used as the origin ( Center =D). It is specifically located at the price level of the swing's start point (A) occurring precisely at the time coordinate of the swing's end point (B). This offers a unique perspective, anchoring the geometric expansion to the initial price level at the exact moment the defining swing concludes. ( Unscaled formula shown).
Center Point G : Point G, also dynamically calculated from the A-B swing, is used as the origin ( Center =G). It is located at the price level of the swing's endpoint (B) occurring at the time coordinate of the start point (A). This provides the complementary perspective to Point D, anchoring the geometric expansion to the final price level achieved but originating from the moment the swing began . As observed in the example, using Point G typically results in very wide circle projections due to its position relative to the core A-B action. ( Unscaled formula shown).
Center Point I: Half-Duration Projection : Using the dynamically calculated Point I as the Center . Located at Point B's price level but projected forward in time by half the A-B swing duration , Point I's calculated time coordinate often falls outside the initially visible chart area. As the chart progresses, this origin point will appear, revealing large, sweeping arcs representing geometric expansions based on a half-cycle temporal projection from the swing's endpoint price. ( Unscaled formula shown).
Center Point M : Point M, also dynamically calculated from the A-B swing, serves as the origin ( Center =M). It combines the midpoint price level (derived from X) with a time coordinate projected forward from Point B by the full duration of the A-B swing . This perspective anchors the geometric expansion to the swing's balance price level but originates from the completion point of a full temporal cycle relative to the A-B move. Like other projected centers, using M allows for complete circles to be visualized as price progresses into its time zone. ( SilverFib formula shown).
Geometric Validation & Functionality : Comparing the indicator (red lines), using its default settings ( Center X, FibCircle Formula ), against TradingView's standard Fib Circle tool (green lines/white background). The precise alignment, particularly visible at the 1.50 and 2.00 levels shown, validates the core geometry calculation.
🛠️ CONFIGURATION AND SETTINGS 🛠️
The Fibonacci Circle Zones indicator offers a range of configurable settings to tailor its functionality and visual representation. These options allow customization of the circle origin, scaling method, level visibility, visual appearance, and input points.
Center and Formula
Settings for selecting the circle origin and scaling method.
Center : Dropdown menu to select the origin point for the circles.
Auto : Automatically uses point X (the calculated midpoint between A and B).
Selectable points including start/end (A, B), midpoint (X), plus various points derived from or projected beyond the A-B swing (C-N).
Circle Formula : Dropdown menu to select the mathematical method for scaling circle radii.
Auto : Automatically selects a default formula ('FibCircle' if Center is 'X', 'Unscaled' otherwise).
Includes standard Fibonacci scaling ( FibCircle, GoldenFib ), other mathematical constants ( PiScaled, eScaled ), metallic means ( SilverRatio ), phi transformations ( PhiDecay, PhiSquared ), and others.
Fib Levels
Configuration options for the 12 individual Fibonacci levels.
Advanced Settings
Settings related to core calculation methods.
Radius Calc : Defines how the base radius is calculated (e.g., 'Auto' for vertical price range, 'Geometric' for diagonal price-time distance).
Chart Scale : Aligns circle calculations with the chart's vertical axis setting ('Standard' or 'Logarithmic') for accurate visual proportions.
Visual Settings
Settings controlling the visual display of the indicator elements.
Plots : Dropdown controlling which parts of the calculated circles are displayed ( Upper , All , or Lower ).
Labels : Dropdown controlling the display of the numerical level value labels ( All , Left , Right , or None ).
Setup : Dropdown controlling the visibility of the initial setup graphics ( Show or Hide ).
Info : Dropdown controlling the visibility of the small information table ( Show or Hide ).
Text Size : Adjusts the font size for all text elements displayed by the indicator (Value ranges from 0 to 36).
Line Width : Adjusts the width of the circle plots (1-10).
Time/Price
Inputs for the anchor points defining the base swing.
These settings define the start (Point A) and end (Point B) of the price swing used for all calculations.
Point A (Time, Price) : Input fields for the exact time coordinate and price level of the swing's starting point (A).
Point B (Time, Price) : Input fields for the exact time coordinate and price level of the swing's ending point (B).
Interactive Adjustment : Points A and B can typically be adjusted directly by clicking and dragging their markers on the chart (if 'Setup' is set to 'Show'). Changes update settings automatically.
📝 NOTES 📝
Fibonacci circles begin plotting only once the time corresponding to Point B has passed and is confirmed on the chart. While potential center locations might be visible earlier (as shown in the setup graphic), the final circle calculations require the complete geometry of the A-B swing. This approach ensures that as new price bars form, the circles are accurately rendered based on the finalized A-B relationship and the chosen center and scaling.
The indicator's calculations are anchored to user-defined start (A) and end (B) points on the chart. When switching between charts with significantly different price scales (e.g., from an index at 5,000 to a crypto asset at $0.50), it is typically necessary to adjust these anchor points to ensure the circle elements are correctly positioned and scaled.
⚠️ DISCLAIMER ⚠️
The Fibonacci Circle Zones indicator is a visual analysis tool designed to illustrate Fibonacci relationships through geometric constructions incorporating curved lines, providing a structured framework for identifying potential areas of price interaction. Like all technical and visual indicators, these visual representations may visually align with key price zones in hindsight, reflecting observed price dynamics. It is not intended as a predictive or standalone trading signal indicator.
The indicator calculates levels and projections using user-defined anchor points and Fibonacci ratios. While it aims to align with TradingView’s standard Fibonacci circle tool by employing mathematical and geometric formulas, no guarantee is made that its calculations are identical to TradingView's proprietary methods.
🧠 BEYOND THE CODE 🧠
The Fibonacci Circle Zones indicator, like other xxattaxx indicators , is designed with education and community collaboration in mind. Its open-source nature encourages exploration, experimentation, and the development of new Fibonacci and grid calculation indicators and tools. We hope this indicator serves as a framework and a starting point for future Innovation and discussions.

Buy on 5% dip strategy with time adjustment
This script is a strategy called "Buy on 5% Dip Strategy with Time Adjustment 📉💡," which detects a 5% drop in price and triggers a buy signal 🔔. It also automatically closes the position once the set profit target is reached 💰, and it has additional logic to close the position if the loss exceeds 14% after holding for 230 days ⏳.
Strategy Explanation
Buy Condition: A buy signal is triggered when the price drops 5% from the highest price reached 🔻.
Take Profit: The position is closed when the price hits a 1.22x target from the average entry price 📈.
Forced Sell Condition: If the position is held for more than 230 days and the loss exceeds 14%, the position is automatically closed 🚫.
Leverage & Capital Allocation: Leverage is adjustable ⚖️, and you can set the percentage of capital allocated to each trade 💸.
Time Limits: The strategy allows you to set a start and end time ⏰ for trading, making the strategy active only within that specific period.
Code Credits and References
Credits: This script utilizes ideas and code from @QuantNomad and jangdokang for the profit table and algorithm concepts 🔧.
Sources:
Monthly Performance Table Script by QuantNomad:
ZenAndTheArtOfTrading's Script:
Strategy Performance
This strategy provides risk management through take profit and forced sell conditions and includes a performance table 📊 to track monthly and yearly results. You can compare backtest results with real-time performance to evaluate the strategy's effectiveness.
The performance numbers shown in the backtest reflect what would have happened if you had used this strategy since the launch date of the SOXL (the Direxion Daily Semiconductor Bull 3x Shares ETF) 📅. These results are not hypothetical but based on actual performance from the day of the ETF’s launch 📈.
Caution ⚠️
No Guarantee of Future Results: The results are based on historical performance from the launch of the SOXL ETF, but past performance does not guarantee future results. It’s important to approach with caution when applying it to live trading 🔍.
Risk Management: Leverage and capital allocation settings are crucial for managing risk ⚠️. Make sure to adjust these according to your risk tolerance ⚖️.

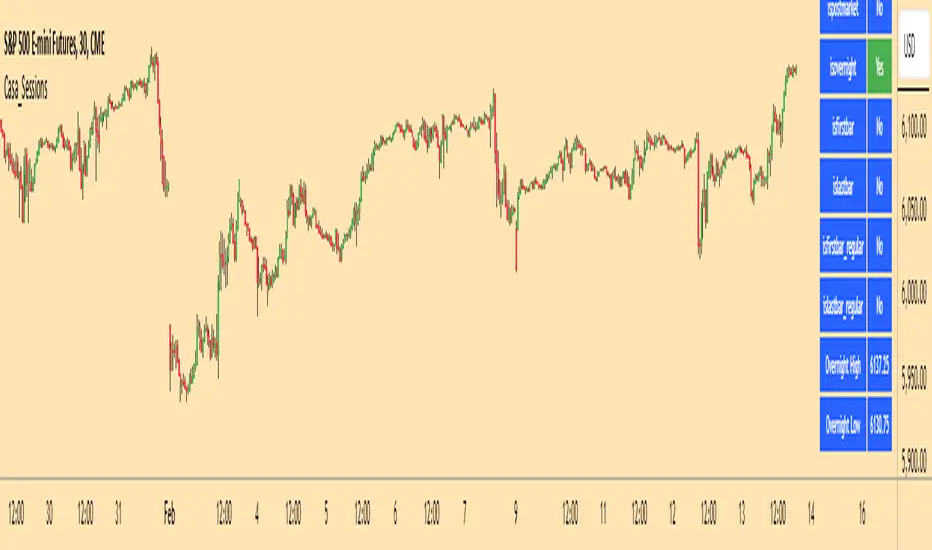
Casa_SessionsLibrary "Casa_Sessions"
Advanced trading session management library that enhances TradingView's default functionality:
Key Features:
- Accurate session detection for futures markets
- Custom session hour definitions
- Drop-in replacements for standard TradingView session functions
- Flexible session map customization
- Full control over trading windows and market hours
Perfect for traders who need precise session timing, especially when working
with futures markets or custom trading schedules.
SetSessionTimes(session_type_input, custom_session_times_input, syminfo_type, syminfo_root, syminfo_timezone)
Parameters:
session_type_input (simple string) : Input string for session selection:
- 'Custom': User-defined session times
- 'FX-Tokyo': Tokyo forex session
- 'FX-London': London forex session
- 'FX-New York': NY forex session
- 'Overnight Session (ON)': After-hours trading
- 'Day Session (RTH)': Regular trading hours
custom_session_times_input (simple string) : Session parameter for custom time windows
Only used when session_type_input is 'Custom'
syminfo_type (simple string)
syminfo_root (simple string)
syminfo_timezone (simple string)
Returns:
session_times: Trading hours for selected session
session_timezone: Market timezone (relevant for forex)
getSessionMap()
Get futures trading session hours map
Keys are formatted as 'symbol:session', examples:
- 'ES:market' - Regular trading hours (RTH)
- 'ES:overnight' - Extended trading hours (ETH)
- 'NQ:market' - NASDAQ futures RTH
- 'CL:overnight' - Crude Oil futures ETH
Returns: Map
Key: Symbol:session identifier
Value: Session hours in format "HH:MM-HH:MM"
getSessionString(session, symbol, sessionMap)
Returns a session string representing the session hours (and days) for the requested symbol (or the chart's symbol if the symbol value is not provided). If the session string is not found in the collection, it will return a blank string.
Parameters:
session (string) : A string representing the session hour being requested. One of: market (regular trading hours), overnight (extended/electronic trading hours), postmarket (after-hours), premarket
symbol (string) : The symbol to check. Optional. Defaults to chart symbol.
sessionMap (map) : The map of futures session hours. Optional. Uses default if not provided.
inSession(session, sessionMap, barsBack)
Returns true if the current symbol is currently in the session parameters defined by sessionString.
Parameters:
session (string) : A string representing the session hour being requested. One of: market (regular trading hours), overnight (extended/electronic trading hours), postmarket (after-hours), premarket
sessionMap (map) : The map of futures session hours. Optional. Uses default if not provided.
barsBack (int) : Private. Only used by futures to check islastbar. Optional. The default is 0.
ismarket(sessionMap)
Returns true if the current bar is a part of the regular trading hours (i.e. market hours), false otherwise. Works for futures (TradingView's methods do not).
Parameters:
sessionMap (map) : The map of futures session hours. Optional. Uses default if not provided.
Returns: bool
isfirstbar()
Returns true if the current bar is the first bar of the day's session, false otherwise. If extended session information is used, only returns true on the first bar of the pre-market bars. Works for futures (TradingView's methods do not).
Returns: bool
islastbar()
Returns true if the current bar is the last bar of the day's session, false otherwise. If extended session information is used, only returns true on the last bar of the post-market bars. Works for futures (TradingView's methods do not).
Returns: bool
ispremarket(sessionMap)
Returns true if the current bar is a part of the pre-market, false otherwise. On non-intraday charts always returns false. Works for futures (TradingView's methods do not).
Parameters:
sessionMap (map) : The map of futures session hours. Optional. Uses default if not provided.
Returns: bool
ispostmarket(sessionMap)
Returns true if the current bar is a part of the post-market, false otherwise. On non-intraday charts always returns false. Works for futures (TradingView's methods do not).
Parameters:
sessionMap (map) : The map of futures session hours. Optional. Uses default if not provided.
Returns: bool
isfirstbar_regular(sessionMap)
Returns true on the first regular session bar of the day, false otherwise. The result is the same whether extended session information is used or not. Works for futures (TradingView's methods do not).
Parameters:
sessionMap (map) : The map of futures session hours. Optional. Uses default if not provided.
Returns: bool
islastbar_regular(sessionMap)
Returns true on the last regular session bar of the day, false otherwise. The result is the same whether extended session information is used or not. Works for futures (TradingView's methods do not).
Parameters:
sessionMap (map) : The map of futures session hours. Optional. Uses default if not provided.
Returns: bool
isovernight(sessionMap)
Returns true if the current bar is a part of the pre-market or post-market, false otherwise. On non-intraday charts always returns false.
Parameters:
sessionMap (map) : The map of futures session hours. Optional. Uses default if not provided.
Returns: bool
getSessionHighAndLow(session, sessionMap)
Returns a tuple containing the high and low print during the specified session.
Parameters:
session (string) : The session for which to get the high & low prints. Defaults to market.
sessionMap (map) : The map of futures session hours. Optional. Uses default if not provided.
Returns: A tuple containing
getSessionHigh(session, sessionMap)
Convenience function to return the session high. Necessary if you want to call this function from within a request.security expression where you can't return a tuple.
Parameters:
session (string) : The session for which to get the high & low prints. Defaults to market.
sessionMap (map) : The map of futures session hours. Optional. Uses default if not provided.
Returns: The high of the session
getSessionLow(session, sessionMap)
Convenience function to return the session low. Necessary if you want to call this function from within a request.security expression where you can't return a tuple.
Parameters:
session (string) : The session for which to get the high & low prints. Defaults to market.
sessionMap (map) : The map of futures session hours. Optional. Uses default if not provided.
Returns: The low of the session
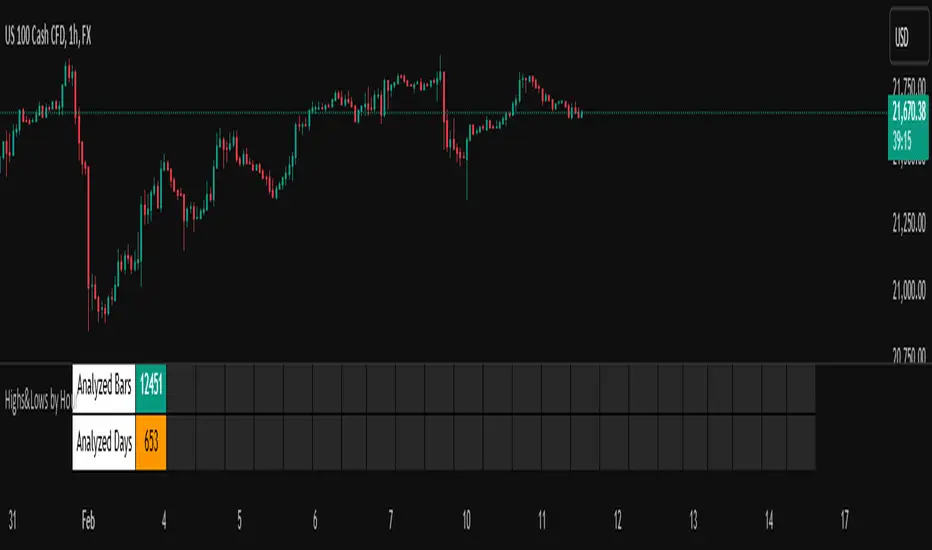
Highs&Lows by HourHighs & Lows by Hour
Description:
Highs & Lows by Hour is a TradingView indicator that helps traders identify the most frequent hours at which daily high and low price points occur. By analyzing historical price data directly from the TradingView chart, this tool provides valuable insights into market timing, allowing traders to optimize their strategies around key price movements.
This indicator is specifically designed for the one-hour (H1) timeframe . It does not display any data on other timeframes , as it relies on analyzing daily highs and lows within hourly periods.
This indicator processes the available data based on the number of historical bars loaded in the TradingView chart. The number of analyzed bars depends on the TradingView subscription plan , which determines how much historical data is accessible.
Key Features:
Works exclusively on the H1 timeframe , ensuring accurate analysis of daily highs and lows
Hourly highs and lows analysis to identify the most frequent hours when the market reaches its daily high and low
Sorted by frequency, displaying the most significant trading hours in descending order based on their recurrence
Customizable table and colors to fit the chart theme and trading style
Useful for scalpers, day traders, and swing traders to anticipate potential price reversals and breakouts
How It Works:
The indicator scans historical price data directly from the TradingView chart to detect the hour at which daily highs and daily lows occur.
It counts the frequency of highs and lows for each hour of the trading day based on the number of available bars in the TradingView chart.
The recorded data is displayed in a structured table, sorted by frequency from highest to lowest.
Users can customize colors to enhance readability and seamlessly integrate the indicator into their analysis.
Why Use This Indicator?
Identify key market patterns by recognizing the most critical hours when price extremes tend to form
Improve timing for trades by aligning entries and exits with high-probability time windows
Enhance market awareness by understanding when market volatility is likely to peak based on historical trends
Important Notes:
This indicator works only on the one-hour (H1) timeframe . It will not display any data on other timeframes
Works well on Forex, stocks, crypto, and futures , especially for intraday traders
The indicator analyzes only the historical bars available on the TradingView chart, which varies depending on the TradingView subscription plan (Free, Pro, Pro+, Premium)
This indicator does not generate buy or sell signals but serves as a data-driven tool for market analysis
How to Use:
Apply the Highs & Lows by Hour indicator to a one-hour (H1) chart on TradingView
Review the table displaying the most frequent hours for daily highs and lows
Adjust colors and settings for better visualization
Use the data to refine trading decisions and align strategy with historical price behavior
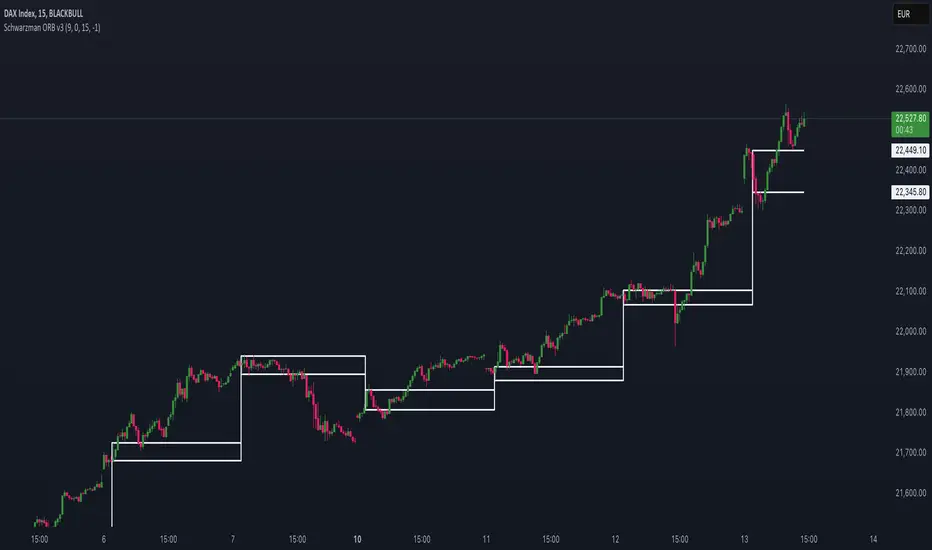
Schwarzman Custom ORB with Box DisplayIndicator Overview
The Schwarzman Custom ORB (Opening Range Breakout) Indicator is a fully self-developed script designed for traders who utilize opening range breakout strategies. This indicator allows users to customize their ORB settings, apply them to historical price data, and visually connect multiple ORBs to analyze past performance. The goal is to provide traders with a tool to backtest and refine their breakout strategies based on historical ORB data.
How the Indicator Works
1️⃣ User-Defined ORB Settings
• The user selects a custom start time (hour and minute) for the ORB.
• The user defines a duration (e.g., 15 minutes, 30 minutes, etc.) for the ORB period.
• A timezone offset is included to adjust for different market sessions.
2️⃣ ORB High and Low Calculation
• The script records the highest and lowest prices within the selected ORB time window.
• The recorded values remain static after the ORB period ends, ensuring accurate range plotting.
3️⃣ Historical ORB Visualization
• Instead of only showing a single ORB for the current session, this indicator connects multiple ORBs across past data.
• This allows traders to visually analyze previous breakout performance.
• The plotted ORBs remain fixed and do not repaint, ensuring an accurate backtesting experience.
4️⃣ Stepline Visualization & Range Filling
• The high and low ORB levels are displayed using stepline plots to maintain clear horizontal levels.
• A shaded box is applied between the ORB high and low for better visualization.
Use Cases & Strategy Application
📌 Backtesting Historical ORBs – See how past ORBs performed under different market conditions.
📌 Custom ORB Settings – Adjust the start time and duration for different trading sessions.
📌 Multi-ORB Analysis – Connect ORBs over multiple trading days to study trends and breakouts.
📌 Breakout Strategy Optimization – Use the historical ORB connections to refine entry and exit points.
This indicator is particularly useful for day traders, scalpers, and breakout traders looking for a data-driven approach to trading.
Indicator Development & Transparency Statement
As a trader, I have tested various ORB (Opening Range Breakout) indicators available in the TradingView community. Through these experiences, I aimed to develop a version that best fits my own trading needs and strategy.
This script is a self-developed ORB tool, created from scratch while drawing inspiration from the concept of opening range breakouts, which is widely used in trading. Since I initially coded in Pine Script v4, I used ChatGPT to help refine and migrate the script to Pine Script v6 to ensure compatibility with the latest TradingView features. However, the core logic, structure, and customization were entirely designed and implemented based on my own approach.
I am making this indicator public not to violate any TradingView guidelines but to share my work with the trading community and provide a tool that can help others analyze ORB-based strategies. If there are any compliance concerns, I am open to adjusting the script accordingly, but I want to clarify that this is not a copy of any existing ORB script—it is a custom-built indicator tailored to my own trading preferences.
I appreciate the opportunity to contribute to the community and would welcome any specific feedback from TradingView regarding rule compliance.
Best regards,
Janko S. (Schwarzman)
Appeal to TradingView
Dear TradingView Team,
This script is 100% self-developed and does not copy or replicate any third-party code. It is a customized ORB tool designed for traders who wish to backtest and analyze opening range breakout strategies over multiple sessions. We kindly request specific clarification regarding which exact line(s) of code violate TradingView’s guidelines. If there are any compliance concerns, we are happy to adjust the script accordingly.
Please let us know the precise rules or community guidelines that were violated so we can make the necessary modifications.
🚀 Summary
✔ Fully Custom & Self-Developed – No copied or third-party code.
✔ Innovative Feature – Connects past ORBs for strategy backtesting.
✔ Transparent & Compliant – Requesting exact details on any potential rule violations.
Fibonacci Time-Price Zones🟩 Fibonacci Time-Price Zones is a chart visualization tool that combines Fibonacci ratios with time-based and price-based geometry to analyze market behavior. Unlike typical Fibonacci indicators that focus solely on horizontal price levels, this indicator incorporates time into the analysis, providing a more dynamic perspective on price action.
The indicator offers multiple ways to visualize Fibonacci relationships. Drawing segmented circles creates a unique perspective on price action by incorporating time into the analysis. These segmented circles, similar to TradingView's built-in Fibonacci Circles, are derived from Fibonacci time and price levels, allowing traders to identify potential turning points based on the dynamic interaction between price and time.
As another distinct visualization method, the indicator incorporates orthogonal patterns, created by the intersection of horizontal and vertical Fibonacci levels. These intersections form L-shaped connections on the chart, derived from key Fibonacci price and time intervals, highlighting potential areas of support or resistance at specific points in time.
In addition to these geometric approaches, another option is sloped lines, which project Fibonacci levels that account for both time and price along the trendline. These projections derive their angles from the interplay between Fibonacci price levels and Fibonacci time intervals, creating dynamic zones on the chart. The slope of these lines reflects the direction and angle of the trend, providing a visual representation of price alignment with market direction, while maintaining the time-price relationship unique to this indicator
The indicator also includes horizontal Fibonacci levels similar to traditional retracement and extension tools. However, unlike standard tools, traders can display retracement levels, extension levels, or both simultaneously from a single instance of the indicator. These horizontal levels maintain consistency with the chosen visualization method, automatically scaling and adapting whether used with circles, orthogonal patterns, or slope-based analysis.
By combining these distinct methods—circles, orthogonal patterns, sloped projections, and horizontal levels—the indicator provides a comprehensive approach to Fibonacci analysis based on both time and price relationships. Each visualization method offers a unique perspective on market structure while maintaining the core principle of time-price interaction.
⭕ THEORY AND CONCEPT ⭕
While traditional Fibonacci tools excel at identifying potential support and resistance levels through price-based ratios (0.236, 0.382, 0.618), they do not incorporate the dimension of time in market analysis. Extensions and retracements effectively measure price relationships within trends, yet markets move through both price and time dimensions simultaneously.
Fibonacci circles represent an evolution in technical analysis by incorporating time intervals alongside price levels. Based on the mathematical principle that markets often move in circular patterns proportional to Fibonacci ratios, these circles project potential support and resistance zones as partial circles radiating from significant price points. However, traditional circle-based tools can create visual complexity that obscures key market relationships. The integration of time into Fibonacci analysis reveals how price movements often respect both temporal and price-based ratios, suggesting a deeper geometric structure to market behavior.
The Fibonacci Time-Price Zones indicator advances these concepts by providing multiple geometric approaches to visualize time-price relationships. Each shape option—circles, orthogonal patterns, slopes, and horizontal levels—represents a different mathematical perspective on how Fibonacci ratios manifest across both dimensions. This multi-faceted approach allows traders to observe how price responds to Fibonacci-based zones that account for both time and price movements, potentially revealing market structure that purely price-based tools might miss.
Shape Options
The indicator employs four distinct geometric approaches to analyze Fibonacci relationships across time and price dimensions:
Circular : Represents the cyclical nature of market movements through partial circles, where each radius is scaled by Fibonacci ratios incorporating both time and price components. This geometry suggests market movements may follow proportional circular paths from significant pivot points, reflecting the harmonic relationship between time and price.
Orthogonal : Constructs L-shaped patterns that separate the time and price components of Fibonacci relationships. The horizontal component represents price levels, while the vertical component measures time intervals, allowing analysis of how these dimensions interact independently at key market points.
Sloped : Projects Fibonacci levels along the prevailing trend, incorporating both time and price in the angle of projection. This approach suggests that support and resistance levels may maintain their relationship to price while adjusting to the temporal flow of the market.
Horizontal : Provides traditional static Fibonacci levels that serve as a reference point for comparing price-only analysis with the dynamic time-price relationships shown in the other three shapes. This baseline approach allows traders to evaluate how the incorporation of time dimension enhances or modifies traditional Fibonacci analysis.
By combining these geometric approaches, the Fibonacci Time-Price Zones indicator creates a comprehensive analytical framework that bridges traditional and advanced Fibonacci analysis. The horizontal levels serve as familiar reference points, while the dynamic elements—circular, orthogonal, and sloped projections—reveal how price action responds to temporal relationships. This multi-dimensional approach enables traders to study market structure through various geometric lenses, providing deeper insights into time-price symmetry within technical analysis. Whether applied to retracements, extensions, or trend analysis, the indicator offers a structured methodology for understanding how markets move through both price and time dimensions.
🛠️ CONFIGURATION AND SETTINGS 🛠️
The Fibonacci Time-Price Zones indicator offers a range of configurable settings to tailor its functionality and visual representation to your specific analysis needs. These options allow you to customize zone visibility, structures, horizontal lines, and other features.
Important Note: The indicator's calculations are anchored to user-defined start and end points on the chart. When switching between charts with significantly different price scales (e.g., from Bitcoin at $100,000 to Silver at $30), adjustment of these anchor points is required to ensure correct positioning of the Fibonacci elements.
Fibonacci Levels
The indicator allows users to customize Fibonacci levels for both retracement and extension analysis. Each level can be individually configured with the following options:
Visibility : Toggle the visibility of each level to focus on specific areas of interest.
Level Value : Set the Fibonacci ratio for the level, such as 0.618 or 1.000, to align with your analysis needs.
Color : Customize the color of each level for better visual clarity.
Line Thickness : Adjust the line thickness to emphasize critical levels or maintain a cleaner chart.
Setup
Zone Type : Select which Fibonacci zones to display:
- Retracement : Shows potential pull back levels within the trend
- Extension : Projects levels beyond the trend for potential continuation targets
- Both : Displays both retracement and extension zones simultaneously
Shape : Choose from four visualization methods:
- Circular : Time-price based semicircles centered on point B
- Orthogonal : L-shaped patterns combining time and price levels
- Sloped : Trend-aligned projections of Fibonacci levels
- Horizontal : Traditional horizontal Fibonacci levels
Visual Settings
Fill % : Adjusts the fill intensity of zones:
0% : No fill between levels
100% : Maximum fill between levels
Lines :
Trendline : The base A-B trend with customizable color
Extension : B-C projection line
Retracement : B-D pullback line
Labels :
Points : Show/hide A, B, C, D markers
Levels : Show/hide Fibonacci percentages
Time-Price Points
Set the time and price for the points that define the Fibonacci zones and horizontal levels. These points are defined upon loading the chart. These points can be configured directly in the settings or adjusted interactively on the live chart.
A and B Points : These user-defined time and price points determine the basis for calculating the semicircles and Fibonacci levels. While the settings panel displays their exact values for fine-tuning, the easiest way to modify these points is by dragging them directly on the chart for quick adjustments.
Interactive Adjustments : Any changes made to the points on the chart will automatically synchronize with the settings panel, ensuring consistency and precision.
🖼️ CHART EXAMPLES 🖼️
Fibonacci Time-Price Zones using the 'Circular' Shape option. Note the price interaction at the 0.786 level, which acts as a support zone. Additional points of interest include resistance near the 0.618 level and consolidation around the 0.5 level, highlighting the utility of both horizontal and semicircular Fibonacci projections in identifying key price areas.
Fibonacci Time-Price Zones using the 'Sloped' Shape option. The chart displays price retracing along the sloped Fibonacci levels, with blue arrows highlighting potential support zones at 0.618 and 0.786, and a red arrow indicating potential resistance at the 1.0 level. This visual representation aligns with the prevailing downtrend, suggesting potential selling pressure at the 1.0 Fibonacci level.
Fibonacci Time-Price Zones using the 'Orthogonal' Shape option. The chart demonstrates price action interacting with vertical zones created by the orthogonal lines at the 0.618, 0.786, and 1.0 Fibonacci levels. Blue arrows highlight potential support areas, while red arrows indicate potential resistance areas, revealing how the orthogonal lines can identify distinct points of price interaction.
Fibonacci Time-Price Zones using the 'Circular' Shape option. The chart displays price action in relation to segmented circles emanating from the starting point (point A). The circles represent different Fibonacci ratios (0.382, 0.5, 0.618, 0.786) and their intersections with the price axis create potential zones of support and resistance. This approach offers a visually distinct way to analyze potential turning points based on both price and time.
Fibonacci Time-Price Zones using the 'Sloped' Shape option. The sloped Fibonacci levels (0.786, 0.618, 0.5) create zones of potential support and resistance, with price finding clear interaction within these areas. The ellipses highlight this price action, particularly the support between 0.786 and 0.618, which aligns closely with the trend.
Fibonacci Time-Price Zones using the 'Circular' Shape option. The price action appears to be ‘hugging’ the 0.5 Fibonacci level, suggesting potential resistance. This demonstrates how the circular zones can identify potential turning points and areas of consolidation which might not be seen with linear analysis.
Fibonacci Time-Price Zones using the 'Sloped' Shape option with Point D marker enabled. The chart demonstrates clear price action closely following along the sloped Retracement line until the orthogonal intersection at the 0.618 levels where the trend is broken and price dips throughout the 0.618 to 0.786 horizontal zone. Price jumps back to the retracement slope at the start of the 0.786 horizontal zone and continues to the 1.0 horizontal zone. The aqua-colored retracement line is enabled to further emphasize this retracement slope .
Geometric validation using TradingView's built-in Fibonacci Circle tool (overlaid). The alignment at the 0.5 and 1.0 levels demonstrates the indicator's consistent approximation of Fibonacci Circles.
Comparison of Fibonacci Time-Price Zones (Shape: Horizontal) with TradingView's Built-in Retracement and Extension Tools (overlaid): This example demonstrates how the Horizontal structure aligns with TradingView’s retracement and extension levels, allowing users to integrate multiple tools seamlessly. The Fibonacci circle connects retracement and extension zones, highlighting the potential relationship between past retracements and future extensions.
📐 GEOMETRIC FOUNDATIONS 📐
This indicator integrates circular and straight representations of Fibonacci levels, specifically the Circular , Orthogonal , Sloped , and Horizontal shape options. The geometric principles behind these shapes differ significantly, requiring distinct scaling methods for accurate representation. The Circular shape employs logarithmic scaling with radial expansion, where the distance from a central point determines the level's position, creating partial circles that align with TradingView's built-in Fibonacci Circle tool. The other three shapes utilize geometric progression scaling for linear extension from a starting point, resulting in straight lines that align with TradingView's built-in Fibonacci retracement and extension tools. Due to these distinct geometric foundations and scaling methods, perfectly aligning both the partial circles and straight lines simultaneously is mathematically constrained, though any differences are typically visually imperceptible.
The Circular shape's partial circles are calculated and scaled to align with TradingView's built-in Fibonacci Circles. These circles are plotted from the second swing point onward. This approach ensures consistent and accurate visualization across all market types, including those with gaps or closed sessions, which unlike 24/7 markets, do not have a direct one-to-one correspondence between bar indices and time. To maintain accurate geometric proportions across varying chart scales, the indicator calculates an aspect ratio by normalizing the proportional difference between vertical (price) and horizontal (time) distances of the swing points. This normalization factor ensures geometric shapes maintain their mathematical properties regardless of price scale magnitude or time period span, while maintaining the correct proportions of the geometric constructions at any chart zoom level.
The indicator automatically applies the appropriate scaling factor based on the selected shape option, optimizing either circular proportions and proper radius calculations for each Fibonacci level, or straight-line relationships between Fibonacci levels. These distinct scaling approaches maintain mathematical integrity while preserving the essential characteristics of each geometric representation, ensuring optimal visualization accuracy whether using circular or linear shapes.
⚠️ DISCLAIMER ⚠️
The Fibonacci Time-Price Zones indicator is a visual analysis tool designed to illustrate Fibonacci relationships through geometric constructions incorporating both curved and straight lines, providing a structured framework for identifying potential areas of price interaction. It is not intended as a predictive or standalone trading signal indicator.
The indicator calculates levels and projections using user-defined anchor points and Fibonacci ratios. While it aims to align with TradingView’s Fibonacci extension, retracement, and circle tools by employing mathematical and geometric formulas, no guarantee is made that its calculations are identical to TradingView's proprietary methods.
Like all technical and visual indicators, these visual representations may visually align with key price zones in hindsight, reflecting observed price dynamics. However, these visualizations are not standalone signals for trading decisions and should be interpreted as part of a broader analytical approach.
This indicator is intended for educational and analytical purposes, complementing other tools and methods of market analysis. Users are encouraged to integrate it into a comprehensive trading strategy, customizing its settings to suit their specific needs and market conditions.
🧠 BEYOND THE CODE 🧠
The Fibonacci Time-Price Zones indicator is designed to encourage both education and community engagement. By integrating time-sensitive geometry with Fibonacci-based frameworks, it bridges traditional grid-based analysis with dynamic time-price relationships. The inclusion of semicircles, horizontal levels, orthogonal structures, and sloped trends provides users with versatile tools to explore the interaction between price movements and temporal intervals while maintaining clarity and adaptability.
As an open-source tool, the indicator invites exploration, experimentation, and customization. Whether used as a standalone resource or alongside other technical strategies, it serves as a practical and educational framework for understanding market structure and Fibonacci relationships in greater depth.
Your feedback and contributions are essential to refining and enhancing the Fibonacci Time-Price Zones indicator. We look forward to the creative applications, adaptations, and insights this tool inspires within the trading community.

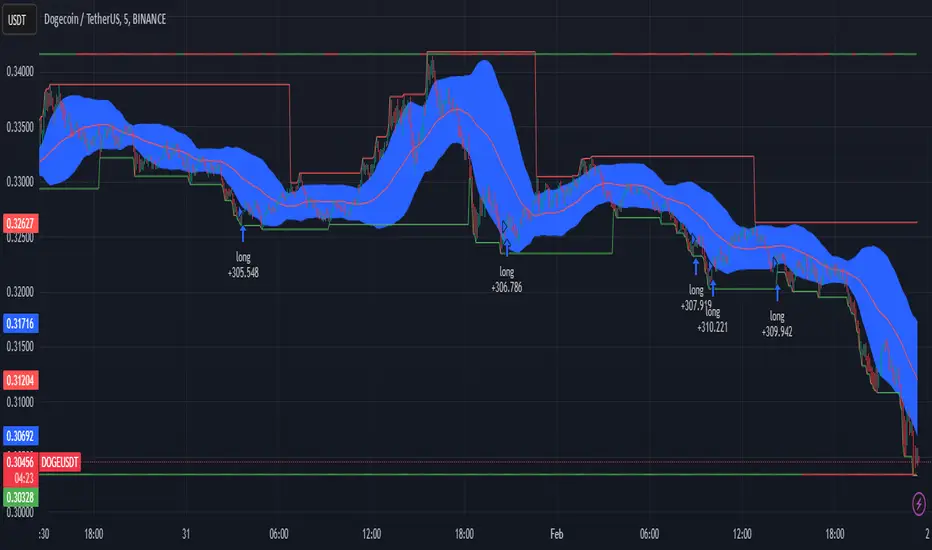
DCA, Support and Resistance with RSI and Trend FilterThis script is based on
script from Kieranj with added pyramiding and DCA
The buy condition (buyCondition) is triggered when the RSI crosses above the oversold threshold (ta.crossover(rsi, oversoldThreshold)), the trend filter confirms an uptrend (isUptrend is true), and the close price is greater than or equal to the support level (close >= supportLevel).
The partial sell condition (sellCondition) is triggered when the RSI crosses below the overbought threshold (ta.crossunder(rsi, overboughtThreshold)) and profit goal is reached, the trend filter confirms a downtrend (isUptrend is false), and the close price is less than or equal to the resistance level (close <= resistanceLevel).
Full sell will be triggered if trend is broken and profit goal is reached
With this implementation, the signals will only be generated in the direction of the trend on the 4-hour timeframe. The trend is considered up when the 50-period SMA is below the 200-period SMA (ta.sma(trendFilterSource, 50) < ta.sma(trendFilterSource, 200)).
Pyramiding should be activated, values like 100, so every DCA step should be around 1%
i have best results on 5 min charts
SessionLibrary "Session"
Helper functions for trading sessions. TradingView doesn't provide correct data when
calling some of the convenience methods like session.ismarket when you are looking at futures charts. This library corrects those mistakes by providing functions with the same names as the TradingView default properties. that reference a custom defined set of session hours for futures. It also provides a way for consumers to customize the map values by calling getSessionMap() and then overwriting (or adding) custom session definitions.
getSessionMap()
Returns a map of the futures rth & eth session hours. The map is keyed with symbol:session format (eg. ES:market or ES:overnight).
Returns: A map of futures symbols and their associated session hours.
getSessionString(session, symbol, sessionMap)
Returns a session string representing the session hours (and days) for the requested symbol (or the chart's symbol if the symbol value is not provided). If the session string is not found in the collection, it will return a blank string.
Parameters:
session (string) : A string representing the session hour being requested. One of: market (regular trading hours), overnight (extended/electronic trading hours), postmarket (after-hours), premarket
symbol (string) : The symbol to check. Optional. Defaults to chart symbol.
sessionMap (map) : The map of futures session hours. Optional. Uses default if not provided.
inSession(session, sessionMap, barsBack)
Returns true if the current symbol is currently in the session parameters defined by sessionString.
Parameters:
session (string) : A string representing the session hour being requested. One of: market (regular trading hours), overnight (extended/electronic trading hours), postmarket (after-hours), premarket
sessionMap (map) : The map of futures session hours. Optional. Uses default if not provided.
barsBack (int) : Private. Only used by futures to check islastbar. Optional. The default is 0.
ismarket(sessionMap)
Returns true if the current bar is a part of the regular trading hours (i.e. market hours), false otherwise. Works for futures (TradingView's methods do not).
Parameters:
sessionMap (map) : The map of futures session hours. Optional. Uses default if not provided.
Returns: bool
isfirstbar()
Returns true if the current bar is the first bar of the day's session, false otherwise. If extended session information is used, only returns true on the first bar of the pre-market bars. Works for futures (TradingView's methods do not).
Returns: bool
islastbar()
Returns true if the current bar is the last bar of the day's session, false otherwise. If extended session information is used, only returns true on the last bar of the post-market bars. Works for futures (TradingView's methods do not).
Returns: bool
ispremarket(sessionMap)
Returns true if the current bar is a part of the pre-market, false otherwise. On non-intraday charts always returns false. Works for futures (TradingView's methods do not).
Parameters:
sessionMap (map) : The map of futures session hours. Optional. Uses default if not provided.
Returns: bool
ispostmarket(sessionMap)
Returns true if the current bar is a part of the post-market, false otherwise. On non-intraday charts always returns false. Works for futures (TradingView's methods do not).
Parameters:
sessionMap (map) : The map of futures session hours. Optional. Uses default if not provided.
Returns: bool
isfirstbar_regular(sessionMap)
Returns true on the first regular session bar of the day, false otherwise. The result is the same whether extended session information is used or not. Works for futures (TradingView's methods do not).
Parameters:
sessionMap (map) : The map of futures session hours. Optional. Uses default if not provided.
Returns: bool
islastbar_regular(sessionMap)
Returns true on the last regular session bar of the day, false otherwise. The result is the same whether extended session information is used or not. Works for futures (TradingView's methods do not).
Parameters:
sessionMap (map) : The map of futures session hours. Optional. Uses default if not provided.
Returns: bool
isovernight(sessionMap)
Returns true if the current bar is a part of the pre-market or post-market, false otherwise. On non-intraday charts always returns false.
Parameters:
sessionMap (map) : The map of futures session hours. Optional. Uses default if not provided.
Returns: bool
getSessionHighAndLow(session, sessionMap)
Returns a tuple containing the high and low print during the specified session.
Parameters:
session (string) : The session for which to get the high & low prints. Defaults to market.
sessionMap (map) : The map of futures session hours. Optional. Uses default if not provided.
Returns: A tuple containing

GannLSVZO Indicator [Algo Alert]The Volume Zone oscillator breaks up volume activity into positive and negative categories. It is positive when the current closing price is greater than the prior closing price and negative when it's lower than the prior closing price. The resulting curve plots through relative percentage levels that yield a series of buy and sell signals, depending on level and indicator direction.
The Gann Laplace Smoothed Volume Zone Oscillator GannLSVZO is a refined version of the Volume Zone Oscillator, enhanced by the implementation of the upgraded Discrete Fourier Transform, the Laplace Stieltjes Transform. Its primary function is to streamline price data and diminish market noise, thus offering a clearer and more precise reflection of price trends.
By combining the Laplace with Gann Swing Entries and Exits (orange X) and with Ehler's white noise histogram, users gain a comprehensive perspective on volume-related market conditions.
HOW TO USE THE INDICATOR:
The default period is 2 but can be adjusted after backtesting. (I suggest 5 VZO length and NoiceR max length 8 as-well)
The VZO points to a positive trend when it is rising above the 0% level, and a negative trend when it is falling below the 0% level. 0% level can be adjusted in setting by adjusting VzoDifference. Oscillations rising below 0% level or falling above 0% level result in a natural trend.
ORIGINALITY & USFULLNESS:
Personal combination of Gann swings and Laplace Stieltjes Transform of a price which results in less noise Volume Zone Oscillator.
The Laplace Stieltjes Transform is a mathematical technique that transforms discrete data from the time domain into its corresponding representation in the frequency domain. This process involves breaking down a signal into its individual frequency components, thereby exposing the amplitude and phase characteristics inherent in each frequency element.
This indicator utilizes the concept of Ehler's Universal Oscillator and displays a histogram, offering critical insights into the prevailing levels of market noise. The Ehler's Universal Oscillator is grounded in a statistical model that captures the erratic and unpredictable nature of market movements. Through the application of this principle, the histogram aids traders in pinpointing times when market volatility is either rising or subsiding.
The Gann swings and the Gan swing strategy is developed by meomeo105, this Gann high and low algorithm forms the basis of the EMA modification.
DETAILED DESCRIPTION:
My detailed description of the indicator and use cases which I find very valuable.
What is oscillator?
Oscillators are chart indicators that can assist a trader in determining overbought or oversold conditions in ranging (non-trending) markets.
What is volume zone oscillator?
Price Zone Oscillator measures if the most recent closing price is above or below the preceding closing price.
Volume Zone Oscillator is Volume multiplied by the 1 or -1 depending on the difference of the preceding 2 close prices and smoothed with Exponential moving Average.
What does this mean?
If the VZO is above 0 and VZO is rising. We have a bullish trend. Most likely.
If the VZO is below 0 and VZO is falling. We have a bearish trend. Most likely.
Rising means that VZO on close is higher than the previous day.
Falling means that VZO on close is lower than the previous day.
What if VZO is falling above 0 line?
It means we have a high probability of a bearish trend.
Thus the indicator returns 0 and Strategy closes all it's positions when falling above 0 (or rising bellow 0) and we combine higher and lower timeframes to gauge the trend.
What is approximation and smoothing?
They are mathematical concepts for making a discrete set of numbers a
continuous curved line.
Laplace Stieltjes Transform approximation of a close price are taken from aprox library.
Key Features:
You can tailor the Indicator/Strategy to your preferences with adjustable parameters such as VZO length, noise reduction settings, and smoothing length.
Volume Zone Oscillator (VZO) shows market sentiment with the VZO, enhanced with Exponential Moving Average (EMA) smoothing for clearer trend identification.
Noise Reduction leverages Euler's White noise capabilities for effective noise reduction in the VZO, providing a cleaner and more accurate representation of market dynamics.
Choose between the traditional Fast Laplace Stieltjes Transform (FLT) and the innovative Double Discrete Fourier Transform (DTF32) soothed price series to suit your analytical needs.
Use dynamic calculation of Laplace coefficient or the static one. You may modify those inputs and Strategy entries with Gann swings.
I suggest using "Close all" input False when fine-tuning Inputs for 1 TimeFrame. When you export data to Excel/Numbers/GSheets I suggest using "Close all" input as True, except for the lowest TimeFrame. I suggest using 100% equity as your default quantity for fine-tune purposes. I have to mention that 100% equity may lead to unrealistic backtesting results. Be avare. When backtesting for trading purposes use Contracts or USDT.

Trade Exit Calculator [MarketSignalsPro]█ OVERVIEW
This Pine Script calculates a Stop Loss and Take Profit order suggestion based on the Average True Range (ATR). This provides a market generated visual reference for the user to better gauge risk and profit potential for their trades. This is not a trade signal system, it is a tool best used in conjunction with an existing system.
█ FEATURES
Inputs:
stopLossMultiplier and takeProfitMultiplier : These are input parameters that allow the user to adjust the multiplier for calculating stop loss and take profit levels.
longIndicator : This input parameter determines whether the script is calculating levels for a long setup (buy) or a short setup (sell).
Variable Initialization:
Various variables are initialized to manage labels, lines, and calculated stop loss and take profit levels.
ATR (Average True Range) is calculated using a period of 14.
Calculation of Stop Loss and Take Profit:
Depending on the value of longIndicator stop loss and take profit levels are not calculated the same way.
For long setups, stop loss is calculated below the closing price and take profit above, while for short setups, it's the opposite.
The calculation involves multiplying the ATR value by the user-defined multipliers and adding or subtracting from the closing price accordingly.
Plotting Lines:
Lines representing the calculated stop loss, take profit, and entry price are plotted on the chart.
Displaying Labels:
Labels displaying the calculated stop loss, take profit, and entry price are shown on the chart alongside the respective lines.
Updating and Deleting Objects:
Existing lines and labels are updated or deleted to ensure only the most recent levels are displayed on the chart.
Final Output:
The script outputs visual representations of stop loss, take profit, and entry price levels on the chart, providing traders with guidance for risk management and profit-taking strategies based on the volatility of the market.
█ CONCLUSION
In summary, this Pine Script enhances trading strategies by calculating and illustrating stop loss and take profit levels based on the Average True Range indicator, offering traders a structured way to manage risk and profit potential.
█ THANKS
Special thanks to Cryptosnagger for taking the time to build this Pine Script and share it freely with the community.

DiscordWebhooksLibrary🚀 Introduction
Welcome to the TradingView PineScript Library for Discord Webhook Integration! This library is designed for traders and developers who use TradingView for technical analysis and want to integrate their trading strategies with Discord notifications.
Key Features:
* Embed Creation: Easily create rich and informative embeds for your Discord messages, allowing you to send detailed trading alerts and summaries.
* Flexible Webhook Formatting: Customize your Discord messages with options for usernames, avatars, and text content, providing a personalized touch to your notifications.
* Simple Integration: Designed with simplicity in mind, this library can be integrated into your existing Pine Script trading strategies without extensive coding knowledge.
* Real-time Alerts: Utilize TradingView's alert system to send real-time trade signals and market updates to your Discord server.
Compatibility:
This library is compatible with TradingView's Pine Script version 5.
🍃 Code Snippets and Usage Examples
The following examples demonstrate how to use the Discord Webhook Integration Library in your TradingView Pine Scripts. These snippets cover various scenarios, showcasing the flexibility and utility of the library.
Example 1: Simple Alert with Markdown in Embed Description
embedDesc = "This is a **bold** and _italic_ alert message with a (replace_with_your_link)"
embedJson = createEmbedJSON("Simple Alert", embedDesc, 12345)
content = discordWebhookJSON("Alert from Captain Hook", "Captain Hook", na, embedJson)
Example 2: Multiple Embeds with Different Markdown Styles
embedDesc1 = "First alert with **bold** text"
embedDesc2 = "Second alert with _italic_ text"
embedDesc3 = "Third alert with ~~strikethrough~~"
embedJson1 = createEmbedJSON("Alert 1", embedDesc1, 654321)
embedJson2 = createEmbedJSON("Alert 2", embedDesc2, 123456)
embedJson3 = createEmbedJSON("Alert 3", embedDesc3, 111111)
embeds = embedJson1 + "," + embedJson2 + "," + embedJson3
content = discordWebhookJSON("Multiple Alerts", "Captain Hook", na, embeds)
Example 3: Complex Alert with Full Markdown Usage in Embed
embedDesc = "Alert: **Price Breakout!**\\n\\n" +
"*Symbol*: " + syminfo.ticker + "\\n" +
"*Price*: $" + str.tostring(close) + "\\n\\n" +
" (replace_with_your_link)"
embedJson = createEmbedJSON("Complex Alert", embedDesc, 16711680) // Red color
content = discordWebhookJSON("Complex Alert", "Captain Hook", na, embedJson)
Example 4: Advanced Technical Analysis Alert
rsiValue = ta.rsi(close, 14)
= ta.macd(close, 12, 26, 9)
taMessage = "RSI: " + str.tostring(rsiValue) + "\\nMACD: " + str.tostring(macdLine)
embedJson = createEmbedJSON("Technical Analysis Update", taMessage, 255) // Blue color
content = discordWebhookJSON("TA Alert", "Captain Hook", na, embedJson)
Example 5: Market Summary with Multiple Fields
counterTrend = "Your counter trend criterias"
counterTrendEmbed = createEmbedJSON(title = "Counter Trend", description = counterTrend, color = 15258703)
redFlags = "Your red flag criterias"
redFlagsEmbed = createEmbedJSON(title = "Red Flags", description = redFlags, color = 15229263)
embeds = counterTrendEmbed + "," + redFlagsEmbed
content = discordWebhookJSON(contentText = "Example of how a market analysis could look like", username = "Captain Hook", embeds = embeds)
🚨 Error Handling
Use Escape Characters Correctly: In message strings, remember to use \\n for new lines instead of \n. This ensures that the newline character is correctly interpreted in the JSON format.
It can be helpful to plot the json on the last candle
if barstate.islast
label.new(bar_index, high, text=debugMessage, color=color.red, textcolor=color.white, yloc=yloc.abovebar)
🔥 FAQs
Q1: Can I send alerts for multiple conditions?
A: Yes, you can configure multiple conditions in your script. Use separate if statements for each condition and call the discordWebhookJSON function with the relevant message for each alert.
Q2: Why is my alert not triggering?
A: Ensure your alert conditions are correct and that you've properly set up the webhook in both your script and TradingView's alert configuration. Also, check for any syntax errors in your script.
Q3: How many alerts can I send to Discord?
A: While TradingView doesn't limit the number of alerts, Discord has rate limits for webhooks. Be mindful of these limits to avoid your webhook being temporarily blocked.
Q4: Can I customize the appearance of my Discord messages?
A: Yes, the createEmbedJSON function allows you to customize your messages with titles, descriptions, colors, and more. Experiment with different parameters to achieve the desired appearance.
Q5: Is it possible to include real-time data in alerts?
A: Yes, your script can include real-time price data, indicator values, or any other real-time data available in Pine Script.
Q6: How can I contribute to the library or suggest improvements?
A: You can provide feedback, suggest improvements, or contribute to the library's development through the community channels or contact points provided in the "Support and Community" section.
formatTimeframe()
discordWebhookJSON(contentText, username, avatar_url, embeds)
Constructs a JSON string for a Discord webhook message. This string includes optional fields for content, username, avatar URL, and embeds.
Parameters:
contentText (string) : (string, optional): The main text content of the webhook message. Default is 'na'.
username (string) : (string, optional): Overrides the default username of the webhook. Default is 'na'.
avatar_url (string) : (string, optional): Overrides the default avatar URL of the webhook. Default is 'na'.
embeds (string) : (string, optional): A string containing one or more embed JSON objects. This should be formatted correctly as a JSON array. Default is 'na'.
createEmbedJSON(title, description, color, authorName, authorUrl, authorIconUrl, fields)
Creates a JSON string for a single embed object for a Discord webhook.
Parameters:
title (string) : (string, optional): The title of the embed. Default is 'na' (not applicable).
description (string) : (string, optional): The description text of the embed. Supports basic formatting. Default is 'na'.
color (int) : (int, optional): The color code of the embed, typically in decimal format. Default is 'na'.
authorName (string) : (string, optional): The name of the author to display in the embed. Default is 'na'.
authorUrl (string) : (string, optional): The URL linked to the author's name. Default is 'na'.
authorIconUrl (string) : (string, optional): The URL of the icon to display next to the author's name. Default is 'na'.
fields (string) : (string, optional): A string containing one or more field JSON objects. This should be formatted correctly as a JSON array. Default is 'na'. Note: Use the 'createEmbedFieldJSON' function to generate these JSON field strings before adding them to the array.
createEmbedFieldJSON(name, value, inline)
Creates a JSON string representing a single field object within an embed for a Discord webhook message.
Parameters:
name (string) : (string): The name of the field, acting as a title for the field content.
value (string) : (string): The value of the field, containing the actual text or information you want to display within the field.
inline (bool) : (bool, optional): A boolean flag indicating whether the field should be displayed inline with other fields. If set to true, the field will be displayed on the same line as the next field
❤️ Please, support the work with like & comment! ❤️

UtilsLibrary "Utils"
A collection of convenience and helper functions for indicator and library authors on TradingView
formatNumber(num)
My version of format number that doesn't have so many decimal places...
Parameters:
num (float) : (float) the number to be formatted
Returns: (string) The formatted number
getDateString(timestamp)
Convenience function returns timestamp in yyyy/MM/dd format.
Parameters:
timestamp (int) : (int) The timestamp to stringify
Returns: (int) The date string
getDateTimeString(timestamp)
Convenience function returns timestamp in yyyy/MM/dd hh:mm format.
Parameters:
timestamp (int) : (int) The timestamp to stringify
Returns: (int) The date string
getInsideBarCount()
Gets the number of inside bars for the current chart. Can also be passed to request.security to get the same for different timeframes.
Returns: (int) The # of inside bars on the chart right now.
getLabelStyleFromString(styleString, acceptGivenIfNoMatch)
Tradingview doesn't give you a nice way to put the label styles into a dropdown for configuration settings. So, I specify them in the following format: . This function takes care of converting those custom strings back to the ones expected by tradingview scripts.
Parameters:
styleString (string)
acceptGivenIfNoMatch (bool) : (bool) If no match for styleString is found and this is true, the function will return styleString, otherwise it will return tradingview's preferred default
Returns: (string) The string expected by tradingview functions
getTime(hourNumber, minuteNumber)
Given an hour number and minute number, adds them together and returns the sum. To be used by getLevelBetweenTimes when fetching specific price levels during a time window on the day.
Parameters:
hourNumber (int) : (int) The hour number
minuteNumber (int) : (int) The minute number
Returns: (int) The sum of all the minutes
getHighAndLowBetweenTimes(start, end)
Given a start and end time, returns the high or low price during that time window.
Parameters:
start (int) : The timestamp to start with (# of seconds)
end (int) : The timestamp to end with (# of seconds)
Returns: (float) The high or low value
getPremarketHighsAndLows()
Returns an expression that can be used by request.security to fetch the premarket high & low levels in a tuple.
Returns: (tuple)
getAfterHoursHighsAndLows()
Returns an expression that can be used by request.security to fetch the after hours high & low levels in a tuple.
Returns: (tuple)
getOvernightHighsAndLows()
Returns an expression that can be used by request.security to fetch the overnight high & low levels in a tuple.
Returns: (tuple)
getNonRthHighsAndLows()
Returns an expression that can be used by request.security to fetch the high & low levels for premarket, after hours and overnight in a tuple.
Returns: (tuple)
getLineStyleFromString(styleString, acceptGivenIfNoMatch)
Tradingview doesn't give you a nice way to put the line styles into a dropdown for configuration settings. So, I specify them in the following format: . This function takes care of converting those custom strings back to the ones expected by tradingview scripts.
Parameters:
styleString (string) : (string) Plain english (or TV Standard) version of the style string
acceptGivenIfNoMatch (bool) : (bool) If no match for styleString is found and this is true, the function will return styleString, otherwise it will return tradingview's preferred default
Returns: (string) The string expected by tradingview functions
getPercentFromPrice(price)
Get the % the current price is away from the given price.
Parameters:
price (float)
Returns: (float) The % the current price is away from the given price.
getPositionFromString(position)
Tradingview doesn't give you a nice way to put the positions into a dropdown for configuration settings. So, I specify them in the following format: . This function takes care of converting those custom strings back to the ones expected by tradingview scripts.
Parameters:
position (string) : (string) Plain english position string
Returns: (string) The string expected by tradingview functions
getTimeframeOfChart()
Get the timeframe of the current chart for display
Returns: (string) The string of the current chart timeframe
getTimeNowPlusOffset(candleOffset)
Helper function for drawings that use xloc.bar_time to help you know the time offset if you want to place the end of the drawing out into the future. This determines the time-size of one candle and then returns a time n candleOffsets into the future.
Parameters:
candleOffset (int) : (int) The number of items to find singular/plural for.
Returns: (int) The future time
getVolumeBetweenTimes(start, end)
Given a start and end time, returns the sum of all volume across bars during that time window.
Parameters:
start (int) : The timestamp to start with (# of seconds)
end (int) : The timestamp to end with (# of seconds)
Returns: (float) The volume
isToday()
Returns true if the current bar occurs on today's date.
Returns: (bool) True if current bar is today
padLabelString(labelText, labelStyle)
Pads a label string so that it appears properly in or not in a label. When label.style_none is used, this will make sure it is left-aligned instead of center-aligned. When any other type is used, it adds a single space to the right so there is padding against the right end of the label.
Parameters:
labelText (string) : (string) The string to be padded
labelStyle (string) : (string) The style of the label being padded for.
Returns: (string) The padded string
plural(num, singular, plural)
Helps format a string for plural/singular. By default, if you only provide num, it will just return "s" for plural and nothing for singular (eg. plural(numberOfCats)). But you can optionally specify the full singular/plural words for more complicated nomenclature (eg. plural(numberOfBenches, 'bench', 'benches'))
Parameters:
num (int) : (int) The number of items to find singular/plural for.
singular (string) : (string) The string to return if num is singular. Defaults to an empty string.
plural (string) : (string) The string to return if num is plural. Defaults to 's' so you can just add 's' to the end of a word.
Returns: (string) The singular or plural provided strings depending on the num provided.
timeframeInSeconds(timeframe)
Get the # of seconds in a given timeframe. Tradingview's timeframe.in_seconds() expects a simple string, and we often need to use series string, so this is an alternative to get you the value you need.
Parameters:
timeframe (string)
Returns: (int) The number of secondsof that timeframe
timeframeToString(tf)
Convert a timeframe string to a consistent standard.
Parameters:
tf (string) : (string) The timeframe string to convert
Returns: (string) The standard format for the string, or the unchanged value if it is unknown.

Earnings LevelsI am proud to announce that the formerly secret "Key Earnings Levels" graphing tool will be freely available to TradingView users whereas before it was only available by monthly or annual subscription since its invention here at TradingView many years ago by Tim West. TradingView code writers wrote the original code for using this powerful tool and then Johannes Falkenburg re-wrote the code several years ago.
The most important FOUR days a year in a stock chart are the days that the company gives its quarterly update. Since the GRAND majority of companies have earnings, the indicator is called the "Key Earnings Level", or KEL for short. The unique part of the release of the quarterly update is that it can be "before the open" or "after the close" and the price action leading up to the earnings and immediately after the earnings are useful for future reference, as you'll see shortly.
The Key Earnings indicator plots a triangle for the range around the day before and the day after earnings and draws a mid-point line to capture the over/under level for that report. That mid-point line is then extended into the future for a minimum of one quarter until the next earnings report and as long as a year with the current code.
This triangle plot allows you to see how a stock is trading RELATIVE TO where it was trading when earnings were announced and when a glimpse into the current quarter along with projections for the upcoming year.
Simply put: Key Earnings Levels are the easiest way to see how a stock is doing relative to the most important four days a year.
You can devise your own trading strategies around these levels, but I want you to have this information so you can see it and know it too. I've kept this little secret of Key Hidden Levels to myself and my followers in the Key Hidden Levels Chat Room here at TradingView for far too long. I have occasionally published charts with the Key Earnings Levels but have not made the code freely available to TradingView subscribers.
If anyone has paid me for access to these indicators and wants a refund, I will be glad to do that. This is too important to keep from everyone any longer. I think it is essential to make this available to everyone to make sure we all have the most advantage we can get when investing and trading in the markets.
I hope you can all find the powerful benefit from using Key Earnings Levels and please thank Johannes Falkenburg aka @Vollchaot here at TradingView for writing the latest version of this code.
The idea itself came from using TradingView and the powerful graphing and layout features here to track our observations and to do research. Thank you TradingView for such a great product.
I look forward to answering any questions.
Sincerely,
Tim West
VolatilityIndicatorsLibrary "VolatilityIndicators"
This is a library of Volatility Indicators .
It aims to facilitate the grouping of this category of indicators, and also offer the customized supply of
the parameters and sources, not being restricted to just the closing price.
@Thanks and credits:
1. Dynamic Zones: Leo Zamansky, Ph.D., and David Stendahl
2. Deviation: Karl Pearson (code by TradingView)
3. Variance: Ronald Fisher (code by TradingView)
4. Z-score: Veronique Valcu (code by HPotter)
5. Standard deviation: Ronald Fisher (code by TradingView)
6. ATR (Average True Range): J. Welles Wilder (code by TradingView)
7. ATRP (Average True Range Percent): millerrh
8. Historical Volatility: HPotter
9. Min-Max Scale Normalization: gorx1
10. Mean Normalization: gorx1
11. Standardization: gorx1
12. Scaling to unit length: gorx1
13. LS Volatility Index: Alexandre Wolwacz (Stormer), Fabrício Lorenz, Fábio Figueiredo (Vlad) (code by me)
14. Bollinger Bands: John Bollinger (code by TradingView)
15. Bollinger Bands %: John Bollinger (code by TradingView)
16. Bollinger Bands Width: John Bollinger (code by TradingView)
dev(source, length, anotherSource)
Deviation. Measure the difference between a source in relation to another source
Parameters:
source (float)
length (simple int) : (int) Sequential period to calculate the deviation
anotherSource (float) : (float) Source to compare
Returns: (float) Bollinger Bands Width
variance(src, mean, length, biased, degreesOfFreedom)
Variance. A statistical measurement of the spread between numbers in a data set. More specifically,
variance measures how far each number in the set is from the mean (average), and thus from every other number in the set.
Variance is often depicted by this symbol: σ2. It is used by both analysts and traders to determine volatility and market security.
Parameters:
src (float) : (float) Source to calculate variance
mean (float) : (float) Mean (Moving average)
length (simple int) : (int) The sequential period to calcule the variance (number of values in data set)
biased (simple bool) : (bool) Defines the type of standard deviation. If true, uses biased sample variance (n),
degreesOfFreedom (simple int) : (int) Degrees of freedom. The number of values in the final calculation of a statistic that are free to vary.
Default value is n-1, where n here is length. Only applies when biased parameter is defined as true.
Returns: (float) Standard deviation
stDev(src, length, mean, biased, degreesOfFreedom)
Measure the Standard deviation from a source in relation to it's moving average.
In this implementation, you pass the average as a parameter, allowing a more personalized calculation.
Parameters:
src (float) : (float) Source to calculate standard deviation
length (simple int) : (int) The sequential period to calcule the standard deviation
mean (float) : (float) Moving average.
biased (simple bool) : (bool) Defines the type of standard deviation. If true, uses biased sample variance (n),
else uses unbiased sample variance (n-1 or another value, as long as it is in the range between 1 and n-1), where n=length.
degreesOfFreedom (simple int) : (int) Degrees of freedom. The number of values in the final calculation of a statistic that are free to vary.
Default value is n-1, where n here is length.
Returns: (float) Standard deviation
zscore(src, mean, length, biased, degreesOfFreedom)
Z-Score. A z-score is a statistical measurement that indicates how many standard deviations a data point is from
the mean of a data set. It is also known as a standard score. The formula for calculating a z-score is (x - μ) / σ,
where x is the individual data point, μ is the mean of the data set, and σ is the standard deviation of the data set.
Z-scores are useful in identifying outliers or extreme values in a data set. A positive z-score indicates that the
data point is above the mean, while a negative z-score indicates that the data point is below the mean. A z-score of
0 indicates that the data point is equal to the mean.
Z-scores are often used in hypothesis testing and determining confidence intervals. They can also be used to compare
data sets with different units or scales, as the z-score standardizes the data. Overall, z-scores provide a way to
measure the relative position of a data point in a data
Parameters:
src (float) : (float) Source to calculate z-score
mean (float) : (float) Moving average.
length (simple int) : (int) The sequential period to calcule the standard deviation
biased (simple bool) : (bool) Defines the type of standard deviation. If true, uses biased sample variance (n),
else uses unbiased sample variance (n-1 or another value, as long as it is in the range between 1 and n-1), where n=length.
degreesOfFreedom (simple int) : (int) Degrees of freedom. The number of values in the final calculation of a statistic that are free to vary.
Default value is n-1, where n here is length.
Returns: (float) Z-score
atr(source, length)
ATR: Average True Range. Customized version with source parameter.
Parameters:
source (float) : (float) Source
length (simple int) : (int) Length (number of bars back)
Returns: (float) ATR
atrp(length, sourceP)
ATRP (Average True Range Percent)
Parameters:
length (simple int) : (int) Length (number of bars back) for ATR
sourceP (float) : (float) Source for calculating percentage relativity
Returns: (float) ATRP
atrp(source, length, sourceP)
ATRP (Average True Range Percent). Customized version with source parameter.
Parameters:
source (float) : (float) Source for ATR
length (simple int) : (int) Length (number of bars back) for ATR
sourceP (float) : (float) Source for calculating percentage relativity
Returns: (float) ATRP
historicalVolatility(lengthATR, lengthHist)
Historical Volatility
Parameters:
lengthATR (simple int) : (int) Length (number of bars back) for ATR
lengthHist (simple int) : (int) Length (number of bars back) for Historical Volatility
Returns: (float) Historical Volatility
historicalVolatility(source, lengthATR, lengthHist)
Historical Volatility
Parameters:
source (float) : (float) Source for ATR
lengthATR (simple int) : (int) Length (number of bars back) for ATR
lengthHist (simple int) : (int) Length (number of bars back) for Historical Volatility
Returns: (float) Historical Volatility
minMaxNormalization(src, numbars)
Min-Max Scale Normalization. Maximum and minimum values are taken from the sequential range of
numbars bars back, where numbars is a number defined by the user.
Parameters:
src (float) : (float) Source to normalize
numbars (simple int) : (int) Numbers of sequential bars back to seek for lowest and hightest values.
Returns: (float) Normalized value
minMaxNormalization(src, numbars, minimumLimit, maximumLimit)
Min-Max Scale Normalization. Maximum and minimum values are taken from the sequential range of
numbars bars back, where numbars is a number defined by the user.
In this implementation, the user explicitly provides the desired minimum (min) and maximum (max) values for the scale,
rather than using the minimum and maximum values from the data.
Parameters:
src (float) : (float) Source to normalize
numbars (simple int) : (int) Numbers of sequential bars back to seek for lowest and hightest values.
minimumLimit (simple float) : (float) Minimum value to scale
maximumLimit (simple float) : (float) Maximum value to scale
Returns: (float) Normalized value
meanNormalization(src, numbars, mean)
Mean Normalization
Parameters:
src (float) : (float) Source to normalize
numbars (simple int) : (int) Numbers of sequential bars back to seek for lowest and hightest values.
mean (float) : (float) Mean of source
Returns: (float) Normalized value
standardization(src, mean, stDev)
Standardization (Z-score Normalization). How "outside the mean" values relate to the standard deviation (ratio between first and second)
Parameters:
src (float) : (float) Source to normalize
mean (float) : (float) Mean of source
stDev (float) : (float) Standard Deviation
Returns: (float) Normalized value
scalingToUnitLength(src, numbars)
Scaling to unit length
Parameters:
src (float) : (float) Source to normalize
numbars (simple int) : (int) Numbers of sequential bars back to seek for lowest and hightest values.
Returns: (float) Normalized value
lsVolatilityIndex(movingAverage, sourceHvol, lengthATR, lengthHist, lenNormal, lowerLimit, upperLimit)
LS Volatility Index. Measures the volatility of price in relation to an average.
Parameters:
movingAverage (float) : (float) A moving average
sourceHvol (float) : (float) Source for calculating the historical volatility
lengthATR (simple int) : (float) Length for calculating the ATR (Average True Range)
lengthHist (simple int) : (float) Length for calculating the historical volatility
lenNormal (simple int) : (float) Length for normalization
lowerLimit (simple int)
upperLimit (simple int)
Returns: (float) LS Volatility Index
lsVolatilityIndex(sourcePrice, movingAverage, sourceHvol, lengthATR, lengthHist, lenNormal, lowerLimit, upperLimit)
LS Volatility Index. Measures the volatility of price in relation to an average.
Parameters:
sourcePrice (float) : (float) Source for measure the distance
movingAverage (float) : (float) A moving average
sourceHvol (float) : (float) Source for calculating the historical volatility
lengthATR (simple int) : (float) Length for calculating the ATR (Average True Range)
lengthHist (simple int) : (float) Length for calculating the historical volatility
lenNormal (simple int)
lowerLimit (simple int)
upperLimit (simple int)
Returns: (float) LS Volatility Index
bollingerBands(src, length, mult, basis)
Bollinger Bands. A Bollinger Band is a technical analysis tool defined by a set of lines plotted
two standard deviations (positively and negatively) away from a simple moving average (SMA) of the security's price,
but can be adjusted to user preferences. In this version you can pass a customized basis (moving average), not only SMA.
Parameters:
src (float) : (float) Source to calculate standard deviation used in Bollinger Bands
length (simple int) : (int) The time period to be used in calculating the standard deviation
mult (simple float) : (float) Multiplier used in standard deviation. Basically, the upper/lower bands are standard deviation multiplied by this.
basis (float) : (float) Basis of Bollinger Bands (a moving average)
Returns: (float) A tuple of Bollinger Bands, where index 1=basis; 2=basis+dev; 3=basis-dev; and dev=multiplier*stdev
bollingerBands(src, length, aMult, basis)
Bollinger Bands. A Bollinger Band is a technical analysis tool defined by a set of lines plotted
two standard deviations (positively and negatively) away from a simple moving average (SMA) of the security's price,
but can be adjusted to user preferences. In this version you can pass a customized basis (moving average), not only SMA.
Also, various multipliers can be passed, thus getting more bands (instead of just 2).
Parameters:
src (float) : (float) Source to calculate standard deviation used in Bollinger Bands
length (simple int) : (int) The time period to be used in calculating the standard deviation
aMult (float ) : (float ) An array of multiplies used in standard deviation. Basically, the upper/lower bands are standard deviation multiplied by this.
This array of multipliers permit the use of various bands, not only 2.
basis (float) : (float) Basis of Bollinger Bands (a moving average)
Returns: (float ) An array of Bollinger Bands, where:
index 1=basis; 2=basis+dev1; 3=basis-dev1; 4=basis+dev2, 5=basis-dev2, 6=basis+dev2, 7=basis-dev2, Nup=basis+devN, Nlow=basis-devN
and dev1, dev2, devN are ```multiplier N * stdev```
bollingerBandsB(src, length, mult, basis)
Bollinger Bands %B - or Percent Bandwidth (%B).
Quantify or display where price (or another source) is in relation to the bands.
%B can be useful in identifying trends and trading signals.
Calculation:
%B = (Current Price - Lower Band) / (Upper Band - Lower Band)
Parameters:
src (float) : (float) Source to calculate standard deviation used in Bollinger Bands
length (simple int) : (int) The time period to be used in calculating the standard deviation
mult (simple float) : (float) Multiplier used in standard deviation
basis (float) : (float) Basis of Bollinger Bands (a moving average)
Returns: (float) Bollinger Bands %B
bollingerBandsB(src, length, aMult, basis)
Bollinger Bands %B - or Percent Bandwidth (%B).
Quantify or display where price (or another source) is in relation to the bands.
%B can be useful in identifying trends and trading signals.
Calculation
%B = (Current Price - Lower Band) / (Upper Band - Lower Band)
Parameters:
src (float) : (float) Source to calculate standard deviation used in Bollinger Bands
length (simple int) : (int) The time period to be used in calculating the standard deviation
aMult (float ) : (float ) Array of multiplier used in standard deviation. Basically, the upper/lower bands are standard deviation multiplied by this.
This array of multipliers permit the use of various bands, not only 2.
basis (float) : (float) Basis of Bollinger Bands (a moving average)
Returns: (float ) An array of Bollinger Bands %B. The number of results in this array is equal the numbers of multipliers passed via parameter.
bollingerBandsW(src, length, mult, basis)
Bollinger Bands Width. Serve as a way to quantitatively measure the width between the Upper and Lower Bands
Calculation:
Bollinger Bands Width = (Upper Band - Lower Band) / Middle Band
Parameters:
src (float) : (float) Source to calculate standard deviation used in Bollinger Bands
length (simple int) : (int) Sequential period to calculate the standard deviation
mult (simple float) : (float) Multiplier used in standard deviation
basis (float) : (float) Basis of Bollinger Bands (a moving average)
Returns: (float) Bollinger Bands Width
bollingerBandsW(src, length, aMult, basis)
Bollinger Bands Width. Serve as a way to quantitatively measure the width between the Upper and Lower Bands
Calculation
Bollinger Bands Width = (Upper Band - Lower Band) / Middle Band
Parameters:
src (float) : (float) Source to calculate standard deviation used in Bollinger Bands
length (simple int) : (int) Sequential period to calculate the standard deviation
aMult (float ) : (float ) Array of multiplier used in standard deviation. Basically, the upper/lower bands are standard deviation multiplied by this.
This array of multipliers permit the use of various bands, not only 2.
basis (float) : (float) Basis of Bollinger Bands (a moving average)
Returns: (float ) An array of Bollinger Bands Width. The number of results in this array is equal the numbers of multipliers passed via parameter.
dinamicZone(source, sampleLength, pcntAbove, pcntBelow)
Get Dynamic Zones
Parameters:
source (float) : (float) Source
sampleLength (simple int) : (int) Sample Length
pcntAbove (simple float) : (float) Calculates the top of the dynamic zone, considering that the maximum values are above x% of the sample
pcntBelow (simple float) : (float) Calculates the bottom of the dynamic zone, considering that the minimum values are below x% of the sample
Returns: A tuple with 3 series of values: (1) Upper Line of Dynamic Zone;
(2) Lower Line of Dynamic Zone; (3) Center of Dynamic Zone (x = 50%)
Examples:

Visible Range Linear Regression Channel [vnhilton](OVERVIEW)
This indicator calculates the linear regression channel for the visible bars shown on the chart instead of the traditional fixed length linear regression channel TradingView provides (and is more accurate I believe). Inspired by TradingView's Linear Regression Channel and Visible Average Price indicator, and the DAS Trader linear regression indicator.
(FEATURES)
- Ability to extend lines to the right
- Show/hide individual lines
- Adjust standard deviation of bands
- Adjust line style and width of basis and band lines
- Change individual line colours and plot fills between the lines
(DIFFERENCES)
If you compare this indicator to TradingView's Linear Regression Channel, you will notice some differences (as of 11th June, 2023). Differences and reasons are:
1) The intercept is wrong. The formula TradingView uses to calculate the intercept includes the addition of the gradient, which I believe is incorrect. Difference #2 is also why the intercept is wrong. This indicator omits that addition. This was verified by comparing the gradient calculated in this indicator with the gradient determined by Excel with the same data.
2) The gradient is "wrong". In quotations as essentially TradingView's code attempts to find the line of best fit, with the y-axis on the most recent bar instead of the oldest bar. This leads to the gradient being the opposite to the gradient found in this indicator, which isn't wrong, but the later formula used to calculate the intercept doesn't take this into account, resulting in an incorrect intercept value. The gradient and intercept values in this indicator matches those found in Excel.
3) Standard deviation bands of both indicators. I believe the code TradingView uses to calculate standard deviation is incorrect (basing this just through visuals). This indicator uses the array.stdev function to find the correct value (verified with Excel numbers).

Multi Delta-Agnostic Correlation Coefficient (tartigradia)Display three DACC plots simultaneously, to visualize both directional (up on top, down at bottom) and adirectional DACC (in the middle) simultaneously.
Delta Agnostic Correlation calculates a correlation between two symbols based only on the sign of their changes using a Sign Test (en.m.wikipedia.org), regardless of the amplitude of price change. Compared to a standard Pearson correlation (quantitative test), Sign Test correlations (discrete test) are highly sensitive to directional change with 0 lag, at the expense of lacking sensitivity to quantity correlation (ie, it does not matter if changes are big or small).
Hence, this Delta-Agnostic Correlation Coefficient (DCC or DACC) indicator is better used to detect early changes in correlations, and then confirmation with a typical Pearson correlation or a non-parametric Spearman test or Mutual Information (all three are quantitative tests, hence accounting for quantity and not just direction) can allow to be more sensitive to quantities too and hence be a robust combination to demonstrate strong correlations both in direction and amplitude.
Adequate statistical significance testing, using a two-sided binomial statistical test, is also implemented. Note however that one assumption of the sign test may here be violated: independence of observations for each symbol. If you assume the market is not acting on a random walk, then there is a temporal autocorrelation, and this biases the sign test. However, in practice, the test works well enough.
The directional variants of the test allow to test the correlation hypothesis only if the index symbol goes into one direction. For example, if we suspect that the index symbol is correlated with the current symbol but only when the index symbol is bullish, we can select "Up" to test this hypothesis. Note that given the specificities of how directional and adirectional tests differ in how they work, the default fill is different: zero-value fill for adirectional test to simulate how price action tend to lose momentum during market close periods, previous DCC_MA (= no change in DCC value) during both market close periods and when the direction is opposite for the directional variants of the test, so that while the market is moving opposite, we don't lose the statistical significance built up to now, otherwise it would be nonsensical (for the directional tests).
For more information on the theory behind, see the original DACC indicator, which is the same script but with only one plot:
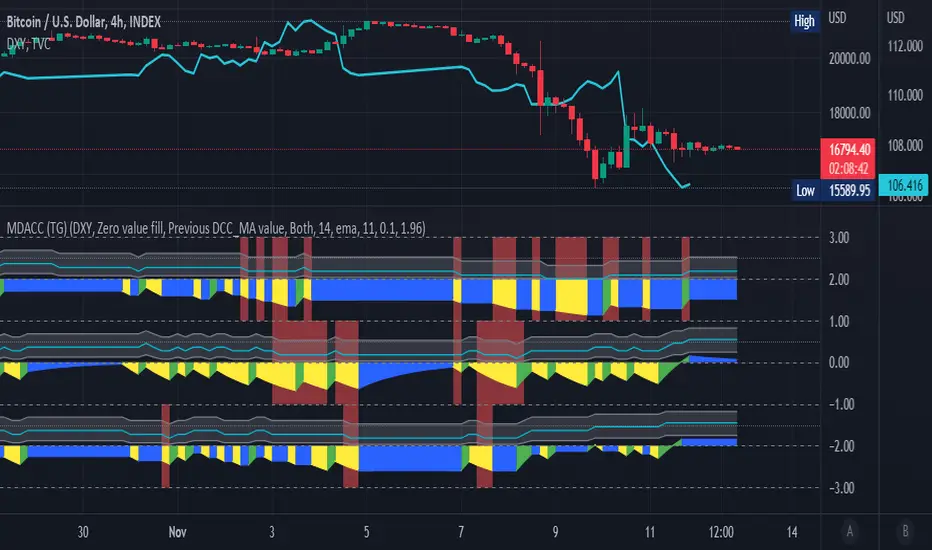
Physics CandlesPhysics Candles embed volume and motion physics directly onto price candles or market internals according to the cyclic pattern of financial securities. The indicator works on both real-time “ticks” and historical data using statistical modeling to highlight when these values, like volume or momentum, is unusual or relatively high for some periodic window in time. Each candle is made out of one or more sub-candles that each contain their own information of motion, which converts to the color and transparency, or brightness, of that particular candle segment. The segments extend throughout the entire candle, both body and wicks, and Thick Wicks can be implemented to see the color coding better. This candle segmentation allows you to see if all the volume or energy is evenly distributed throughout the candle or highly contained in one small portion of it, and how intense these values are compared to similar time periods without going to lower time frames. Candle segmentation can also change a trader’s perspective on how valuable the information is. A “low” volume candle, for instance, could signify high value short-term stopping volume if the volume is all concentrated in one segment.
The Candles are flexible. The physics information embedded on the candles need not be from the same price security or market internal as the chart when using the Physics Source option, and multiple Candles can be overlayed together. You could embed stock price Candles with market volume, market price Candles with stock momentum, market structure with internal acceleration, stock price with stock force, etc. My particular use case is scalping the SPX futures market (ES), whose price action is also dictated by the volume action in the associated cash market, or SPY, as well as a host of other securities. Physics allows you to embed the ES volume on the SPY price action, or the SPY volume on the ES price action, or you can combine them both by overlaying two Candle streams and increasing the Number of Overlays option to two. That option decreases the transparency levels of your coloring scheme so that overlaying multiple Candles converges toward the same visual color intensity as if you had one. The Candle and Physics Sources allows for both Symbols and Spreads to visualize Candle physics from a single ticker or some mathematical transformation of tickers.
Due to certain TradingView programming restrictions, each Candle can only be made out of a maximum of 8 candle segments, or an “8-bit” resolution. Since limits are just an opportunity to go beyond, the user has the option to stack multiple Candle indicators together to further increase the candle resolution. If you don’t want to see the Candles for some particular period of the day, you can hide them, or use the hiding feature to have multiple Candles calibrated to show multiple parts of the trading day. Securities tend to have low volume after hours with sharp spikes at the open or close. Multiple Candles can be used for multiple parts of the trading day to accommodate these different cycles in volume.
The Candles do not need be associated with the nominal security listed on the TV chart. The Candle Source allows the user to look at AAPL Candles, for instance, while on a TSLA or SPY chart, each with their respective volume actions integrated into the candles, for instance, to allow the user to see multiple security price and volume correlation on a single chart.
The physics information currently embeddable on Candles are volume or time, velocity, momentum, acceleration, force, and kinetic energy. In order to apply equations of motion containing a mass variable to financial securities, some analogous value for mass must be assumed. Traders often regard volume or time as inextricable variables to a securities price that can indicate the direction and strength of a move. Since mass is the inextricable variable to calculating the momentum, force, or kinetic energy of motion, the user has the option to assume either time or volume is analogous to mass. Volume may be a better option for mass as it is not strictly dependent on the speed of a security, whereas time is.
Data transformations and outlier statistics are used to color code the intensity of the physics for each candle segment relative to past periodic behavior. A million shares during pre-market or a million shares during noontime may be more intense signals than a typical million shares traded at the open, and should have more intense color signals. To account for a specific cyclic behavior in the market, the user can specify the Window and Cycle Time Frames. The Window Time Frame splits up a Cycle into windows, samples and aggregates the statistics for each window, then compares the current physics values against past values in the same window. Intraday traders may benefit from using a Daily Cycle with a 30-minute Window Time Frame and 1-minute Sample Time Frame. These settings sample and compare the physics of 1-minute candles within the current 30-minute window to the same 30-minute window statistics for all past trading days, up until the data limit imposed by TradingView, or until the Data Collection Start Date specified in the settings. Longer-term traders may benefit from using a Monthly Cycle with a Weekly Time Frame, or a Yearly Cycle with a Quarterly Time Frame.
Multiple statistics and data transformation methods are available to convey relative intensity in different ways for different trading signals. Physics Candles allows for both Normal and Log-Normal assumptions in the physics distribution. The data can then be transformed by Linear, Logarithmic, Z-Score, or Power-Law scoring, where scoring simply assigns an intensity to the relative physics value of each candle segment based on some mathematical transformation. Z-scoring often renders adequate detection by scoring the segment value, such as volume or momentum, according to the mean and standard deviation of the data set in each window of the cycle. Logarithmic or power-law transformation with a gamma below 1 decreases the disparity between intensities so more less-important signals will show up, whereas the power-law transformation with gamma values above 1 increases the disparity between intensities, so less more-important signals will show up. These scores are then converted to color and transparency between the Min Score and the Max Score Cutoffs. The Auto-Normalization feature can automatically pick these cutoffs specific to each window based on the mean and standard deviation of the data set, or the user can manually set them. Physics was developed with novices in mind so that most users could calibrate their own settings by plotting the candle segment distributions directly on the chart and fiddling with the settings to see how different cutoffs capture different portions of the distribution and affect the relative color intensities differently. Security distributions are often skewed with fat-tails, known as kurtosis, where high-volume segments for example, have a higher-probabilities than expected for a normal distribution. These distribution are really log-normal, so that taking the logarithm leads to a standard bell-shaped distribution. Taking the Z-score of the Log-Normal distribution could make the most statistical sense, but color sensitivity is a discretionary preference.
Background Philosophy
This indicator was developed to study and trade the physics of motion in financial securities from a visually intuitive perspective. Newton’s laws of motion are loosely applied to financial motion:
“A body remains at rest, or in motion at a constant speed in a straight line, unless acted upon by a force”.
Financial securities remain at rest, or in motion at constant speed up or down, unless acted upon by the force of traders exchanging securities.
“When a body is acted upon by a force, the time rate of change of its momentum equals the force”.
Momentum is the product of mass and velocity, and force is the product of mass and acceleration. Traders render force on the security through the mass of their trading activity and the acceleration of price movement.
“If two bodies exert forces on each other, these forces have the same magnitude but opposite directions.”
Force arises from the interaction of traders, buyers and sellers. One body of motion, traders’ capitalization, exerts an equal and opposite force on another body of motion, the financial security. A securities movement arises at the expense of a buyer or seller’s capitalization.
Volume
The premise of this indicator assumes that volume, v, is an analogous means of measuring physical mass, m. This premise allows the application of the equations of motion to the movement of financial securities. We know from E=mc^2 that mass has energy. Energy can be used to create motion as kinetic energy. Taking a simple hypothetical example, the interaction of one short seller looking to cover lower and one buyer looking to sell higher exchange shares in a security at an agreed upon price to create volume or mass, and therefore, potential energy. Eventually the short seller will actively cover and buy the security from the previous buyer, moving the security higher, or the buyer will actively sell to the short seller, moving the security lower. The potential energy inherent in the initial consolidation or trading activity between buy and seller is now converted to kinetic energy on the subsequent trading activity that moves the securities price. The more potential energy that is created in the consolidation, the more kinetic energy there is to move price. This is why point and figure traders are said to give price targets based on the level of volatility or size of a consolidation range, or why Gann traders square price and time, as time is roughly proportional to mass and trading activity. The build-up of potential energy between short sellers and buyers in GME or TSLA led to their explosive moves beyond their standard fundamental valuations.
Position
Position, p, is simply the price or value of a financial security or market internal.
Time
Time, t, is another means of measuring mass to discover price behavior beyond the time snapshots that simple candle charts provide. We know from E=mc^2 that time is related to rest mass and energy given the speed of light, c, where time ≈ distance * sqrt(mass/E). This relation can also be derived from F=ma. The more mass there is, the longer it takes to compute the physics of a system. The more energy there is, the shorter it takes to compute the physics of a system. Similarly, more time is required to build a “resting” low-volatility trading consolidation with more mass. More energy added to that trading consolidation by competing buyers and sellers decreases the time it takes to build that same mass. Time is also related to price through velocity.
Velocity = (p(t1) – p(t0)) / p(t0)
Velocity, v, is the relative percent change of a securities price, p, over a period of time, t0 to t1. The period of time is between subsequent candles, and since time is constant between candles within the same timeframe, it is not used to calculate velocity or acceleration. Price moves faster with higher velocity, and slower with slower velocity, over the same fixed period of time. The product of velocity and mass gives momentum.
Momentum = mv
This indicator uses physics definition of momentum, not finance’s. In finance, momentum is defined as the amount of change in a securities price, either relative or absolute. This is definition is unfortunate, pun intended, since a one dollar move in a security from a thousand shares traded between a few traders has the exact same “momentum” as a one dollar move from millions of shares traded between hundreds of traders with everything else equal. If momentum is related to the energy of the move, momentum should consider both the level of activity in a price move, and the amount of that price move. If we equate mass to volume to account for the level of trading activity and use physics definition of momentum as the product of mass and velocity, this revised definition now gives a thousand-times more momentum to a one-dollar price move that has a thousand-times more volume behind it. If you want to use finance’s volume-less definition of momentum, use velocity in this indicator.
Acceleration = v(t1) – v(t0)
Acceleration, a, is the difference between velocities over some period of time, t0 to t1. Positive acceleration is necessary to increase a securities speed in the positive direction, while negative acceleration is necessary to decrease it. Acceleration is related to force by mass.
Force = ma
Force is required to change the speed of a securities valuation. Price movements with considerable force have considerably more impact on future direction. A change in direction requires force.
Kinetic Energy = 0.5mv^2
Kinetic energy is the energy that a financial security gains from the change in its velocity by force. The built-up of potential energy in trading consolidations can be converted to kinetic energy on a breakout from the consolidation.
Cycle Theory and Relativity
Just as the physics of motion is relative to a point of reference, so too should the physics of financial securities be relative to a point of reference. An object moving at a 100 mph towards another object moving in the same direction at 100 mph will not appear to be moving relative to each other, nor will they collide, but from an outsider observer, the objects are going 100 mph and will collide with significant impact if they run into a stationary object relative to the observer. Similarly, trading with a hundred thousand shares at the open when the average volume is a couple million may have a much smaller impact on the price compared to trading a hundred thousand shares pre-market when the average volume is ten thousand shares. The point of reference used in this indicator is the average statistics collected for a given Window Time Frame for every Cycle Time Frame. The physics values are normalized relative to these statistics.
Examples
The main chart of this publication shows the Force Candles for the SPY. An intense force candle is observed pre-market that implicates the directional overtone of the day. The assumption that direction should follow force arises from physical observation. If a large object is accelerating intensely in a particular direction, it may be fair to assume that the object continues its direction for the time being unless acted upon by another force.
The second example shows a similar Force Candle for the SPY that counters the assumption made in the first example and emphasizes the importance of both motion and context. While it’s fair to assume that a heavy highly accelerating object should continue its course, if that object runs into an obstacle, say a brick wall, it’s course may deviate. This example shows SPY running into the 50% retracement wall from the low of Mar 2020, a significant support level noted in literature. The example also conveys Gann’s idea of “lost motion”, where the SPY penetrated the 50% price but did not break through it. A brick wall is not one atom thick and price support is not one tick thick. An object can penetrate only one layer of a wall and not go through it.
The third example shows how Volume Candles can be used to identify scalping opportunities on the SPY and conveys why price behavior is as important as motion and context. It doesn’t take a brick wall to impede direction if you know that the person driving the car tends to forget to feed the cats before they leave. In the chart below, the SPY breaks down to a confluence of the 5-day SMA, 20-day SMA, and an important daily trendline (not shown) after the bullish bounce from the 50% retracement days earlier. High volume candles on the SMA signify stopping volume that reverse price direction. The character of the day changes. Bulls become more aggressive than bears with higher volume on upswings and resistance, whiles bears take on a defensive position with lower volume on downswings and support. High volume stopping candles are seen after rallies, and can tell you when to take profit, get out of a position, or go short. The character change can indicate that its relatively safe to re-enter bullish positions on many major supports, especially given the overarching bullish theme from the large reaction off the 50% retracement level.
The last example emphasizes the importance of relativity. The Volume Candles in the chart below are brightest pre-market even though the open has much higher volume since the pre-market activity is much higher compared to past pre-markets than the open is compared to past opens. Pre-market behavior is a good indicator for the character of the day. These bullish Volume Candles are some of the brightest seen since the bounce off the 50% retracement and indicates that bulls are making a relatively greater attempt to bring the SPY higher at the start of the day.
Infrequently Asked Questions
Where do I start?
The default settings are what I use to scalp the SPY throughout most of the extended trading day, on a one-minute chart using SPY volume. I also overlay another Candle set containing ES future volume on the SPY price structure by setting the Physics Source to ES1! and the Number of Overlays setting to 2 for each Candle stream in order to account for pre- and post-market trading activity better. Since the closing volume is exponential-like up until the end of the regular trading day, adding additional Candle streams with a tighter Window Time Frame (e.g., 2-5 minute) in the last 15 minutes of trading can be beneficial. The Hide feature can allow you to set certain intraday timeframes to hide one Candle set in order to show another Candle set during that time.
How crazy can you get with this indicator?
I hope you can answer this question better. One interesting use case is embedding the velocity of market volume onto an internal market structure. The PCTABOVEVWAP.US is a market statistic that indicates the percent of securities above their VWAP among US stocks and is helpful for determining short term trends in the US market. When securities are rising above their VWAP, the average long is up on the day and a rising PCTABOVEVWAP.US can be viewed as more bullish. When securities are falling below their VWAP, the average short is up on the day and a falling PCTABOVEVWAP.US can be viewed as more bearish. (UPVOL.US - DNVOL.US) / TVOL.US is a “spread” symbol, in TV parlance, that indicates the decimal percent difference between advancing volume and declining volume in the US market, showing the relative flow of volume between stocks that are up on the day, and stocks that are down on the day. Setting PCTABOVEVWAP.US in the Candle Source, (UPVOL.US - DNVOL.US) / TVOL.US in the Physics Source, and selecting the Physics to Velocity will embed the relative velocity of the spread symbol onto the PCTABOVEVWAP.US candles. This can be helpful in seeing short term trends in the US market that have an increasing amount of volume behind them compared to other trends. The chart below shows Volume Candles (top) and these Spread Candles (bottom). The first top at 9:30 and second top at 10:30, the high of the day, break down when the spread candles light up, showing a high velocity volume transfer from up stocks to down stocks.
How do I plot the indicator distribution and why should I even care?
The distribution is visually helpful in seeing how different normalization settings effect the distribution of candle segments. It is also helpful in seeing what physics intensities you want to ignore or show by segmenting part of the distribution within the Min and Max Cutoff values. The intensity of color is proportional to the physics value between the Min and Max Cutoff values, which correspond to the Min and Max Colors in your color scheme. Any physics value outside these Min and Max Cutoffs will be the same as the Min and Max Colors.
Select the Print Windows feature to show the window numbers according to the Cycle Time Frame and Window Time Frame settings. The window numbers are labeled at the start of each window and are candle width in size, so you may need to zoom into to see them. Selecting the Plot Window feature and input the window number of interest to shows the distribution of physics values for that particular window along with some statistics.
A log-normal volume distribution of segmented z-scores is shown below for 30-minute opening of the SPY. The Min and Max Cutoff at the top of the graph contain the part of the distribution whose intensities will be linearly color-coded between the Min and Max Colors of the color scheme. The part of the distribution below the Min Cutoff will be treated as lowest quality signals and set to the Min Color, while the few segments above the Max Cutoff will be treated as the highest quality signals and set to the Max Color.
What do I do if I don’t see anything?
Troubleshooting issues with this indicator can involve checking for error messages shown near the indicator name on the chart or using the Data Validation section to evaluate the statistics and normalization cutoffs. For example, if the Plot Window number is set to a window number that doesn’t exist, an error message will tell you and you won’t see any candles. You can use the Print Windows option to show windows that do exist for you current settings. The auto-normalization cutoff values may be inappropriate for your particular use case and literally cut the candles out of the chart. Try changing the chart time frame to see if they are appropriate for your cycle, sample and window time frames. If you get a “Timeframe passed to the request.security_lower_tf() function must be lower than the timeframe of the main chart” error, this means that the chart timeframe should be increased above the sample time frame. If you get a “Symbol resolve error”, ensure that you have correct symbol or spread in the Candle or Physics Source.
How do I see a relative physics values without cycles?
Set the Window Time Frame to be equal to the Cycle Time Frame. This will aggregate all the statistics into one bucket and show the physics values, such as volume, relative to all the past volumes that TV will allow.
How do I see candles without segmentation?
Segmentation can be very helpful in one context or annoying in another. Segmentation can be removed by setting the candle resolution value to 1.
Notes
I have yet to find a trading platform that consistently provides accurate real-time volume and pricing information, lacking adequate end-user data validation or quality control. I can provide plenty of examples of real-time volume counts or prices provided by TradingView and other platforms that were significantly off from what they should have been when comparing against the exchanges own data, and later retroactively corrected or not corrected at all. Since no indicator can work accurately with inaccurate data, please use at your own discretion.
The first version is a beta version. Debugging and validating code in Pine script is difficult without proper unit testing. Please report any bugs with enough information to reproduce them and indicate why they are important. I also encourage you to export the data from TradingView and verify the calculations for your particular use case.
The indicator works on real-time updates that occur at a higher frequency than the candle time frame, which TV incorrectly refers to as ticks. They use this terminology inaccurately as updates are really aggregated tick data that can take place at different prices and may not accurately reflect the real tick price action. Consequently, this inaccuracy also impacts the real-time segmentation accuracy to some degree. TV does not provide a means of retaining “tick” information, so the higher granularity of information seen real-time will be lost on a disconnect.
TV does not provide time and sales information. The volume and price information collected using the Sample Time Frame is intraday, which provides only part of the picture. Intraday volume is generally 50 to 80% of the end of day volume. Consequently, the daily+ OHLC prices are intraday, and may differ significantly from exchanged settled OHLC prices.
The Cycle and Window Time Frames refer to calendar days and time, not trading days or time. For example, the first window week of a monthly cycle is the first seven days of the month, not the first Monday through Friday of trading for the month.
Chart Time Frames that are higher than the Window Time Frames average the normalized physics for price action that occurred within a given Candle segment. It does not average price action that did not occur.
One of the main performance bottleneck in TradingView’s Pine Script is client-side drawing and plotting. The performance of this indicator can be increased by lowering the resolution (the number of sub-candles this indicator plots), getting a faster computer, or increasing the performance of your computer like plugging your laptop in and eliminating unnecessary processes.
The statistical integrity of this indicator relies on the number of samples collected per sample window in a given cycle. Higher sample counts can be obtained by increasing the chart time frame or upgrading the TradingView plan for a higher bar count. While increasing the chart time frame doesn’t increase the visual number of bars plotted on the chart, it does increase the number of bars that can be pulled at a lower time frame, up to 100,000.
Due to a limitation in Pine Scripts request_lower_tf() function, using a spread symbol will only work for regular trading hours, not extended trading hours.
Ideally, velocity or momentum should be calculated between candle closes. To eliminate the need to deal with price gaps that would lead to an incorrect statistical distributions, momentum is calculated between candle open and closes as a percent change of the price or value, which should not be an issue for most liquid securities.

Kendall Rank Correlation Coefficient (alt)This is a non-parametric correlation statistical test, which is less sensitive to magnitude and more to direction, hence why some people call this a "concordance test".
This indicator was originally created by Alex Orekhov (everget), if you like this one, please show the original author some love:
This version is extended by tartigradia (2022) to make it more readily useable:
* Update to pinescript v5
* Default compare to current symbol (instead of only fixed symbols)
* Add 1.0, 0.0 and -1.0 correlation levels lines.
This indicator plots both the Kendall correlation in orange, and the more classical parametric Pearson correlation in purple for comparison. Either can be disabled in the Style tab.
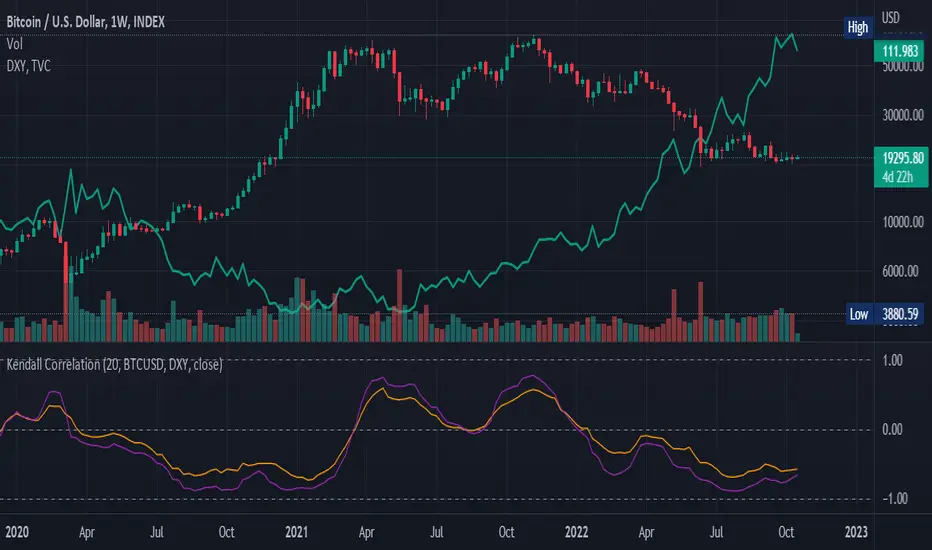
MTF MACD BarOVERVIEW
This indicator shows MACD(Moving Average Convergence/Divergence) is up or down, represented by a bar. This indicator is compatible with MTF.
CONCEPTS
What do you want to know about market analysis?
Do you want a hard analysis? You can look for it.
All I want to know is whether the commonly known technical analysis is 'UP' or 'DOWN'.
All I want to know is whether the current market price is going up or down. Not only for the current, but also for the monthly, weekly, and daily status.
I want to make a decision in a moment. Without even thinking about it.
That is why I created a color-coded bar indicator to show the status.
No need to frown anymore.
DETAILS
You need more information about MACD, click here.
tradingview.com
MACD histogram Green ⇒ Bar is green.
MACD histogramRed ⇒ Bar is red.

MTF Heikinashi BarOVERVIEW
This indicator shows whether Heikin Ashi is up or down, represented by a bar. This indicator is compatible with MTF.
CONCEPTS
What do you want to know about market analysis?
Do you want a hard analysis? You can look for it.
All I want to know is whether the commonly known technical analysis is 'UP' or 'DOWN'.
All I want to know is whether the current market price is going up or down. Not only for the current, but also for the monthly, weekly, and daily status.
I want to make a decision in a moment. Without even thinking about it.
That is why I created a color-coded bar indicator to show the status.
No need to frown anymore.
DETAILS
Heikin means average. Ashi means legs. In this case, it means a candle.
Close = (Close + Open + High + Low) / 4
For more information, click here.
tradingview.com
Heikin Ashi Up ⇒ green
Heikin Ashi Down ⇒ red
