Multiple Colored Moving AveragesMULTIPLE COLORED MOVING AVERAGES - USER GUIDE
DISCLAIMER
----------
Both the code and this documentation were created heavily using artificial intelligence. I'm lazy...
This indicator was inspired by repo32's "Moving Average Colored EMA/SMA" indicator. *
What is this indicator?
-----------------------
This is a TradingView indicator that displays up to 4 different moving averages on your chart simultaneously. Each moving average can be customized with different calculation methods, colors, and filtering options.
Why would I use multiple moving averages?
-----------------------------------------
- See trend direction across different timeframes at once
- Identify support and resistance levels
- Spot crossover signals between fast and slow MAs
- Reduce false signals with filtering options
- Compare how different MA types react to price action
What moving average types are available?
----------------------------------------
11 different types:
- SMA: Simple average, equal weight to all periods
- EMA: Exponential, more weight to recent prices
- WMA: Weighted, linear weighting toward recent data
- RMA: Running average, smooth like EMA
- DEMA: Double exponential, reduced lag
- TEMA: Triple exponential, even less lag
- HMA: Hull, fast and smooth combination
- VWMA: Volume weighted, includes volume data
- LSMA: Least squares, based on linear regression
- TMA: Triangular, double-smoothed
- ZLEMA: Zero lag exponential, compensated for lag
How do I set up the indicator?
------------------------------
Each MA has these settings:
- Enable/Disable: Turn each MA on or off
- Type: Choose from the 11 calculation methods
- Length: Number of periods (21, 50, 100, 200 are common)
- Smoothing: 0-10 levels of extra smoothing
- Noise Filter: 0-5% to ignore small changes
- Colors: Bullish (rising) and bearish (falling) colors
- Line Width: 1-5 pixels thickness
What does the smoothing feature do?
-----------------------------------
Smoothing applies extra calculations to make the moving average line smoother. Higher levels reduce noise but make the MA respond slower to price changes. Use higher smoothing in choppy markets, lower smoothing in trending markets.
What is the noise filter?
--------------------------
The noise filter ignores small percentage changes in the moving average. For example, a 0.3% filter will ignore any MA movement smaller than 0.3%. This helps eliminate false signals from minor price fluctuations.
When should I use this indicator?
---------------------------------
- Trend analysis: See if market is going up, down, or sideways
- Entry timing: Look for price bounces off MA levels
- Exit signals: Watch for MA slope changes or crossovers
- Support/resistance: MAs often act as dynamic levels
- Multi-timeframe analysis: Use different lengths for different perspectives
What are some good settings to start with?
-------------------------------------------
Conservative approach:
- MA 1: EMA 21 (short-term trend)
- MA 2: SMA 50 (medium-term trend)
- MA 3: SMA 200 (long-term trend)
- Low noise filtering (0.1-0.3%)
Active trading:
- MA 1: HMA 9 (very responsive)
- MA 2: EMA 21 (short-term)
- MA 3: EMA 50 (medium-term)
- Minimal or no smoothing
How do I interpret the colors?
------------------------------
Each MA changes color based on its direction:
- Bullish color: MA is rising (upward trend)
- Bearish color: MA is falling (downward trend)
- Gray: MA is flat or unchanged
What should I look for in crossovers?
-------------------------------------
- Golden Cross: Fast MA crosses above slow MA (bullish signal)
- Death Cross: Fast MA crosses below slow MA (bearish signal)
- Multiple crossovers in same direction can confirm trend changes
- Wait for clear separation between MAs after crossover
How do I use MAs for support and resistance?
---------------------------------------------
- In uptrends: MAs often provide support when price pulls back
- In downtrends: MAs may act as resistance on rallies
- Multiple MAs create support/resistance zones
- Stronger levels where multiple MAs cluster together
Can I use this with other indicators?
-------------------------------------
Yes, it works well with:
- Volume indicators for confirmation
- RSI or MACD for timing entries
- Bollinger Bands for volatility context
- Price action patterns for setup confirmation
What if I get too many signals?
-------------------------------
- Increase smoothing levels
- Raise noise filter percentages
- Use longer MA periods
- Focus on major crossovers only
- Wait for multiple MA confirmation
What if signals are too slow?
-----------------------------
- Reduce smoothing to 0
- Lower noise filter values
- Switch to faster MA types (HMA, ZLEMA, DEMA)
- Use shorter periods
- Focus on the fastest MA only
Which MA types work best in different markets?
----------------------------------------------
Trending markets: EMA, DEMA, TEMA (responsive to trends)
Choppy markets: SMA, TMA, HMA with smoothing (less whipsaws)
High volatility: Use higher smoothing and noise filtering
Low volatility: Use minimal filtering for better responsiveness
Do I need all the advanced features?
------------------------------------
No. Start with basic settings:
- Choose MA type and length
- Set colors you prefer
- Leave smoothing at 0
- Leave noise filter at 0
Add complexity only if needed to improve signal quality.
How do I know if my settings are working?
-----------------------------------------
- Backtest on historical data
- Paper trade the signals first
- Adjust based on market conditions
- Keep a trading journal to track performance
- Be willing to modify settings as markets change
Can I save different configurations?
------------------------------------
Yes, save different indicator templates in TradingView for:
- Different trading styles (scalping, swing trading)
- Different market conditions (trending, ranging)
- Different instruments (stocks, forex, crypto)
Cerca negli script per "Up down"

Smart Money Breakout Channels [AlgoAlpha]🟠 OVERVIEW
This script draws breakout detection zones called “Smart Money Breakout Channels” based on volatility-normalized price movement and visualizes them as dynamic boxes with volume overlays. It identifies temporary accumulation or distribution ranges using a custom normalized volatility metric and tracks when price breaks out of those zones—either upward or downward. Each channel represents a structured range where smart money may be active, helping traders anticipate key breakouts with added context from volume delta, up/down volume, and a visual gradient gauge for momentum bias.
🟠 CONCEPTS
The script calculates normalized price volatility by measuring the standard deviation of price mapped to a scale using the highest and lowest prices over a set lookback period. When normalized volatility reaches a local low and flips upward, a boxed channel is drawn between the highest and lowest prices in that zone. These boxes persist until price breaks out, either with a strong candle close (configurable) or by touching the boundary. Volume analysis enhances interpretation by rendering delta bars inside the box, showing volume distribution during the channel. Additionally, a real-time visual “gauge” shows where volume delta sits within the channel range, helping users spot pressure imbalances.
🟠 FEATURES
Automatic detection and drawing of breakout channels based on volatility-normalized price pivots.
Optional nested channels to allow multiple simultaneous zones or a clean single-zone view.
Gradient-filled volume gauge with dynamic pointer to show current delta pressure within the box.
Three volume visualization modes: raw volume, comparative up/down volume, and delta.
Alerts for new channel creation and confirmed bullish or bearish breakouts.
🟠 USAGE
Apply the indicator to any chart. Wait for a new breakout box to form—this occurs when volatility behavior shifts and a stable range emerges. Once a box appears, monitor price relative to its boundaries. A breakout above suggests bullish continuation, below suggests bearish continuation; signals are stronger when “Strong Closes Only” is enabled.
Watch the internal volume candles to understand where buy/sell pressure is concentrated during the box. Use the gauge on the right to interpret whether net pressure is building upward or downward before breakout to anticipate the direction.
Use alerts to catch breakout events without needing to monitor the chart constantly 🚨.

Candle Count RSI📈 Candle Count RSI — A Dual-Perspective Momentum Engine
The Candle Count RSI is a custom-built momentum oscillator that expands on the classic Relative Strength Index (RSI) by introducing a directional-only variant that tracks the frequency of bullish or bearish closes, rather than price magnitude. It gives traders a second lens through which to evaluate momentum, trend conviction, and subtle divergences—often invisible to traditional price-based RSI.
💡 What Makes It Unique?
While the standard RSI is sensitive to the size of price changes, the Candle Count RSI is magnitude-blind. It counts candle closes above/below open over a lookback period, generating a purer signal of directional consistency. To enhance signal fidelity, it includes a streak amplifier, dynamically weighting extended runs of green or red candles to reflect intensity of market bias—without introducing artificial price sensitivity.
This dual-RSI approach allows for:
- Divergence detection between directional bias and price magnitude.
- Smoother trend confirmation in choppy markets.
- Cleaner visual cues using dynamic glow and background logic.
📐 How Standard RSI Actually Works (Not What You Think)
RSI doesn’t just check if price went up or down over a span—it checks each individual candle and tracks whether it closed higher or lower than the one before. Here's how it works under the hood:
1.) For each bar, it calculates the change from the previous close.
2.) It separates those changes into gains (upward moves) and losses (downward moves).
3.) Then it computes a smoothed average of those gains and losses (usually using an RMA).
4.) It calculates the Relative Strength (RS) as:
RS = AvgGain / AvgLoss
5.) Finally, it plugs that into the RSI formula:
RSI = 100 - (100 / (1 + RS))
⚖️ What Does the 50 Line Mean?
- The RSI scale runs from 0 to 100, but 50 is the true neutral zone:
- RSI > 50 means average gains outweigh average losses over the period.
- RSI < 50 means losses dominate.
- RSI ≈ 50? The market is balanced—momentum is indecisive, no clear trend bias.
- This makes 50 a powerful midline for trend filters, directional bias tools, and divergence detection—especially when paired with alternative RSI logic like Candle Count RSI.
🔧 Inputs and Customization
- Everything is fully modular and customizable:
🧠 Core Settings
- RSI Length: Used for both the standard RSI and Candle Count RSI.
📉 Standard RSI
- Classic RSI calculation based on price changes.
- Optional WMA smoothing to reduce noise.
- Glow effect toggle with custom intensity.
🕯 Candle Count RSI
- Computes RSI using only the count of up/down candles.
- Optional smoothing for stability.
- Amplifies streaks (e.g., multiple consecutive bullish candles increase strength).
- Glow effect toggle with adjustable strength.
🎇 Glow Visuals
- Background glow (subpane and/or main chart).
- Fades based on RSI distance from the 50 midpoint.
- Independent color settings for bull and bear bias.
🧬 Divergence Zones
- Detects when Candle RSI and Standard RSI diverge.
- Highlights:
- Bullish Divergence: Candle RSI > 50, Standard RSI < threshold.
- Bearish Divergence: Candle RSI < 50, Standard RSI > threshold.
- Background fill optionally shown in subpane and/or main chart.
📊 Directional Histogram
- MACD-style histogram showing the difference between the two RSI lines.
- Color-coded based on directional agreement:
- Both rising → green.
- Both falling → red.
- Conflict → yellow.
🧠 Under the Hood — How It Works
🔹 Standard RSI
- Classic ta.rsi() applied to close prices, optionally WMA-smoothed.
🔹 Candle Count RSI (CCR)
- Counts how many candles closed up/down over the period.
- Computes a magnitude-free RSI from these counts.
- Applies a streak-based multiplier to exaggerate trend strength during consecutive green/red runs.
- Optionally smoothed with WMA to create a clean signal line.
- This makes CCR ideal for detecting true directional bias without being faked out by volatile price spikes.
🔹 Divergence Logic
- When Candle RSI and Standard RSI disagree strongly across defined thresholds, background fills highlight early signs of momentum decay or hidden accumulation/distribution.
🔹 Glow Logic
- Glow zones are controlled by a master toggle and drawn with dynamic transparency:
- Further from 50 = stronger conviction = darker glow.
- Shows up in subpane and/or main chart depending on user preference.
📷 Suggested Use Case / Visual Setup
- Use in conjunction with your primary price action system.
- Watch for divergences between the Candle Count RSI and Standard RSI for early trend reversals.
- Use glow bias zones on the main chart to get subconscious directional cues during fast scalping.
- Histogram helps you confirm when both RSI variants agree—useful during strong trending conditions.
🛠️ Tip for Traders
- This tool isn’t trying to “predict” price. It’s designed to visualize hidden market psychology—when buyers are showing up with consistent pressure, or when momentum has a disconnect between conviction and magnitude. Use this to filter entries, spot weak rallies, or sense when a trend is about to break down.
⚠️ WARNING
- Not for use with Heikin Ashi, Renko, etc.).
🧠 Summary
Candle Count RSI is not just another mashup—it's a precision-built, dual-perspective oscillator that captures directional conviction using real candle behavior. Whether you're scalping intraday or swing trading momentum, this script helps clarify trend integrity and exposes hidden weaknesses with elegance and clarity.
—
🛠️ Built by: Sherlock_MacGyver
Feel free to share feedback or reach out if you'd like to collaborate on custom features.

Auto Support Resistance Channels [TradingFinder] Top/Down Signal🔵 Introduction
In technical analysis, a price channel is one of the most widely used tools for identifying and tracking price trends. A price channel consists of two parallel trendlines, typically drawn from swing highs (resistance) and swing lows (support). These lines define dynamic support and resistance zones and provide a clear framework for interpreting price fluctuations.
Drawing a channel on a price chart allows the analyst to more precisely identify entry points, exit levels, take-profit zones, and stop-loss areas based on how the price behaves within the boundaries of the channel.
Price channels in technical analysis are generally categorized into three types: upward channels with a positive slope, downward channels with a negative slope, and horizontal (range-bound) channels with near-zero slope. Each type offers unique insights into market behavior depending on the price structure and prevailing trend.
Structurally, channels can be formed using either minor or major pivot points. A major channel typically reflects a stronger, more reliable structure that appears on higher timeframes, whereas a minor channel often captures short-term fluctuations or corrective movements within a larger trend.
For instance, a major downward channel may indicate sustained selling pressure across the market, while a minor upward channel could represent a temporary pullback within a broader bearish trend.
The validity of a price channel depends on several factors, including the number of price touches on the channel lines, the symmetry and parallelism of the trendlines, the duration of price movement within the channel, and price behavior around the median line.
When a price channel is broken, it is generally expected that the price will move in the breakout direction by at least the width of the channel. This makes price channels especially useful in breakout analysis.
In the following sections, we will explore the different types of price channels, how to draw them accurately, the structural differences between minor and major channels, and key trade interpretations when price interacts with channel boundaries.
Up Channel :
Down Channel :
🔵 How to Use
A price channel is a practical tool in technical analysis for identifying areas of support, resistance, trend direction, and potential breakout zones. The structure consists of two parallel trendlines within which price fluctuates.
Traders use the relative position of price within the channel to make informed trading decisions. The two primary strategies include range-based trades (buying low, selling high) and breakout trades (entering when price exits the channel).
🟣 Up Channel
In an upward channel, price moves within a positively sloped range. The lower trendline acts as dynamic support, while the upper trendline serves as dynamic resistance. A common strategy involves buying near the lower support and taking profit or selling near the upper resistance.
If price breaks below the lower trendline with strong volume or a decisive candle, it can signal a potential trend reversal. Channels constructed from major pivots generally reflect dominant uptrends, while those based on minor pivots are often corrective structures within a broader bearish movement.
🟣 Down Channel
In a downward channel, price moves between two negatively sloped lines. The upper trendline functions as resistance, and the lower trendline as support. Ideal entry for short trades occurs near the upper boundary, especially when confirmed by bearish price action or a resistance level.
Exit targets are typically located near the lower support. If the upper boundary is broken to the upside, it may be an early sign of a bullish trend reversal. Like upward channels, a major down channel represents broader selling pressure, while a minor one may indicate a brief retracement in a bullish move.
🟣 Range Channel
A horizontal or range-bound channel is characterized by price oscillating between two nearly flat lines. This type of channel typically appears during sideways markets or periods of consolidation.
Traders often buy near the lower boundary and sell near the upper boundary to take advantage of contained volatility. However, fake breakouts are more frequent in range-bound structures, so it is important to wait for confirmation through candlestick signals and volume. A confirmed breakout beyond the channel boundaries can justify entering a trade in the direction of the breakout.
🔵 Settings
Pivot Period :This parameter defines how sensitive the channel detection is. A higher value causes the algorithm to identify major pivot points, resulting in broader and longer-term channels. Lower values focus on minor pivots and create tighter, short-term channels.
🔔 Alerts
Alert Configuration :
Enable or disable the full alert system
Set a custom alert name
Choose the alert frequency: every time, once per bar, or on bar close
Define the time zone for alert timestamps (e.g., UTC)
Channel Alert Types :
Each channel type (Major/Minor, Internal/External, Up/Down) supports two alert types :
Break Alert : Triggered when price breaks above or below the channel boundaries
React Alert : Triggered when price touches and reacts (bounces) off the channel boundary
🎨 Display Settings
For each of the eight channel types, you can customize:
Visibility : show or hide the channel
Auto-delete previous channels when new ones are drawn
Style : line color, thickness, type (solid, dashed, dotted), extension (right only, both sides)
🔵 Conclusion
The price channel is a foundational structure in technical analysis that enables traders to analyze price movement, identify dynamic support and resistance zones, and locate potential entry and exit points with greater precision.
When constructed properly using minor or major pivots, a price channel offers a consistent and intuitive framework for interpreting market behavior—often simpler and more visually clear than many other technical tools.
Understanding the differences between upward, downward, and range-bound channels—as well as recognizing the distinctions between minor and major structures—is critical for selecting the right trading strategy. Upward channels tend to generate buying opportunities, downward channels prioritize short setups, and horizontal channels provide setups for both mean-reversion and breakout trades.
Ultimately, the reliability of a price channel depends on various factors such as the number of touchpoints, the duration of the channel, the parallelism of the lines, and how the price reacts to the median line.
By taking these factors into account, an experienced analyst can effectively use price channels as a powerful tool for trend forecasting and precise trade execution. Although conceptually simple, successful application of price channels requires practice, pattern recognition, and the ability to filter out market noise.

Rev & Line - CoffeeKillerRev & Line - CoffeeKiller Indicator Guide
🔔 Warning: This Indicator Repaints 🔔 This indicator uses real-time calculations that may change based on future price action. As a result, signals (such as arrows, lines, or color changes) **can and will repaint** — meaning they may appear, disappear, or shift after a candle closes.
**Do not rely on this tool alone for live trading decisions.** Use with caution and always confirm with non-repainting tools or additional analysis.(This indicator is designed to show me the full length of the trend and because of this there can be a smaller movement inside of the trend movement)
Welcome traders! This guide will walk you through the Rev & Line indicator, a sophisticated technical analysis tool developed by CoffeeKiller that combines multiple methodologies to identify market pivots, trends, and potential reversal points.
Core Components
1. ZigZag Analysis
- Dynamic pivot detection using ATR (Average True Range)
- Customizable sensitivity through ATR Reversal Factor
- Color-coded trend lines (green for upward, red for downward)
- Optional vertical lines at pivot points
- Real-time pivot point analysis
2. Donchian Channel Integration
- Traditional upper, lower, and middle bands
- Customizable length and displacement
- Channel-based entry signals
- Dynamic market structure visualization
3. Marker Lines System
- Dynamic support/resistance level tracking
- Pivot-based reset mechanism
- Optional fill zones between markers
- Percentage position tracking within range
4. Signal Generation System
- Confluence between ZigZag pivots and Donchian channels
- Up/down arrow visualization
- Alert system
Main Features
ZigZag Settings
- ATR Reversal Factor: Controls pivot sensitivity (default 3.2)
- Customizable line appearance:
Width control (default: 3)
Color selection (green for uptrend, red for downtrend)
Vertical line options at pivot points
Maximum vertical lines display limit
- Hide repainted option for more reliable signals
Donchian Channel Configuration
- Optional channel visibility toggle
- Length parameter for lookback period (default: 20)
- Displace option for time offset
- Bubble offset for visual placement
Marker Lines System
- High/low/middle marker lines with step-line visualization
- Dotted line projections for future reference
- Pivot-based reset mechanism
- Color-coded percentage position display
Signal Generation
- Triangle markers for signals
- Combined ZigZag and Donchian confluence
- Alert system for notifications
Visual Elements
1. Pivot Lines
- Green: Upward price movements
- Red: Downward price movements
- Customizable line width
- Optional vertical pivot markers with style options:
Solid lines for confirmed pivots
Dashed lines for older pivots
Dotted lines for most recent pivots
2. Donchian Channels
- Upper band (red): Resistance level
- Lower band (green): Support level
- Middle band (yellow): Median price line
- Customizable display options
3. Marker Lines
- High marker line (magenta): Tracks highest open price
- Low marker line (cyan): Tracks lowest open price
- Middle marker line (blue): 50% level between high/low
- Dotted line extensions for future price projections
4. Position Tracking
- Percentage position display within marker range
- Real-time calculations from 0% to 100%
- Label system for visual reference
Trading Applications
1. Trend Following
- Enter on confirmed ZigZag pivot points
- Use Donchian channel boundaries as targets
- Trail stops using marker lines
- Monitor for confluence between systems
2. Counter-Trend Trading
- Trade bounces from marker lines
- Use pivot confirmation for entry timing
- Set stops based on recent pivot points
- Target the opposite marker line
3. Range Trading
- Use high/low marker lines to define range
- Trade bounces between upper and lower markers
- Consider middle marker for range midpoint
- Monitor percentage position within range
4. Breakout Trading
- Enter on breaks above/below marker lines
- Confirm with Donchian channel breakouts
- Use ZigZag pivot confirmations
- Wait for arrow signals for additional confirmation
Optimization Guide
1. ZigZag Parameters
- Higher ATR Factor: Less sensitive, major moves only
- Lower ATR Factor: More sensitive, catches minor moves
- Adjust line width for chart visibility
- Balance vertical line count for clarity
2. Donchian Channel Settings
- Longer length: Smoother channels, fewer false signals
- Shorter length: More responsive, but potentially noisier
- Displacement: Offset for historical reference
- Consider timeframe when setting parameters
3. Marker Line Configuration
- Enable/disable based on trading style
- Toggle middle line for additional reference
- Adjust colors for visual clarity
- Enable/disable labels as needed
4. Signal Generation
- Use "Hide repainted" option for more reliable signals
- Combine ZigZag and Donchian signals for confirmation
- Set alerts based on confirmed pivot points
- Balance sensitivity with reliability
Best Practices
1. Signal Confirmation
- Wait for confirmed pivot points
- Check for Donchian channel interactions
- Confirm with price action
- Look for arrow signals at pivot points
2. Risk Management
- Use recent pivot points for stop placement
- Consider marker line boundaries for targets
- Don't trade against strong trends
- Wait for clear confluence between systems
3. Setup Optimization
- Start with default settings
- Adjust based on timeframe
- Fine-tune ATR sensitivity
- Match settings to trading style
Advanced Features
1. Alert System
- Customizable arrow alerts
- Pivot point notifications
- Text message alerts with ticker information
- Once-per-bar frequency option
2. Pivot Detection Logic
The indicator uses a sophisticated state-based approach to detect pivots:
- State transitions between "uptrend," "downtrend," and "undefined"
- ATR-based reversal detection
- Minimum movement threshold for pivot confirmation
- Historical pivot tracking and labeling
3. Marker Line Reset Mechanism
- Marker lines reset based on pivot detection
- Dynamic support/resistance level adjustment
- Percentage position calculation within range
- Automatic updates as market structure changes
Remember:
- Combine multiple confirmation signals
- Use appropriate timeframe settings
- Monitor both ZigZag and Marker signals
- Pay attention to Donchian channel interactions
- Consider market volatility when trading
This indicator works best when:
- Used with proper risk management
- Combined with other technical tools
- Applied to appropriate timeframes
- Signals are confirmed by price action
**DISCLAIMER**: This indicator and its signals are intended solely for educational and informational purposes. They do not constitute financial advice. Trading involves significant risk of loss. Always conduct your own analysis and consult with financial professionals before making trading decisions.

Leverage Aware Trade OptimizerWelcome to the Leverage-Aware Trade Optimizer (LATO)! I’m thrilled to have you exploring this dynamic algorithm! LATO combines advanced market oscillation tracking, leverage-aware trade optimization, and real-time market analysis to help you make smarter, more informed trading decisions. Whether you're just starting or you’re an experienced trader, LATO provides powerful tools and insights to enhance your strategies. LATO is here to support you in optimizing your trades with precision, so feel free to dive in and explore all the features. Let’s make your trading experience as effective and rewarding as possible. Safe trading!
Leverage-Aware Trade Optimizer (LATO)
Short Title: LATO
Category: Trading Tools / Technical Analysis
Overview
The Leverage-Aware Trade Optimizer (LATO) is a powerful algorithm designed to track and analyze market oscillations, identify reversal zones, and provide dynamic trading levels for optimal decision-making. With built-in risk management features, LATO enhances traders’ ability to make well-informed decisions based on a comprehensive range of market indicators, including price oscillations, probabilities, and leverage-related risks.
Key Features
Comprehensive Market Oscillation Tracking: LATO utilizes advanced indicators such as the Indexed Position Oscillator (IPO), Candle Relative Percentage (CRP), and Oscillating Range Indicator (ORI) to track price fluctuations and detect key market oscillations, providing a detailed view of price movements.
Dynamic Price Levels for Trading Decisions: The script calculates critical price levels such as WAP, WBP, XAP, and XBP. These weighted and expanded prices help identify potential support and resistance zones for accurate trade entries and exits.
Reversal Detection and Trend Identification: LATO is designed to recognize top and bottom reversal zones using user-defined thresholds (e.g., upper_reversal, lower_reversal). The algorithm signals potential trend changes with event markers such as UP, DOWN, UIP, and DIP, enabling traders to anticipate market reversals.
Risk and Leverage Mapping: By estimating liquidation levels for various leverage values (5x, 10x, 20x, etc.), LATO assists in risk management, helping traders visualize leverage exposure and optimize their trades according to risk tolerance.
Integrated Visualization and Event Labels: LATO enhances visual analysis by plotting key levels, trend lines, and event markers on the chart. Custom labels summarize critical values, including SOD (Sell Odds), BOD (Buy Odds), ORI (Oscillating Range Indicator), and PVI (Price Volatility Index), offering a quick, actionable summary for traders.
User Inputs
Orders Deviation (order_deviation): Controls the deviation for calculating trade levels.
Top Reversal (upper_reversal): Sets the threshold for the upper reversal zone.
Bottom Reversal (lower_reversal): Sets the threshold for the lower reversal zone.
How It Works
LATO tracks market oscillations through the Indexed Position Oscillator (IPO) and Candle Relative Percentage (CRP), dynamically adjusting as the market fluctuates. The algorithm then identifies key levels using weighted prices (e.g., WAP, WBP) and generates reversal signals based on defined thresholds.
Once the Leverage-Aware Trade Optimizer (LATO) is applied to a chart, it automatically calculates dynamic support and resistance levels and identifies potential buying or selling opportunities. The script also plots liquidation zones based on different leverage levels and visualizes these areas through color-coded lines.
Use Case Scenarios
Trend Reversal Detection: Identify when the market is likely to reverse based on the ORI and price action.
Dynamic Price Levels: Use the weighted price levels and trend lines to pinpoint entry/exit points.
Leverage Risk Management: Monitor liquidation levels and use them for managing risk while trading with leverage.
Oscillation Tracking: Track key oscillations for detecting overbought or oversold conditions.
Alert Setup for LATO
You can set up alerts based on the key conditions like UP, DOWN, UIP, and DIP, as well as specific market movements.
Down Trend Alert (DOWN): Alerts when there’s a downtrend, triggered by a crossover of WBP and BL5, with specific conditions for ORI and SOD.
Up Trend Alert (UP): Alerts when there’s an uptrend, triggered by a crossunder of WAP and SL5, with ORI below -0.5.
Upper Reversal Alert (UIP): Alerts when ORI crosses below the lower_reversal threshold.
Downward Reversal Alert (DIP): Alerts when ORI crosses above the upper_reversal threshold.
Conclusion
The Leverage-Aware Trade Optimizer (LATO) is a comprehensive trading tool designed for traders seeking to optimize their trade entries and exits. By combining multiple indicators, dynamic price levels, and reversal zone detection, LATO offers an advanced approach to market analysis and decision-making. Whether you’re trading with leverage or simply looking for trend confirmation, LATO provides the insights you need to maximize your trading potential.
Notes
This script is designed to be used on any time frame.
Adjust the order_deviation parameter based on the asset volatility you are trading.
The reversal thresholds (upper and lower) should be fine-tuned depending on market conditions.

Ensemble Alerts█ OVERVIEW
This indicator creates highly customizable alert conditions and messages by combining several technical conditions into groups , which users can specify directly from the "Settings/Inputs" tab. It offers a flexible framework for building and testing complex alert conditions without requiring code modifications for each adjustment.
█ CONCEPTS
Ensemble analysis
Ensemble analysis is a form of data analysis that combines several "weaker" models to produce a potentially more robust model. In a trading context, one of the most prevalent forms of ensemble analysis is the aggregation (grouping) of several indicators to derive market insights and reinforce trading decisions. With this analysis, traders typically inspect multiple indicators, signaling trade actions when specific conditions or groups of conditions align.
Simplifying ensemble creation
Combining indicators into one or more ensembles can be challenging, especially for users without programming knowledge. It usually involves writing custom scripts to aggregate the indicators and trigger trading alerts based on the confluence of specific conditions. Making such scripts customizable via inputs poses an additional challenge, as it often involves complicated input menus and conditional logic.
This indicator addresses these challenges by providing a simple, flexible input menu where users can easily define alert criteria by listing groups of conditions from various technical indicators in simple text boxes . With this script, you can create complex alert conditions intuitively from the "Settings/Inputs" tab without ever writing or modifying a single line of code. This framework makes advanced alert setups more accessible to non-coders. Additionally, it can help Pine programmers save time and effort when testing various condition combinations.
█ FEATURES
Configurable alert direction
The "Direction" dropdown at the top of the "Settings/Inputs" tab specifies the allowed direction for the alert conditions. There are four possible options:
• Up only : The indicator only evaluates upward conditions.
• Down only : The indicator only evaluates downward conditions.
• Up and down (default): The indicator evaluates upward and downward conditions, creating alert triggers for both.
• Alternating : The indicator prevents alert triggers for consecutive conditions in the same direction. An upward condition must be the first occurrence after a downward condition to trigger an alert, and vice versa for downward conditions.
Flexible condition groups
This script features six text inputs where users can define distinct condition groups (ensembles) for their alerts. An alert trigger occurs if all the conditions in at least one group occur.
Each input accepts a comma-separated list of numbers with optional spaces (e.g., "1, 4, 8"). Each listed number, from 1 to 35, corresponds to a specific individual condition. Below are the conditions that the numbers represent:
1 — RSI above/below threshold
2 — RSI below/above threshold
3 — Stoch above/below threshold
4 — Stoch below/above threshold
5 — Stoch K over/under D
6 — Stoch K under/over D
7 — AO above/below threshold
8 — AO below/above threshold
9 — AO rising/falling
10 — AO falling/rising
11 — Supertrend up/down
12 — Supertrend down/up
13 — Close above/below MA
14 — Close below/above MA
15 — Close above/below open
16 — Close below/above open
17 — Close increase/decrease
18 — Close decrease/increase
19 — Close near Donchian top/bottom (Close > (Mid + HH) / 2)
20 — Close near Donchian bottom/top (Close < (Mid + LL) / 2)
21 — New Donchian high/low
22 — New Donchian low/high
23 — Rising volume
24 — Falling volume
25 — Volume above average (Volume > SMA(Volume, 20))
26 — Volume below average (Volume < SMA(Volume, 20))
27 — High body to range ratio (Abs(Close - Open) / (High - Low) > 0.5)
28 — Low body to range ratio (Abs(Close - Open) / (High - Low) < 0.5)
29 — High relative volatility (ATR(7) > ATR(40))
30 — Low relative volatility (ATR(7) < ATR(40))
31 — External condition 1
32 — External condition 2
33 — External condition 3
34 — External condition 4
35 — External condition 5
These constituent conditions fall into three distinct categories:
• Directional pairs : The numbers 1-22 correspond to pairs of opposing upward and downward conditions. For example, if one of the inputs includes "1" in the comma-separated list, that group uses the "RSI above/below threshold" condition pair. In this case, the RSI must be above a high threshold for the group to trigger an upward alert, and the RSI must be below a defined low threshold to trigger a downward alert.
• Non-directional filters : The numbers 23-30 correspond to conditions that do not represent directional information. These conditions act as filters for both upward and downward alerts. Traders often use non-directional conditions to refine trending or mean reversion signals. For instance, if one of the input lists includes "30", that group uses the "Low relative volatility" condition. The group can trigger an upward or downward alert only if the 7-period Average True Range (ATR) is below the 40-period ATR.
• External conditions : The numbers 31-35 correspond to external conditions based on the plots from other indicators on the chart. To set these conditions, use the source inputs in the "External conditions" section near the bottom of the "Settings/Inputs" tab. The external value can represent an upward, downward, or non-directional condition based on the following logic:
▫ Any value above 0 represents an upward condition.
▫ Any value below 0 represents a downward condition.
▫ If the checkbox next to the source input is selected, the condition becomes non-directional . Any group that uses the condition can trigger upward or downward alerts only if the source value is not 0.
To learn more about using plotted values from other indicators, see this article in our Help Center and the Source input section of our Pine Script™ User Manual.
Group markers
Each comma-separated list represents a distinct group , where all the listed conditions must occur to trigger an alert. This script assigns preset markers (names) to each condition group to make the active ensembles easily identifiable in the generated alert messages and labels. The markers assigned to each group use the format "M", where "M" is short for "Marker" and "x" is the group number. The titles of the inputs at the top of the "Settings/Inputs" tab show these markers for convenience.
For upward conditions, the labels and alert messages show group markers with upward triangles (e.g., "M1▲"). For downward conditions, they show markers with downward triangles (e.g., "M1▼").
NOTE: By default, this script populates the "M1" field with a pre-configured list for a mean reversion group ("2,18,24,28"). The other fields are empty. If any "M*" input does not contain a value, the indicator ignores it in the alert calculations.
Custom alert messages
By default, the indicator's alert message text contains the activated markers and their direction as a comma-separated list. Users can override this message for upward or downward alerts with the two text fields at the bottom of the "Settings/Inputs" tab. When the fields are not empty , the alerts use that text instead of the default marker list.
NOTE: This script generates alert triggers, not the alerts themselves. To set up an alert based on this script's conditions, open the "Create Alert" dialog box, then select the "Ensemble Alerts" and "Any alert() function call" options in the "Condition" tabs. See the Alerts FAQ in our Pine Script™ User Manual for more information.
Condition visualization
This script offers organized visualizations of its conditions, allowing users to inspect the behaviors of each condition alongside the specified groups. The key visual features include:
1) Conditional plots
• The indicator plots the history of each individual condition, excluding the external conditions, as circles at different levels. Opposite conditions appear at positive and negative levels with the same absolute value. The plots for each condition show values only on the bars where they occur.
• Each condition's plot is color-coded based on its type. Aqua and orange plots represent opposing directional conditions, and purple plots represent non-directional conditions. The titles of the plots also contain the condition numbers to which they apply.
• The plots in the separate pane can be turned on or off with the "Show plots in pane" checkbox near the top of the "Settings/Inputs" tab. This input only toggles the color-coded circles, which reduces the graphical load. If you deactivate these visuals, you can still inspect each condition from the script's status line and the Data Window.
• As a bonus, the indicator includes "Up alert" and "Down alert" plots in the Data Window, representing the combined upward and downward ensemble alert conditions. These plots are also usable in additional indicator-on-indicator calculations.
2) Dynamic labels
• The indicator draws a label on the main chart pane displaying the activated group markers (e.g., "M1▲") each time an alert condition occurs.
• The labels for upward alerts appear below chart bars. The labels for downward alerts appear above the bars.
NOTE: This indicator can display up to 500 labels because that is the maximum allowed for a single Pine script.
3) Background highlighting
• The indicator can highlight the main chart's background on bars where upward or downward condition groups activate. Use the "Highlight background" inputs in the "Settings/Inputs" tab to enable these highlights and customize their colors.
• Unlike the dynamic labels, these background highlights are available for all chart bars, irrespective of the number of condition occurrences.
█ NOTES
• This script uses Pine Script™ v6, the latest version of TradingView's programming language. See the Release notes and Migration guide to learn what's new in v6 and how to convert your scripts to this version.
• This script imports our new Alerts library, which features functions that provide high-level simplicity for working with complex compound conditions and alerts. We used the library's `compoundAlertMessage()` function in this indicator. It evaluates items from "bool" arrays in groups specified by an array of strings containing comma-separated index lists , returning a tuple of "string" values containing the marker of each activated group.
• The script imports the latest version of the ta library to calculate several technical indicators not included in the built-in `ta.*` namespace, including Double Exponential Moving Average (DEMA), Triple Exponential Moving Average (TEMA), Fractal Adaptive Moving Average (FRAMA), Tilson T3, Awesome Oscillator (AO), Full Stochastic (%K and %D), SuperTrend, and Donchian Channels.
• The script uses the `force_overlay` parameter in the label.new() and bgcolor() calls to display the drawings and background colors in the main chart pane.
• The plots and hlines use the available `display.*` constants to determine whether the visuals appear in the separate pane.
Look first. Then leap.

Half Cup [LuxAlgo]The Half Cup indicator detects and displays patterns with the shape of a Half Cup , initiating a channel. From this channel, breakouts are detected and highlighted with dots.
Users can control the shape of the Half Cup and the channel length through various settings.
Do note that the displayed half cups are displayed retrospectively, making them subject to backpainting.
🔶 USAGE
The idea behind the indicator is derived from the Cup & Handle pattern, which requires waiting for the pattern full completion.
Our Half Cup publication aims to find opportunities when the potential cup is only formed halfway.
In this example, a green dot shows the first breakout of the upper channel extremity. A few bars later, the price went under it, after which it returned above, triggering a second green dot. Both triggers were good opportunities in this case, and the price rose afterward.
The Half Cup pattern can be the start of a potential complete Cup & Handle (As in the example above, a complete Cup pattern (without the Handle ) is shown, manually drawn with dashed lines).
Every green/red dot, whether on a bullish or bearish pattern, points to a breakout respectively above/below the channel.
Besides drawing patterns and the corresponding breakouts, the Half Cup indicator can also provide insights into trends and potential opportunities in the long run.
🔶 DETAILS
🔹 Validation
Several criteria must be fulfilled before a visible pattern on the chart is drawn.
Calculations are done beforehand to know where the Half Cup pattern would be positioned.
The pattern's bottom and top edges are checked for the number of bars whose closing price is outside the half-cup area. When the number of breakouts above/below is equal to or lower than the user-defined settings ( Max % Breaks Top/Bottom ), the pattern is drawn together with a brighter-colored channel next to it.
Dots highlighting the channel's breakout can be drawn from that moment until the end of both channel lines.
🔹 Positioning
Users can adjust the following settings to fit their needs:
% Broadness: Moves the Top/Bottom line (bullish or bearish) diagonally upwards/downwards.
Vertical Shift: Shifts the entire pattern up/down.
Channel Length: Sets the line length of the channel.
Note that adjusting the position of the pattern will change the validation; the script will be rerun to check if patterns are still valid or if new patterns can be drawn. Some patterns may disappear, while new ones may appear.
Before adjusting the position, the user can set Max % Breaks Top/Bottom at 100%. When the positioning is set, Max % Breaks Top/Bottom can be set as desired.
🔹 Updated Drawings
The Half Cup pattern is always drawn retrospectively (that is it is subject to backpainting), the channel is drawn from the bar from where the pattern is detected. Every breakout of the channel will remain visible as dots.
When a new swing high/low is found while the previous swing low/high remains the same, the pattern is updated to minimize clutter. The dots of earlier drawings will remain visible (to ensure no repainting occurs), but the color becomes faded, as such bright dots are associated with patterns that are visible on the chart, while faded dots are from removed/updated patterns.
🔶 SETTINGS
Swing Length: Period used for the swing detection, with higher values returning longer-term Swing Levels.
🔹 Validation
Max % Breaks Bottom: Allowed maximum amount of bars where the closing price is below the bottom of the Half Cup pattern against the total width of the pattern (bars).
Max % Breaks Top: Allowed maximum amount of bars where the closing price is above the top of the Half Cup pattern against the total width of the pattern (bars).
🔹 Positioning
% Broadness: Moves the Top/Bottom line (bullish or bearish) diagonally upwards/downwards.
Vertical Shift: Shifts the entire pattern up/down.
Channel Length: Sets the line length of the channel.

Gaps Profile [vnhilton]Note: If you get an error preventing indicator from executing due to a loop running longer than >500ms, please lower the amount of boxes shown and/or increase the minimum gap % threshold.
OVERVIEW
The Gaps Profile (GP) simply shows the remaining gaps on the chart that have yet to be closed. Gaps are created where there's a distance between the current open and the previous close. Big gaps suggest change in sentiment and volatility causing prices to pull away thereby creating gaps. Gaps can be used as pivot areas where price may attempt to close the inefficiency entirely and/or serve as supply/demand zones.
(FEATURES)
- 3 to 499 remaining up/down gaps can be displayed on the chart (furthest gaps away from price are removed to make way for new gaps)
- Minimum gap % threshold
- Ability to highlight largest or newest up/down gap
- 4 GP color themes: Mono, Up/Down, Up/Down Largest Gradients, Up/Down Newest Gradients
- GP Type: Left, Right (how it is built - overlapping gaps plotted from left/right to right/left)
- GP offset from current bar
- Box border width
- Box border style for up/down: Dashed, Dotted, Solid
- Toggles to hide border/box with ease

RSI Trend Detector PSAR BasedRSI Trend Detector is based on the Direction of PSAR. This indicator helps the easy detection of Trend Direction and Sideways Movement of Price. It was difficult to determine the RSI Trend Direction in a basic RSI indicator. one cannot decide the exact entry point where to enter.
RSI Trend Detector helps with the direction of trend using PSAR direction which is almost instant direction changing indicator with Zero Lag. The color of the RSI changes immediately based on PSAR direction. One can determine the trend whether its in UP / Down or Sideways.
One can easily detect Pullback and entry points using this indicator.
The basic working can be interpreted with a normal default RSI, The only additional feature is the direction of trend using a SAR signal.
Oversold Zone is below 30
Overbought Zone is above 70
how ever RSI above 50 is treated a UP trend and Below 50 as Down Trend.
when RSI is between 40 and 60 price must be considered as Sideways. One can easily interpret the TREND.
Yellow Line = RSI Moving Average
RED and Green Line= RSI
Grey Zone = Sideways
Horizontal line = RSI level 50
Settings can be changed as required.
RSI Line:
RSI Above 50 up trend and Entry when color is green
RSI Below 50 down trend and Entry when color is Red
RSI in Grey Zone is sideways, wait for a breakout
RSI above 50 and color is red then its a pullback in uptrend
RSI below 50 and color is green then its a pullback in downtrend
ALERTS:
Up signal and Down Signal are provided when ever RSI crosses RSIMA
Up Signal: RSI crosses RSI Moving Average upwards
Down Signal: RSI crosses RSI Moving Average Downwards
Hope the Tradingview community likes this.

Stochastic Zone Strength Trend [wbburgin](This script was originally invite-only, but I'd vastly prefer contributing to the TradingView community more than anything else, so I am making it public :) I'd much rather share my ideas with you all.)
The Stochastic Zone Strength Trend indicator is a very powerful momentum and trend indicator that 1) identifies trend direction and strength, 2) determines pullbacks and reversals (including oversold and overbought conditions), 3) identifies divergences, and 4) can filter out ranges. I have some examples below on how to use it to its full effectiveness. It is composed of two components: Stochastic Zone Strength and Stochastic Trend Strength.
Stochastic Zone Strength
At its most basic level, the stochastic Zone Strength plots the momentum of the price action of the instrument, and identifies bearish and bullish changes with a high degree of accuracy. Think of the stochastic Zone Strength as a much more robust equivalent of the RSI. Momentum-change thresholds are demonstrated by the "20" and "80" levels on the indicator (see below image).
Stochastic Trend Strength
The stochastic Trend Strength component of the script uses resistance in each candlestick to calculate the trend strength of the instrument. I'll go more into detail about the settings after my description of how to use the indicator, but there are two forms of the stochastic Trend Strength:
Anchored at 50 (directional stochastic Trend Strength):
The directional stochastic Trend Strength can be used similarly to the MACD difference or other histogram-like indicators : a rising plot indicates an upward trend, while a falling plot indicates a downward trend.
Anchored at 0 (nondirectional stochastic Trend Strength):
The nondirectional stochastic Trend Strength can be used similarly to the ADX or other non-directional indicators : a rising plot indicates increasing trend strength, and look at the stochastic Zone Strength component and your instrument to determine if this indicates increasing bullish strength or increasing bearish strength (see photo below):
(In the above photo, a bearish divergence indicated that the high Trend Strength predicted a strong downwards move, which was confirmed shortly after. Later, a bullish move upward by the Zone Strength while the Trend Strength was elevated predicated a strong upwards move, which was also confirmed. Note the period where the Trend Strength never reached above 80, which indicated a ranging period (and thus unprofitable to enter or exit)).
How to Use the Indicator
The above image is a good example on how to use the indicator to determine divergences and possible pivot points (lines and circles, respectively). I recommend using both the stochastic Zone Strength and the stochastic Trend Strength at the same time, as it can give you a robust picture of where momentum is in relation to the price action and its trajectory. Every color is changeable in the settings.
Settings
The Amplitude of the indicator is essentially the high-low lookback for both components.
The Wavelength of the indicator is how stretched-out you want the indicator to be: how many amplitudes do you want the indicator to process in one given bar.
A useful analogy that I use (and that I derived the names from) is from traditional physics. In wave motion, the Amplitude is the up-down sensitivity of the wave, and the Wavelength is the side-side stretch of the wave.
The Smoothing Factor of the settings is simply how smoothed you want the stochastic to be. It's not that important in most circumstances.
Trend Anchor was covered above (see my description of Trend Strength). The "Trend Transform MA Length" is the EMA length of the Trend Strength that you use to transform it into the directional oscillator. Think of the EMA being transformed onto the 50 line and then the Trend Strength being dragged relative to that.
Trend Transform MA Length is the EMA length you want to use for transforming the nondirectional Trend Strength (anchored at 0) into the directional Trend Strength (anchored at 50). I suggest this be the same as the wavelength.
Trend Plot Type can transform the Nondirectional Trend Strength into a line plot so that it doesn't murk up the background.
Finally, the colors are changeable on the bottom.
Explanation of Zone Strength
If you're knowledgeable in Pine Script, I encourage you to look at the code to try to understand the concept, as it's a little complicated. The theory behind my Zone Strength concept is that the wicks in every bar can be used create an index of bullish and bearish resistance, as a wick signifies that the price crossed above a threshold before returning to its origin. This distance metric is unique because most indicators/formulas for calculating relative strength use a displacement metric (such as close - open) instead of measuring how far the price actually moved (up and down) within a candlestick. This is what the Zone Strength concept represents - the hesitation within the bar that is not typically represented in typical momentum indicators.
In the script's code I have step by step explanations of how the formula is calculated and why it is calculated as such. I encourage you to play around with the amplitude and wavelength inputs as they can make the zone strength look very different and perform differently depending on your interests.
Enjoy!
Walker

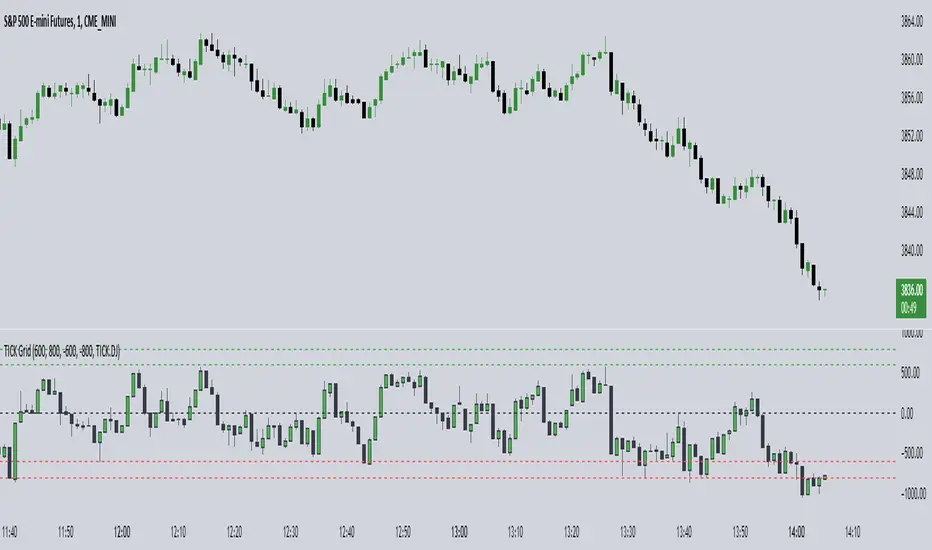
TICK Grid (TheMas7er)█ OVERVIEW
Shows the NYSE Tick Index, as it is used by TheMas7er .
This indicator has several customization options built-in that can be configured:
• Positive and negative threshold levels with show/hide option and color selection.
• Zero line with show/hide option and color selection.
• Bar colors are fully customizable.
• Symbol can be changed. Default is USI:TICK for the New York Stock Exchange.
Tick Indices are available in TradingView as a symbol - just like any other stock - which you can show on a chart.
This script adds a pane with your selected Tick Index, which can then be used as an indicator to make short-term trading decisions.
█ CONCEPTS
The Tick Index is a short-term barometer of internal market strength.
It shows the number of stocks trading on an uptick minus the number of stocks trading on a downtick, and is used by day traders to view the overall market sentiment at a given point in time.
It's categorized as a Breadth Indicator because it analyzes the "Breadth and Scope" of an entire Index.
Since the Tick Index measures the up/down ticks of a universe of stocks, any collection of stocks (market,index,...) could theoretically have it's own Tick Index.
Some of the major Tick Indices are:
• USI:TICK for the New York Stock Exchange
• USI:TICKQ for Nasdaq
• USI:TICKI for the Down Jones
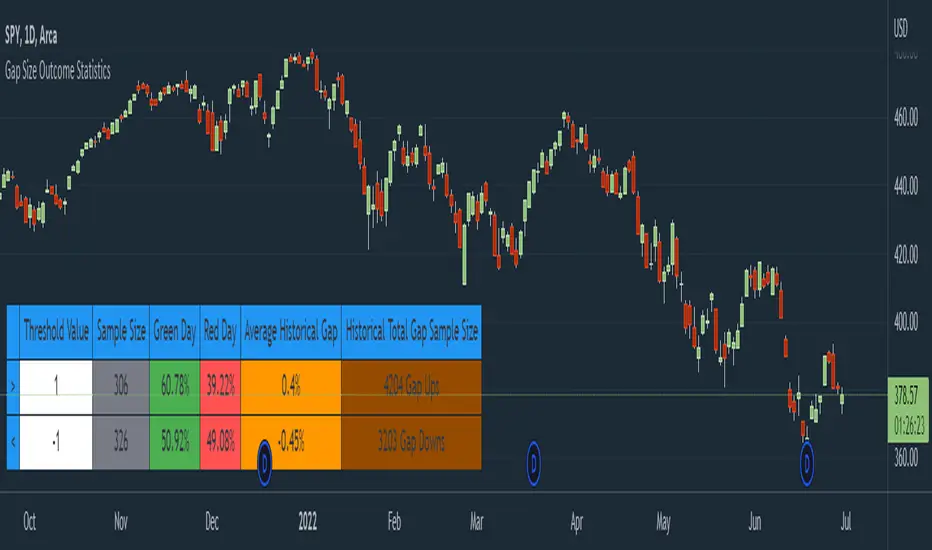
Gap Size Outcome Statistics [vnhilton]This indicator displays a table with statistics showing the outcomes of gap ups or downs based on your threshold (i.e. does the day end in green or red?). This can be useful for trading, where you're using relevant ETFs & see that they've gapped up/down, & can assume based on statistics that the ETF will end in green/red depending on which has the higher probability (however, you can use these on any other instruments such as stocks to find edges e.g. seeing whether stock XYZ is more likely to end in green/red when it gaps up 100%).
The table also includes sample sizes for your threshold tests for more confidence in the statistics, & also displays average gap up & downs & their respective sample sizes as well. This indicator is intended to be used on the daily timeframe, but can be used on lower or higher timeframes if you prefer.
In the chart snapshot image above, we can see that when the SPY gaps up > 1%, the day is more likely to end in green than in red. But when the SPY gaps down < -1%, it's also more likely to end in green than in red.
( IMPORTANT NOTE : There's 1 limitation with this indicator & it's that it assumes that days where close=open are green days, & that 0% gaps exact are considered gap ups.)
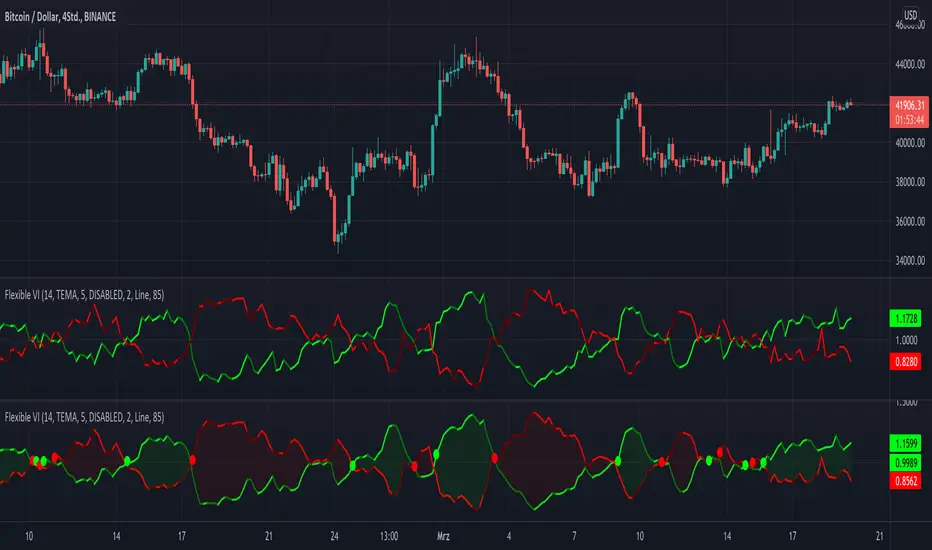
KINSKI Flexible Vortex IndicatorThe Vortex indicator is based on two trend lines that indicate an uptrend (VI+) or a downtrend (VI-) in the current market. This can be used to determine trend reversals or confirmations of current trends and directions. The number of periods is usually between 10 and 25. This indicator has 14 periods as its default value. You can adjust this value in the settings according to your needs.
A buy signal can be interpreted when VI+ is greater than VI-. Conversely, a sell signal exists when VI+ is smaller than VI-. Whenever a "crossing point" occurs, an imminent trend change can also be anticipated. If the differences from the highs and lows become larger and larger, a breakout is to be expected.
When using this indicator, please note that VI+ and VI crossings, especially during choppy price movements, can trigger false trading signals.
What distinguishes this Vortex indicator from others of this type?
Possibility to choose between different template templates that influence the display
Extensive setting options to emphasize upward and downward movements and cross points
The following settings are possible:
"Length": Adjustable period / default value = 14
"Template": "DISABLED", "Clear", "Informative" / Default value = DISABLED
"Line: Size": Thickness of the vortex lines / default value = 2
"Line: Style Type": Display variants (options: "Line", "Stepline") / default value = "Line".
"Line: Up/Down Movements": Up and down movements are highlighted in color / default value = AN
"Cross Points: On/Off": Cross points are displayed / default value = OFF
"Bands: On/Off": Vortex lines are connected as a band / default value = OFF
"Bands: Transparency": Strength of transparency / default value = 85
Color codes: The color codes are explained in the settings
BOSCILLATOR. A BOSS OSCILLATORI would like to first say I do not the indicator pieces. Would like to personally give thanks and credit to @MarkBench for coding this indicator and helping to get my vision for this system finally able to be published and used by anyone. I would also like the thank @lazy bear and @ChrisMoody for their bringing the Firefly oscillator and the SCHAFF TREND and the PPO price percentage oscillator to trading view. and @scilentor for his version of Godmode with LSMA . Thanks to @Shizaru for bringing Frama moving average (which we have adopted into the PPO as one of the base selections for the first time, as well as the ALMA ). Divergences have also been added. and components of the firefly have been removed such as the histogram. I have added two oscillators in the picture. The bottom is the standard settings. The above is how I prefer mine to look after tweaking the settings.
Before I get into explaining how its used. I want to say all the indicators are open and none privately owned or at least owned by indivduals who brought them to trading view. Any due permission is granted at my disclocsure. I also want to say this is not your typical mashup of indicators as the is a very clear way to view and use this specifically. Also I want to say original tools from their original scripts are also improved. For example the PPO being used we have added the FRAMA and ALMA moving average basis option which it did not have before. And now everything has clear divergences and some other minor changers. but here are the rules and examples.
THE BOSCILLATOR - A MULTI-LEVEL CONFLUENCE/CONFIRMATION FILTER VISUALIZATION
Some shorthand
(Main oscillator - firefly)
(background wave thing - PPO )
(the red vertical up and down line with red and green dots - STC )
(the blue, yellow and red dots - warning dots)
WHO IS THIS INDICATOR FOR? - This indicator itself is not meant to be a signal giver to buy or sell right now even though it could be and some of the original scripts are used as such. This indicator is actually meant to be a VISUAL CONFIRMATION & FILTER for trades taken in other methods outside of this indicator. What are some of those methods that may benefit from having this? Pivot point traders, FIB traders, Bollinger band traders, Moving average traders.. just to name a few. This indicator itself is meant to in a quick glance allow the trade to see the condition of many different elements outside of the main price and chart, and determine if that trade looks like it has too much risk, or if that trade looks suitable. It also provides a series of confirmations that could be used for adding to a position at different levels at the trade's discretion.
OPTIMAL CONDITIONS FOR CONSIDERING A SHORT = The PPO is orange/red + the STC is at the TOP + the Firefly is above the midline. The warning dots are being printed at the top. There is regular or hidden bearish divergence present.
OPTIMAL CONDITIONS FOR CONSIDERING A LONG = The PPO is light/dark green + the STC is at the BOTTOM + the Firefly is below the midline. The warning dots are being printed at the bottom. There is regular or hidden bullish divergence present.
Triggers for scaling/adding into your position = Keeping in mind that this oscillator on its own is not meant to be the sole reason for taking a trade, here are some triggers you will see for getting into position (preferably with the optimal conditions being met) The firefly flips from a green line into a red slide and vise versa. The firefly crosses the midline up or down. The STC begins going up/down and triggers a green or red dot while crossing one of the levels at 20 or 80. The warning dots being made begin to be printed lower/higher than the dot before last. The PPO shift from one color to the next in the favored direction of the trade you wish to make.
Signs for taking profit and protecting your trade = The Dots begin to print, the PPO changes colors at the top or bottom. the STC arrived are the top.
FILTER SITUATIONS TO AVOID TRADES = Wise to not take a trade if the PPO and the firefly do not agree. For example - if the PPO is showing green yet the firefly is still red may be an indication that it is getting a bit late for you to enter the trade. Same with opposing divergences and warning dots contradicting the trade you are looking at. The STC being already on the bottom or top may be a small indication that trade may already have been a little too ripe, but on its own is not always the case.
When selecting the PPO settings and moving average you are going to want it to be in favor of what you are trying to accomplish.IF you are one low time frames and trying to swing or scalp trade... chances are you want a reactive MA setting that iss responsive. Iwould recommend the HULL, ALMA, TEMA DEMA. For the Higher time frame the EMA or the T3 WDma can be wuite patient and helpful for a constant reminder of caution
Some notes - for the swing and scalp trading... in my experience the PPO moving average basis sees more responsive changes with the FRAMA , ALMA , HULL settings. for entering a trade, at least a couple of your triggers being present increases the success rate by a lot.
This chart illustrates the usefullness of having a Zero lag function for the firefly. The firefly should not be taken for signals or trades itself. However it is the most precise finder of divergences within the system. It is aways good to flip on and off zero lag just to take a quick look for divergences you might have mixed.
In this chart illustrates the general visual look and order of events to guide you along your way. Starts with the PPO turning green or red or orange which is potentially time to get out of your current trade. Then it switched colors when reversal begins and that is when you want to at the same time see the STC, the firefly, and lower caution dots coming in around the same area (highlighted in blue squares). Now near the end you see a red box. This is a filter aspect. The PPO is green, yet the others are saying down/short. This does not mean it must be a long, however it is great warning to maybe avoid getting to bearish for the downside in that time. You want the PPO and line up with the others and it should be visually apparent that they all want to go the same way.
Here is a list of some key elements (before changes this script made) of parts this oscillator includes. My original publication of my oscillation setup was blocked by the mods here.. this one however includes a large variety of items that have been altered from their original formats and a well-explained trading system to use it with.
// Firefly
Firefly Oscillator
// PPO
PPO PercentileRank Mkt Tops & Bottoms (@PuppyTherapy)
// Divergence
Divergence Indicator (any oscillator)
// Godmode
Godmode3.2+LSMA
// Schaff
Schaff Trend Cycle
// Frama
(FRAMA) Fractal Adaptive Moving Average

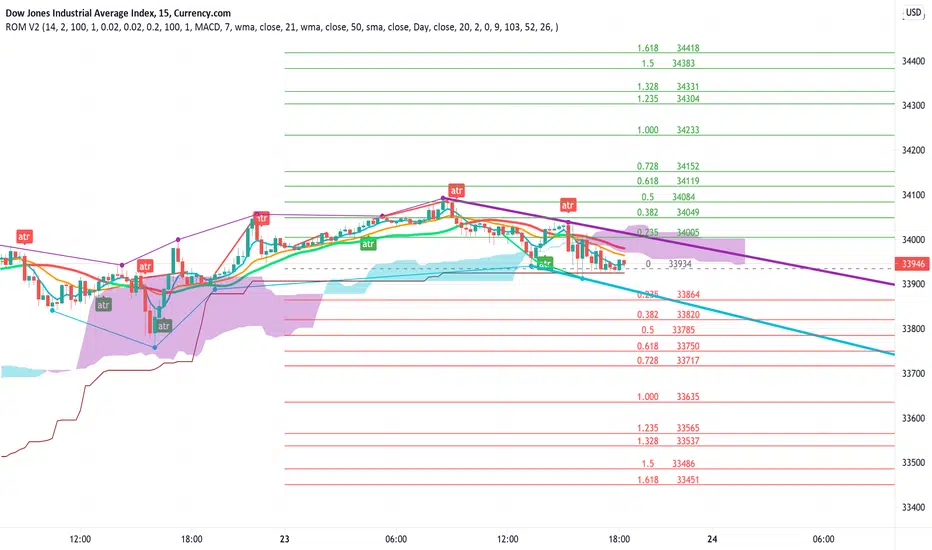
Volume-Supported Linear Regression TrendHello Traders,
Linear Regression gives us some abilities to calculate the trend and if we combine it with volume then we may get very good results. Because if there is no volume support at up/downtrends then the trend may have a reversal soon. we also need to check the trend in different periods. With all this info, I developed Volume-Supported Linear Regression Trend script. The script checks linear regression of price and volume and then calculates trend direction and strength.
You have option to set Source, Short-Term Period and Long-Term Period. you can set them as you wish.
By default:
Close is used as "Source"
Short-Term Period is 20
Long-Term Period is 50
in following screenshot I tried to explain short term trend (for uptrend). Volume supports the trend? any volume pressure on trend? possible reversal? same idea while there is downtrend.
in following screenshot I tried to explain long term trend:
You can also check Positive/Negative Divergences to figure out possible reversals (to automate it, you can use Divergence for Many Indicators v4 , it has ability to check divergences on external indicators)
Enjoy!

Rain On Me V2As promised, here is Rain On Me Indicator V2! As the name suggests, this indicator will rain money down on you. More seriously, Rain On Me V2 is a complete overhaul of the V1.
For those who are new to this indicator or for those who already knew it, here is a complete description of this indicator.
This indicator contains:
-Fully configurable multi-timeframe buy or sell signals based on ATR with the possibility to set the period, deviation, period of the ATR and choose the source or type of signals: RMA, SMA , EMA, WMA, VWMA, SMMA, KMA, TMA, HullMA, DEMA, TEMA, CTI.
-Colouring of candles on ATR. (green and red).
-Buy or sell signals with VPT (based on st_dev) with the possibility of adjusting the period and the multiplier. (Only works in markets with available volume information flows).
-Trend Parabolic SAR (Up / Down) fully configurable.
-Divergences with the possibility of choosing among the following signals: MACD, OBV, RSI, CCI.
-3 Moving averages with the possibility of choosing their values and their type for each one: SMA, EMA, RMA, WMA, VWMA. (default: WMA 1 = 7, WMA 2 = 21 and SMA 3 = 50).
-Fibonacci on 10 levels with level 0 in the middle. This Fibonacci helps a lot as it can make it easy for you to find an entry / exit point, a trend and even where to place your Take Profit and Stop Loss.
-Fully customizable Bollinger Band.
-Fully customizable Ichimoku cloud.
-Multi-timeframe Trendline that tells you the true trend of the current market based on volume. (Only works in markets with available volume information flows). It can change from green (for an uptrend) or red (downtrend) color.
To place an alert, always choose the "Once per bar" option.
You can place alerts on the following options:
-GO Buy / GO Sell (ATR).
-VPT Buy / Sell.
-PSAR (Up / Down).
-Divergences (Bullish / Bearish).
-Crossing of moving averages 1 and 2.
-Fibonacci key levels (0.382, 0.5 and 0.618) for Crossunder and Crossover in an uptrend or downtrend.
You can choose to show or hide from the chart all the options mentioned above.
Never follow buy or sell signals stupidly. Always watch that all the indicators are going in the same direction, that you are not in a range zone, that there is no resistance etc ...
Always wait for confirmation after a buy or sell alert before entering a position to make sure the label stays on the chart and doesn't disappear.
Please feel free to give your ideas, suggestions or bug reports in the comments area to help me improve it.
A BIG THANKS TO QUANTNOMAD FOR GIVING ME ITS AUTHORIZATION TO USE, MODIFY AND REPUBLIC ITS "Ultimate Pivot Points Alerts" script indicator:
Good trade everyone! And remember, money management is the most important!
Delta Volume Columns Pro [LucF]█ OVERVIEW
This indicator displays volume delta information calculated with intrabar inspection on historical bars, and feed updates when running in realtime. It is designed to run in a pane and can display either stacked buy/sell volume columns or a signal line which can be calculated and displayed in many different ways.
Five different models are offered to reveal different characteristics of the calculated volume delta information. Many options are offered to visualize the calculations, giving you much leeway in morphing the indicator's visuals to suit your needs. If you value delta volume information, I hope you will find the time required to master Delta Volume Columns Pro well worth the investment. I am confident that if you combine a proper understanding of the indicator's information with an intimate knowledge of the volume idiosyncrasies on the markets you trade, you can extract useful market intelligence using this tool.
█ WARNINGS
1. The indicator only works on markets where volume information is available,
Please validate that your symbol's feed carries volume information before asking me why the indicator doesn't plot values.
2. When you refresh your chart or re-execute the script on the chart, the indicator will repaint because elapsed realtime bars will then recalculate as historical bars.
3. Because the indicator uses different modes of calculation on historical and realtime bars, it's critical that you understand the differences between them. Details are provided further down.
4. Calculations using intrabar inspection on historical bars can only be done from some chart timeframes. See further down for a list of supported timeframes.
If the chart's timeframe is not supported, no historical volume delta will display.
█ CONCEPTS
Chart bars
Three different types of bars are used in charts:
1. Historical bars are bars that have already closed when the script executes on them.
2. The realtime bar is the current, incomplete bar where a script is running on an open market. There is only one active realtime bar on your chart at any given time.
The realtime bar is where alerts trigger.
3. Elapsed realtime bars are bars that were calculated when they were realtime bars but have since closed.
When a script re-executes on a chart because the browser tab is refreshed or some of its inputs are changed, elapsed realtime bars are recalculated as historical bars.
Why does this indicator use two modes of calculation?
Historical bars on TradingView charts contain OHLCV data only, which is insufficient to calculate volume delta on them with any level of precision. To mine more detailed information from those bars we look at intrabars , i.e., bars from a smaller timeframe (we call it the intrabar timeframe ) that are contained in one chart bar. If your chart Is running at 1D on a 24x7 market for example, most 1D chart bars will contain 24 underlying 1H bars in their dilation. On historical bars, this indicator looks at those intrabars to amass volume delta information. If the intrabar is up, its volume goes in the Buy bin, and inversely for the Sell bin. When price does not move on an intrabar, the polarity of the last known movement is used to determine in which bin its volume goes.
In realtime, we have access to price and volume change for each update of the chart. Because a 1D chart bar can be updated tens of thousands of times during the day, volume delta calculations on those updates is much more precise. This precision, however, comes at a price:
— The script must be running on the chart for it to keep calculating in realtime.
— If you refresh your chart you will lose all accumulated realtime calculations on elapsed realtime bars, and the realtime bar.
Elapsed realtime bars will recalculate as historical bars, i.e., using intrabar inspection, and the realtime bar's calculations will reset.
When the script recalculates elapsed realtime bars as historical bars, the values on those bars will change, which means the script repaints in those conditions.
— When the indicator first calculates on a chart containing an incomplete realtime bar, it will count ALL the existing volume on the bar as Buy or Sell volume,
depending on the polarity of the bar at that point. This will skew calculations for that first bar. Scripts have no access to the history of a realtime bar's previous updates,
and intrabar inspection cannot be used on realtime bars, so this is the only to go about this.
— Even if alerts only trigger upon confirmation of their conditions after the realtime bar closes, they are repainting alerts
because they would perhaps not have calculated the same way using intrabar inspection.
— On markets like stocks that often have different EOD and intraday feeds and volume information,
the volume's scale may not be the same for the realtime bar if your chart is at 1D, for example,
and the indicator is using an intraday timeframe to calculate on historical bars.
— Any chart timeframe can be used in realtime mode, but plots that include moving averages in their calculations may require many elapsed realtime bars before they can calculate.
You might prefer drastically reducing the periods of the moving averages, or using the volume columns mode, which displays instant values, instead of the line.
Volume Delta Balances
This indicator uses a variety of methods to evaluate five volume delta balances and derive other values from those balances. The five balances are:
1 — On Bar Balance : This is the only balance using instant values; it is simply the subtraction of the Sell volume from the Buy volume on the bar.
2 — Average Balance : Calculates a distinct EMA for both the Buy and Sell volumes, and subtracts the Sell EMA from the Buy EMA.
3 — Momentum Balance : Starts by calculating, separately for both Buy and Sell volumes, the difference between the same EMAs used in "Average Balance" and
an SMA of double the period used for the "Average Balance" EMAs. The difference for the Sell side is subtracted from the difference for the Buy side,
and an RSI of that value is calculated and brought over the −50/+50 scale.
4 — Relative Balance : The reference values used in the calculation are the Buy and Sell EMAs used in the "Average Balance".
From those, we calculate two intermediate values using how much the instant Buy and Sell volumes on the bar exceed their respective EMA — but with a twist.
If the bar's Buy volume does not exceed the EMA of Buy volume, a zero value is used. The same goes for the Sell volume with the EMA of Sell volume.
Once we have our two intermediate values for the Buy and Sell volumes exceeding their respective MA, we subtract them. The final "Relative Balance" value is an ALMA of that subtraction.
The rationale behind using zero values when the bar's Buy/Sell volume does not exceed its EMA is to only take into account the more significant volume.
If both instant volume values exceed their MA, then the difference between the two is the signal's value.
The signal is called "relative" because the intermediate values are the difference between the instant Buy/Sell volumes and their respective MA.
This balance flatlines when the bar's Buy/Sell volumes do not exceed their EMAs, which makes it useful to spot areas where trader interest dwindles, such as consolidations.
The smaller the period of the final value's ALMA, the more easily you will see the balance flatline. These flat zones should be considered no-trade zones.
5 — Percent Balance : This balance is the ALMA of the ratio of the "On Bar Balance" value, i.e., the volume delta balance on the bar (which can be positive or negative),
over the total volume for that bar.
From the balances and marker conditions, two more values are calculated:
1 — Marker Bias : It sums the up/down (+1/‒1) occurrences of the markers 1 to 4 over a period you define, so it ranges from −4 to +4, times the period.
Its calculation will depend on the modes used to calculate markers 3 and 4.
2 — Combined Balances : This is the sum of the bull/bear (+1/−1) states of each of the five balances, so it ranges from −5 to +5.
█ FEATURES
The indicator has two main modes of operation: Columns and Line .
Columns
• In Columns mode you can display stacked Buy/Sell volume columns.
• The buy section always appears above the centerline, the sell section below.
• The top and bottom sections can be colored independently using eight different methods.
• The EMAs of the Buy/Sell values can be displayed (these are the same EMAs used to calculate the "Average Balance").
Line
• Displays one of seven signals: the five balances or one of two complementary values, i.e., the "Marker Bias" or the "Combined Balances".
• You can color the line and its fill using independent calculation modes to pack more information in the display.
You can thus appraise the state of 3 different values using the line itself, its color and the color of its fill.
• A "Divergence Levels" feature will use the line to automatically draw expanding levels on divergence events.
Default settings
Using the indicator's default settings, this is the information displayed:
• The line is calculated on the "Average Balance".
• The line's color is determined by the bull/bear state of the "Percent Balance".
• The line's fill gradient is determined by the advances/declines of the "Momentum Balance".
• The orange divergence dots are calculated using discrepancies between the polarity of the "On Bar Balance" and the chart's bar.
• The divergence levels are determined using the line's level when a divergence occurs.
• The background's fill gradient is calculated on advances/declines of the "Marker Bias".
• The chart bars are colored using advances/declines of the "Relative Balance". Divergences are shown in orange.
• The intrabar timeframe is automatically determined from the chart's timeframe so that a minimum of 50 intrabars are used to calculate volume delta on historical bars.
Alerts
The configuration of the marker conditions explained further is what determines the conditions that will trigger alerts created from this script. Note that simply selecting the display of markers does not create alerts. To create an alert on this script, you must use ALT-A from the chart. You can create multiple alerts triggering on different conditions from this same script; simply configure the markers so they define the trigger conditions for each alert before creating the alert. The configuration of the script's inputs is saved with the alert, so from then on you can change them without affecting the alert. Alert messages will mention the marker(s) that triggered the specific alert event. Keep in mind, when creating alerts on small chart timeframes, that discrepancies between alert triggers and markers displayed on your chart are to be expected. This is because the alert and your chart are running two distinct instances of the indicator on different servers and different feeds. Also keep in mind that while alerts only trigger on confirmed conditions, they are calculated using realtime calculation mode, which entails that if you refresh your chart and elapsed realtime bars recalculate as historical bars using intrabar inspection, markers will not appear in the same places they appeared in realtime. So it's important to understand that even though the alert conditions are confirmed when they trigger, these alerts will repaint.
Let's go through the sections of the script's inputs.
Columns
The size of the Buy/Sell columns always represents their respective importance on the bar, but the coloring mode for tops and bottoms is independent. The default setup uses a standard coloring mode where the Buy/Sell columns are always in the bull/bear color with a higher intensity for the winning side. Seven other coloring modes allow you to pack more information in the columns. When choosing to color the top columns using a bull/bear gradient on "Average Balance", for example, you will have bull/bear colored tops. In order for the color of the bottom columns to continue to show the instant bar balance, you can then choose the "On Bar Balance — Dual Solid Colors" coloring mode to make those bars the color of the winning side for that bar. You can display the averages of the Buy and Sell columns. If you do, its coloring is controlled through the "Line" and "Line fill" sections below.
Line and Line fill
You can select the calculation mode and the thickness of the line, and independent calculations to determine the line's color and fill.
Zero Line
The zero line can display dots when all five balances are bull/bear.
Divergences
You first select the detection mode. Divergences occur whenever the up/down direction of the signal does not match the up/down polarity of the bar. Divergences are used in three components of the indicator's visuals: the orange dot, colored chart bars, and to calculate the divergence levels on the line. The divergence levels are dynamic levels that automatically build from the line's values on divergence events. On consecutive divergences, the levels will expand, creating a channel. This implementation of the divergence levels corresponds to my view that divergences indicate anomalies, hesitations, points of uncertainty if you will. It precludes any attempt to identify a directional bias to divergences. Accordingly, the levels merely take note of divergence events and mark those points in time with levels. Traders then have a reference point from which they can evaluate further movement. The bull/bear/neutral colors used to plot the levels are also congruent with this view in that they are determined by the line's position relative to the levels, which is how I think divergences can be put to the most effective use. One of the coloring modes for the line's fill uses advances/declines in the line after divergence events.
Background
The background can show a bull/bear gradient on six different calculations. As with other gradients, you can adjust its brightness to make its importance proportional to how you use it in your analysis.
Chart bars
Chart bars can be colored using seven different methods. You have the option of emptying the body of bars where volume does not increase, as does my TLD indicator, and you can choose whether you want to show divergences.
Intrabar Timeframe
This is the intrabar timeframe that will be used to calculate volume delta using intrabar inspection on historical bars. You can choose between four modes. The three "Auto-steps" modes calculate, from the chart's timeframe, the intrabar timeframe where the said number of intrabars will make up the dilation of chart bars. Adjustments are made for non-24x7 markets. "Fixed" mode allows you to select the intrabar timeframe you want. Checking the "Show TF" box will display in the lower-right corner the intrabar timeframe used at any given moment. The proper selection of the intrabar timeframe is important. It must achieve maximal granularity to produce precise results while not unduly slowing down calculations, or worse, causing runtime errors. Note that historical depth will vary with the intrabar timeframe. The smaller the timeframe, the shallower historical plots you will be.
Markers
Markers appear when the required condition has been confirmed on a closed bar. The configuration of the markers when you create an alert is what determines when the alert will trigger. Five markers are available:
• Balances Agreement : All five balances are either bullish or bearish.
• Double Bumps : A double bump is two consecutive up/down bars with +/‒ volume delta, and rising Buy/Sell volume above its average.
• Divergence confirmations : A divergence is confirmed up/down when the chosen balance is up/down on the previous bar when that bar was down/up, and this bar is up/down.
• Balance Shifts : These are bull/bear transitions of the selected signal.
• Marker Bias Shifts : Marker bias shifts occur when it crosses into bull/bear territory.
Periods
Allows control over the periods of the different moving averages used to calculate the balances.
Volume Discrepancies
Stock exchanges do not report the same volume for intraday and daily (or higher) resolutions. Other variations in how volume information is reported can also occur in other markets, namely Forex, where volume irregularities can even occur between different intraday timeframes. This will cause discrepancies between the total volume on the bar at the chart's timeframe, and the total volume calculated by adding the volume of the intrabars in that bar's dilation. This does not necessarily invalidate the volume delta information calculated from intrabars, but it tells us that we are using partial volume data. A mechanism to detect chart vs intrabar timeframe volume discrepancies is provided. It allows you to define a threshold percentage above which the background will indicate a difference has been detected.
Other Settings
You can control here the display of the gray dot reminder on realtime bars, and the display of error messages if you are using a chart timeframe that is not greater than the fixed intrabar timeframe, when you use that mode. Disabling the message can be useful if you only use realtime mode at chart timeframes that do not support intrabar inspection.
█ RAMBLINGS
On Volume Delta
Volume is arguably the best complement to interpret price action, and I consider volume delta to be the most effective way of processing volume information. In periods of low-volatility price consolidations, volume will typically also be lower than normal, but slight imbalances in the trend of the buy/sell volume balance can sometimes help put early odds on the direction of the break from consolidation. Additionally, the progression of the volume imbalance can help determine the proximity of the breakout. I also find volume delta and the number of divergences very useful to evaluate the strength of trends. In trends, I am looking for "slow and steady", i.e., relatively low volatility and pauses where price action doesn't look like world affairs are being reassessed. In my personal mythology, this type of trend is often more resilient than high-volatility breakouts, especially when volume balance confirms the general agreement of traders signaled by the low-volatility usually accompanying this type of trend. The volume action on pauses will often help me decide between aggressively taking profits, tightening a stop or going for a longer-term movement. As for reversals, they generally occur in high-volatility areas where entering trades is more expensive and riskier. While the identification of counter-trend reversals fascinates many traders to no end, they represent poor opportunities in my view. Volume imbalances often precede reversals, but I prefer to use volume delta information to identify the areas following reversals where I can confirm them and make relatively low-cost entries with better odds.
On "Buy/Sell" Volume
Buying or selling volume are misnomers, as every unit of volume transacted is both bought and sold by two different traders. While this does not keep me from using the terms, there is no such thing as “buy only” or “sell only” volume. Trader lingo is riddled with peculiarities.
Divergences
The divergence detection method used here relies on a difference between the direction of a signal and the polarity (up/down) of a chart bar. When using the default "On Bar Balance" to detect divergences, however, only the bar's volume delta is used. You may wonder how there can be divergences between buying/selling volume information and price movement on one bar. This will sometimes be due to the calculation's shortcomings, but divergences may also occur in instances where because of order book structure, it takes less volume to increase the price of an asset than it takes to decrease it. As usual, divergences are points of interest because they reveal imbalances, which may or may not become turning points. To your pattern-hungry brain, the divergences displayed by this indicator will — as they do on other indicators — appear to often indicate turnarounds. My opinion is that reality is generally quite sobering and I have no reliable information that would tend to prove otherwise. Exercise caution when using them. Consequently, I do not share the overwhelming enthusiasm of traders in identifying bullish/bearish divergences. For me, the best course of action when a divergence occurs is to wait and see what happens from there. That is the rationale underlying how my divergence levels work; they take note of a signal's level when a divergence occurs, and it's the signal's behavior from that point on that determines if the post-divergence action is bullish/bearish.
Superfluity
In "The Bed of Procrustes", Nassim Nicholas Taleb writes: To bankrupt a fool, give him information . This indicator can display lots of information. While learning to use a new indicator inevitably requires an adaptation period where we put it through its paces and try out all its options, once you have become used to it and decide to adopt it, rigorously eliminate the components you don't use and configure the remaining ones so their visual prominence reflects their relative importance in your analysis. I tried to provide flexible options for traders to control this indicator's visuals for that exact reason — not for window dressing.
█ LIMITATIONS
• This script uses a special characteristic of the `security()` function allowing the inspection of intrabars — which is not officially supported by TradingView.
It has the advantage of permitting a more robust calculation of volume delta than other methods on historical bars, but also has its limits.
• Intrabar inspection only works on some chart timeframes: 3, 5, 10, 15 and 30 minutes, 1, 2, 3, 4, 6, and 12 hours, 1 day, 1 week and 1 month.
The script’s code can be modified to run on other resolutions.
• When the difference between the chart’s timeframe and the intrabar timeframe is too great, runtime errors will occur. The Auto-Steps selection mechanisms should avoid this.
• All volume is not created equally. Its source, components, quality and reliability will vary considerably with sectors and instruments.
The higher the quality, the more reliably volume delta information can be used to guide your decisions.
You should make it your responsibility to understand the volume information provided in the data feeds you use. It will help you make the most of volume delta.
█ NOTES
For traders
• The Data Window shows key values for the indicator.
• While this indicator displays some of the same information calculated in my Delta Volume Columns ,
I have elected to make it a separate publication so that traders continue to have a simpler alternative available to them. Both code bases will continue to evolve separately.
• All gradients used in this indicator determine their brightness intensities using advances/declines in the signal—not their relative position in a pre-determined scale.
• Volume delta being relative, by nature, it is particularly well-suited to Forex markets, as it filters out quite elegantly the cyclical volume data characterizing the sector.
If you are interested in volume delta, consider having a look at my other "Delta Volume" indicators:
• Delta Volume Realtime Action displays realtime volume delta and tick information on the chart.
• Delta Volume Candles builds volume delta candles on the chart.
• Delta Volume Columns is a simpler version of this indicator.
For coders
• I use the `f_c_gradientRelativePro()` from the PineCoders Color Gradient Framework to build my gradients.
This function has the advantage of allowing begin/end colors for both the bull and bear colors. It also allows us to define the number of steps allowed for each gradient.
I use this to modulate the gradients so they perform optimally on the combination of the signal used to calculate advances/declines,
but also the nature of the visual component the gradient applies to. I use fewer steps for choppy signals and when the gradient is used on discrete visual components
such as volume columns or chart bars.
• I use the PineCoders Coding Conventions for Pine to write my scripts.
• I used functions modified from the PineCoders MTF Selection Framework for the selection of timeframes.
█ THANKS TO:
— The devs from TradingView's Pine and other teams, and the PineCoders who collaborate with them. They are doing amazing work,
and much of what this indicator does could not be done without their recent improvements to Pine.
— A guy called Kuan who commented on a Backtest Rookies presentation of their Volume Profile indicator using a `for` loop.
This indicator started from the intrabar inspection technique illustrated in Kuan's snippet.
— theheirophant , my partner in the exploration of the sometimes weird abysses of `security()`’s behavior at intrabar timeframes.
— midtownsk8rguy , my brilliant companion in mining the depths of Pine graphics.

NYSE Volume UP FLOW VS Down FLOW ULTIMATE VOLDNYSE Volume UP FLOW VS Down FLOW ULTIMATE StokedStocks
BASED OFF THE VOLD INDEX
The VOLD (also $VOLD) is the difference between the up volume and down volume on the NYSE. i.e. NYSE $UVOL minus $DVOL; the net up volume.
If you consider that VOLD is the net value between UVOL (up volume) and DVOL (down volume) then you need to understand these two to understand VOLD.
UVOL or DVOL are a total of the volume on all stocks that are up or down in price. Up or down is based on the previous session's closing price. The size of the stock's price change is irrelevant.
If the stock is up only $.01, then its volume is grouped into the UVOL total. If that stock's price then drops by $.02 it will be down $.01 and the day's volume for that stock will now be grouped with the DVOL total.
Note that when a stock moves from being an up stock to a down stock its volume will be removed from the UVOL total and added to the DVOL total. Say the stocks volume is 1 million shares when it moves from up to down. The DVOL will increase by 1 million and the UVOL will decrease by 1 million which means that VOLD will decrease by 2 million.
NYSE Up/Down Volume Ratio is often used as a barometer for stocks trading on all U.S. Exchanges even though it is calculated based on stocks listed on the New York Stock Exchange.
NYSE Up/Down ratio represents the volume of NYSE stocks that are advancing divided by the volume of declining stocks.
The volume of advancing stocks or upside volume is the sum of the volume or the number of shares traded associated with stocks that closed higher.
The downside volume is the total number of shares traded that are associated with stocks that closed lower.
The interpretation of the NYSE Up/Down ratio is rather simple. A value higher than one indicates that there is more volume associated with up stocks than with down stocks and it is usually interpreted as a bullish signal.
Obviously, a bearish signal occurs when the NYSE Up/Down ratio is lower than one, which tells us that there are more volume associated with down stocks than with up stocks.
Check out my other indicators and website stokedstocks.wordpress.com for tons of free stock training books and pictures and settings

Market Internals [Makit0] MARKET INTERNALS INDICATOR v0.5beta
Market Internals are suitable for day trade equity indices, named SPY or /ES, please do your own research about what they are and how to use them
This scripts plots the NYSE market internals charts as an indicator for an easy and full visualization of market internal structure all in one chart, useful for SPY and /ES trading
Description of the Market Internals
- TICK: NYSE stocks ticking up vs stocks ticking down, extreme values may point to trend continuation on trending days or reversal in non trending days, example of extreme values can be 800 and 1000
- ADD: NYSE stocks going up vs stocks going down, if price auctions around the zero line may be a non trend day, otherwise may be a trend day
- VOLD: NYSE volume of stocks up vs volume of stocks going down, identify clearly where the volume is going, as example if volume is flowing down may be a good idea no to place longs
- TRIN: NYSE up stocks vs down stocks ratio divided by up volume vs down volume ratio. A value of 1 indicates parity, below that the strength is on the long side, above the strength is in the short side.
A basic use of market internals may be looking for divergences, for example:
- /ES is trading in a range but ADD and VOLD are trending up nonstop, may /ES will break the range to the upside
- /ES is trading in a range and ADD and VOLD are trading around the zero line but got an extreme reading on TICK, may be a non trending day and the TICK extreme reading is at one of the extremes of the /ES range, may be a good probability trade to fade that move
- /ES is trading in a trend to the downside, ADD and VOLD too, you catch a good portion of the move but are fearful to flat and miss more gains, you see in the TICK a lot of extreme values below -800 so your're confident in the continuation of the downtrend, until the TICK goes beyond -1000 and you use that signal to go flat
Market internals give you context and confirmation, price in /ES may be trending but if market internals do not confirm the move may a reversal is on its way
Price is an advertise, you can see the real move in the structure below, in the behavior of the individual components of the market, those are the real questions:
- How many stocks are going up/down (ADD)
- How many volume is flowing up/down (VOLD)
- How many stocks are ticking up/down (TICK)
- What is the overall volume breath of the market (TRIN)
FEATURES:
- Plot one of the four basic market internal indices: TICK, ADD, VOLD and TRIN
- Show labels with values beyond an user defined threshold
- Show ZERO line
- Show user defined Dotted and Dashed lines
- Show user defined moving average
SETTINGS:
- Market internal: ticker to plot in the indicator, four options to choose from (TICK, ADD, VOLD and TRIN)
- Labels threshold: all values beyond this will be ploted as labels
- Dot lines at: two dotted lines will be plotted at this value above and below the zero line
- Dash lines at: two dashed lines will be plotted at this value above and below the zero line
- MA type: two options avaiable SMA (Simple Moving Average) or EMA (Exponential Moving Average)
- MA length: number of bars to calculate the moving average
- Show zero line: show or hide zero line
- Show dot line: show or hide dotted lines
- Show dash line: show or hide dashed lines
- Show labels: show or hide labels
GOOD LUCK AND HAPPY TRADING

How to automate this strategy for free using a chrome extension.Hey everyone,
Recently we developed a chrome extension for automating TradingView strategies using the alerts they provide. Initially we were charging a monthly fee for the extension, but we have now decided to make it FREE for everyone. So to display the power of automating strategies via TradingView, we figured we would also provide a profitable strategy along with the custom alert script and commands for the alerts so you can easily cut and paste to begin trading for profit while you sleep.
Step 1:
You are going to need to download the Chrome Extension called AutoView. You can get the extension for free by following this link: bit.ly ( I had to shorten the link as it contains Google and TV automatically converts it to a symbol)
Step 2: Go to your chrome extension page, and under the new extension you'll see a "settings" button. In the setting you will have to connect and give permission to the exchange 1broker allowing the extension to place your orders automatically when triggered by an alert.
Step 3: Setup the strategy and custom script for the alerts in TradingView. The attached script is the strategy, you can play with the settings yourself to try and get better numbers/performance if you please.
This following script is for the custom alerts:
//@version=2
study("4All-Alert", shorttitle="Alerts")
src = close
len = input(4, minval=1, title="Length")
up = rma(max(change(src), 0), len)
down = rma(-min(change(src), 0), len)
rsi = down == 0 ? 100 : up == 0 ? 0 : 100 - (100 / (1 + up / down))
rsin = input(5)
sn = 100 - rsin
ln = 0 + rsin
short = crossover(rsi, sn) ? 1 : 0
long = crossunder(rsi, ln) ? 1 : 0
plot(long, "Long", color=green)
plot(short, "Short", color=red)
Now that you have the extension installed, the custom strategy and alert scripts in place, you simply need to create the alerts.
To get the alerts to communicate with the extension properly, there is a specific syntax that you will need to put in the message of the alert. You can find more details about the syntax here : gist.github.com
For this specific strategy, I use the Alerts script, long/short greater than 0.9 on close.
In the message for a long place this as your message:
Long
c=order b=short
c=position b=short l=200 t=market
b=long q=0.01 l=200 t=market tp=13 sl=25
and for the short...
Short
c=order b=long
c=position b=long l=200 t=market
b=short q=0.01 l=200 t=market tp=13 sl=25
If you'll notice in my above messages, compared to the strategy my tp and sl (take profit and stop loss) vary by a few pips. This is to cover the market opens and spread on 1broker. You can change the tp and sl in the strategy to the above and see that the overall profit will not vary much at all.
I hope this all makes sense and it is enough to not only make some people money, but to show the power of coming up with your own strategy and automating it using TradingView alerts and the free Chrome Extension AutoView.
ps. I highly recommend upgrading your TradingView account so you have access to back testing and multiple alerts.
There is really no reason you won't cover the cost and then some on a monthly basis using the tools provided.
Best of luck and happy trading.
Note: The extension currently allows for automation on 2 exchanges; 1broker and Okcoin. If you do not have accounts there, we'd appreciate you signing up using our referral links.
www.okcoin.com
1broker.com

ORB + Expected Move + Trade Bias RWCORB + Expected Move + Trade Bias v3
Overview
A comprehensive 0DTE SPX options trading indicator designed to identify optimal credit spread and iron condor setups based on Opening Range Breakout (ORB) analysis, Expected Move calculations, VWAP dynamics, and multi-factor confidence scoring. The indicator provides specific strike suggestions, real-time position management signals, and exit warnings.
Who This Is For
This indicator is built for traders who sell 0DTE SPX credit spreads (put spreads, call spreads, or iron condors) and want a systematic, data-driven approach to:
Determine trade direction (bullish, bearish, or neutral)
Select appropriate strikes based on market conditions
Manage positions with clear exit signals
Core Components
1. Opening Range Breakout (ORB)
The ORB establishes the initial trading range after market open, serving as the foundation for trade bias determination.
Settings:
ORB Period: Choose 15, 30, 45, or 60 minutes
Shorter periods (15-30 min) = more signals, more noise
Longer periods (45-60 min) = fewer signals, more reliable ranges
ORB Breakout Buffer %: Percentage buffer beyond ORB high/low before confirming breakout (default 0.1%)
Colors: Customize ORB high (green), low (red), and fill colors
How It Works:
Tracks the high and low during the ORB period
After ORB completes, monitors for breakouts above/below with buffer
Counts consecutive bars above/below ORB for confirmation
2. Expected Move (EM)
Calculates the statistically expected daily range based on Average True Range (ATR).
Settings:
ATR Length: Lookback period for ATR calculation (default 14)
ATR Multiplier: Scale the expected move (default 1.0)
Colors: Customize expected move lines and fill
How It Works:
Pulls daily ATR from the previous session
Projects expected move boundaries from session open
Used for strike distance calculations and range containment analysis
3. VWAP Analysis
Volume Weighted Average Price with standard deviation bands provides trend confirmation and stretch detection.
Settings:
Show VWAP: Toggle VWAP line visibility
Show VWAP StdDev Bands: Toggle ±1 standard deviation bands
VWAP Band Multiplier: Adjust band width (default 1.0)
VWAP Slope Lookback: Bars to measure VWAP slope (default 10)
Key Metrics:
VWAP Slope: Normalized slope indicating trend strength
Strong Up (↑↑): > 0.5
Up (↑): 0.3 to 0.5
Flat (—): -0.3 to 0.3
Down (↓): -0.5 to -0.3
Strong Down (↓↓): < -0.5
Stretched Detection: Warns when price is >1.5 standard deviations from VWAP
4. Prior Day Levels (PDH/PDL)
Yesterday's high and low serve as key support/resistance levels where institutional orders often cluster.
Settings:
Show Prior Day High/Low: Toggle PDH/PDL lines
Show Prior Day Close: Optional PDC line
Colors: Customize PDH (teal), PDL (orange), PDC (gray)
Why It Matters:
Price above PDH = strong bullish continuation signal
Price below PDL = strong bearish continuation signal
Price between PDH/PDL = range-bound, favors iron condors
Strikes are adjusted to respect these levels as potential support/resistance
Trade Signal System
Signal Time
Settings:
Signal Time (ET): Choose when the indicator evaluates and locks in the trade signal
1100 = 8:00 AM PT / 11:00 AM ET
1115 = 8:15 AM PT / 11:15 AM ET (default)
1130 = 8:30 AM PT / 11:30 AM ET
1145 = 8:45 AM PT / 11:45 AM ET
1200 = 9:00 AM PT / 12:00 PM ET
Recommendation: Later signal times (8:30-9:00 AM PT) provide more data and reduce morning fakeout signals, but leave less time for theta decay.
Confidence Scoring (9 Factors)
The indicator calculates three scores: Iron Condor (IC), Bullish, and Bearish. The highest score determines the signal.
Factor 1: Price Position vs ORB (max 40 pts)
Inside ORB → +35-40 IC points
Above ORB (confirmed breakout) → +40 Bull points
Below ORB (confirmed breakout) → +40 Bear points
Factor 2: VWAP Slope (max 30 pts)
Flat slope → +25 IC points
Strong positive slope → +30 Bull points
Strong negative slope → +30 Bear points
Factor 3: Price vs VWAP Position (max 20 pts)
Above upper band → +20 Bull points
Below lower band → +20 Bear points
Near VWAP → +12 IC points
Factor 4: VWAP Consistency (max 15 pts)
70%+ bars above VWAP → +15 Bull points
70%+ bars below VWAP → +15 Bear points
Mixed → +10 IC points
Factor 5: Move from Open (max 20 pts)
30% of EM up → +20 Bull points
30% of EM down → +20 Bear points
<12% move either way → +15 IC points
Factor 6: Trend Structure (max 15 pts)
Higher highs + higher lows → +15 Bull points
Lower lows + lower highs → +15 Bear points
No clear structure → +8 IC points
Factor 7: Day Range Containment (max 15 pts)
Range <35% of EM → +15 IC points
Range <50% of EM → +8 IC points
Range >65% of EM → Points to directional score
Factor 8: Gap Behavior (max 12 pts)
Gap up, unfilled, above ORB → +12 Bull points
Gap down, unfilled, below ORB → +12 Bear points
Gap filled, inside ORB → +8 IC points
Factor 9: Prior Day High/Low (max 20 pts)
Above PDH → +20 Bull points
Below PDL → +20 Bear points
Between PDH/PDL → +15-20 IC points
Alignment Bonuses (max 25 pts)
Additional points when multiple factors align in the same direction.
Signal Types
SignalMeaningTradeIRON CONDORRange-bound conditionsSell both put and call credit spreadsPUT SPREADBullish conditionsSell put credit spread onlyCALL SPREADBearish conditionsSell call credit spread onlyNO TRADEConflicting signals or low confidenceStay out
Confidence Levels
ConfidenceColorStrike Mode75%+Green🍆 AGGRESSIVE (tighter strikes, more premium)60-75%Lime/Yellow🌶️ NORMAL (balanced strikes)45-60%Yellow/Orange🐢 CONSERVATIVE (wider strikes, safer)<45%Orange/RedNO TRADE triggered
Strike Suggestions
Base Calculation
For Iron Condors: Strikes are calculated from current price at signal time as the midpoint, ensuring symmetric risk on both sides.
For Directional Spreads: Strikes are calculated from session open, betting on continuation.
Put Strike = Midpoint - (Expected Move × Distance)
Call Strike = Midpoint + (Expected Move × Distance)
Distance Settings:
High Confidence (75%+): 0.60 EM (default) - Tighter strikes, more premium
Mid Confidence (60-75%): 0.70 EM (default) - Balanced
Low Confidence (<60%): 0.80 EM (default) - Wider strikes, safer
Skew Adjustments
When Auto-Adjust for Skew is enabled, strikes are asymmetrically adjusted based on:
VIX Level:
VIX > 20: Puts pushed wider (-0.05), Calls pulled tighter (+0.05)
VIX < 15: Opposite adjustment
2-Day Momentum:
Strong down move: Puts pushed wider
Strong up move: Calls pushed wider
Prior Day Levels:
Below PDL: Puts pushed wider (more downside protection)
Above PDH: Calls pushed wider (more upside protection)
PDH/PDL Strike Reference
If the calculated strike is too close to PDH or PDL, the indicator adjusts to place strikes 10 points beyond these key levels (maximum 20 point adjustment).
Exit Signal System
Three-Stage Warning System
Stage 1: EARLY ⚠️ (Yellow)
Trigger: Price moves against position with:
Below VWAP AND in lower fib zones (for put spreads/IC downside)
Above VWAP AND in upper fib zones (for call spreads/IC upside)
Action: Heightened awareness. Consider reducing position or tightening mental stops.
Note: Only fires once per direction per day to avoid alert fatigue.
Stage 2: CAUTION (Orange)
Trigger:
2+ consecutive bars beyond ORB
Price has traveled 25%+ of the distance to short strike
Action: Actively manage position. Prepare to exit.
Stage 3: EXIT (Red)
Trigger:
3+ consecutive bars beyond ORB (configurable)
Price has traveled 40%+ of the distance to short strike
VWAP slope confirms the move (if enabled)
Action: Close position immediately.
Exit Settings
Exit Confirmation Bars: Consecutive bars required for EXIT signal (default 3)
CAUTION Distance %: How far toward strike before CAUTION (default 25%)
EXIT Distance %: How far toward strike before EXIT (default 40%)
Require VWAP Confirmation: EXIT only fires if VWAP slope confirms direction
Fibonacci Retracement Levels
After signal fires, fib levels are drawn between key price points:
For Iron Condors:
0% = Put Strike
100% = Call Strike
For Put Spreads:
0% = Put Strike (danger zone)
100% = Day High at signal
For Call Spreads:
0% = Day Low at signal
100% = Call Strike (danger zone)
Fib Levels Shown:
0%, 23.6%, 38.2%, 50%, 61.8%, 78.6%, 100%
Fib Zone Tracking: The left table shows current fib zone, color-coded:
Red: Near strikes (danger)
Orange: Approaching strikes
Green: Safe middle zones
Information Tables
Left Table (Position Management)
RowDescriptionSIGNALCurrent trade signal with confidence colorConfConfidence percentageEXITCurrent exit status (HOLD/EARLY/CAUTION/EXIT)Fib ZoneCurrent price position in fib structurePDHPrior day high valuePDLPrior day low valuevs PDPosition relative to prior day rangeModeStrike mode (🍆/🌶️/🐢)PutSuggested short put strikeCallSuggested short call strikeCall Dist% distance traveled toward call strikePut Dist% distance traveled toward put strike
Right Table (Market Factors)
RowDescriptionStructureOverall market structure (BULLISH/BEARISH/RANGE/MIXED)PricePosition relative to ORBVWAPVWAP slope direction and strengthStretchedWarning if price extended from VWAPMoveCurrent move from open as % of EMEM UsedDay range as % of expected moveGapGap status (up/down, filled/unfilled)ReversalV-top or V-bottom detectionConflictAny conflicting signals detectedVIXCurrent VIX levelSkewMomentum-based skew direction
Alerts
The indicator includes pre-configured alerts:
AlertDescriptionEntry: Iron CondorIC signal firedEntry: Put SpreadBullish signal firedEntry: Call SpreadBearish signal firedHigh Confidence EntryAny signal with 75%+ confidenceNo TradeNO TRADE signal firedEARLY WARNINGEarly warning triggeredCAUTIONPosition under pressureEXIT NOWExit signal triggered
Recommended Settings
Conservative (New Traders)
ORB Period: 60 minutes
Signal Time: 1130 (8:30 AM PT)
Min Confidence: 50%
Strike Distances: 0.65 / 0.75 / 0.85
Balanced (Default)
ORB Period: 30-45 minutes
Signal Time: 1115 (8:15 AM PT)
Min Confidence: 45%
Strike Distances: 0.60 / 0.70 / 0.80
Aggressive (Experienced)
ORB Period: 30 minutes
Signal Time: 1100 (8:00 AM PT)
Min Confidence: 40%
Strike Distances: 0.55 / 0.65 / 0.75
Important Notes
This indicator does not guarantee profits. It provides a systematic framework for trade selection and management.
Paper trade first. Test the indicator on historical data and paper trade before using real capital.
Position sizing matters. Never risk more than you can afford to lose on any single trade.
Exits are suggestions. Use the exit signals as guidance, but always apply your own judgment.
Market conditions vary. The indicator performs best in normal volatility environments. Use extra caution during major news events, FOMC days, and earnings season.
SPX/SPY focused. While the indicator may work on other instruments, it was designed specifically for SPX 0DTE options trading.
Version History
v3.0
Added 45/60 minute ORB options
Added configurable signal time (8:00-9:00 AM PT)
Added stretched detection (VWAP distance warning)
Added Prior Day High/Low as scoring factor
Iron Condor strikes now centered on current price (symmetric risk)
Split table UI (left: position, right: factors)
PDH/PDL reference for strike adjustments
Credits
Developed for the 0DTE SPX options trading community. Inspired by SMB Capital's ORB methodology, VWAP analysis techniques, and real-world credit spread trading experience.
Disclaimer: This indicator is for educational and informational purposes only. It is not financial advice. Trading options involves substantial risk of loss and is not suitable for all investors. Past performance is not indicative of future results.

Monte Carlo Simulation BandsMonte Carlo Simulation v2.4.2
Plots a one-bar-ahead price distribution band built from many simulated paths. The green band shows empirical percentiles of simulated final prices—these are distribution bounds, not a confidence interval of the mean.
What It Does
Simulates many one-bar price paths using a directional random walk with volatility scaling (uniform shocks, not Gaussian GBM).
Plots Mean Forecast, Median Forecast, and configurable percentile bounds (default 5th/95th).
Optional rolling HTF-days mean line (yellow) for trend context.
Optional labels and forward projection lines.
Alerts when the confirmed close breaks above or below the percentile band.
Non-Repainting & HTF Behavior (Fail-Closed)
All calculations are gated to confirmed bars only via explicit no_repaint_ok gate (barstate.isconfirmed).
If you select an HTF Resolution, the script uses a strict request.security(..., lookahead_off, gaps_off) pipeline.
If HTF data is unavailable, outputs are na—no silent fallback to chart timeframe.
A separate "HTF Alignment (lagged)" plot shows the prior HTF close (htf_price ) as visual proof of no look-ahead.
Volatility Source & Scaling
If "Use Historical Volatility" is enabled, volatility is estimated from log returns on the selected resolution (HTF if set, otherwise chart).
Annualization adapts to session type:
Equities: 6.5 hours/day, 252 trading days/year
Crypto: 24 hours/day, 365 days/year
Substeps increase path smoothness within the same one-bar horizon—they do not extend the forecast to multiple bars.
Key Inputs
• Prob Up / Prob Down — Must satisfy Prob Up + Prob Down ≤ 1.0. If violated, simulation is skipped and table shows "✗ PROB>1".
• # Simulations / # Substeps — Higher = smoother/more stable, but slower. Default 100×100 is a good balance.
• Lower/Upper Percentile — Define the band width (e.g., 5 and 95 for a 90% distribution band).
• Run On Last Bar Only — Performance mode (recommended). Skips historical computation; updates on each new confirmed bar.
• Resolution (HTF) — Leave blank for chart timeframe, or set to Weekly/Monthly for HTF-aligned simulation.
• Crypto 24/7 Session? — Enable for crypto markets to use correct annualization (365d, 24h).
How to Use (Quickstart)
Start with defaults and keep Run On Last Bar Only = true for speed.
Set Prob Up and Prob Down so their sum ≤ 1.0 (e.g., 0.5 + 0.5 = 1.0 for neutral).
Enable "Use Historical Volatility" and set a Volatility Lookback (e.g., 20 bars) for data-driven vol.
Set Resolution (HTF) if you want the model to run on higher timeframe data (e.g., 1W). Expect updates only when a new HTF interval starts.
Choose percentiles (e.g., 5 and 95) to define your distribution band width.
Enable alerts for "Price Above Upper Percentile" or "Price Below Lower Percentile" to get notified of breakouts.
Limitations & Disclosures
Forecast horizon is one bar only. Substeps do not create a multi-bar forecast.
Model uses uniform shocks with direction chosen from Prob Up/Down. This is not Geometric Brownian Motion (GBM) and is not calibrated to any option-implied distribution.
Bounds are percentiles of final simulated prices, not a statistical confidence interval of the mean.
HTF mode updates at the start of a new HTF interval (first chart bar where the HTF timestamp changes), so the band appears "step-like" in realtime.
Historical volatility requires enough bars for the selected lookback; until then, values may be na.
Performance depends on Sims × Substeps; extreme settings (e.g., 500×500) can be slow.
This indicator does not predict direction—it shows a probabilistic range based on your inputs.
