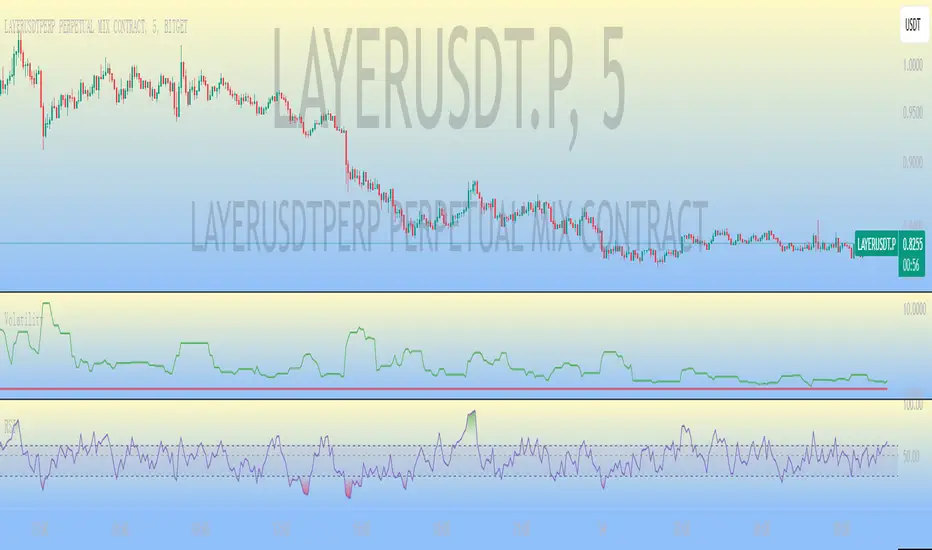
VolatilityVolatility - The amount of price deviation in the specified time interval.
The calculation is made from the opening point to the closing point, and the maximum and minimum deviation between them is also included. Any timeframes are supported.
Available information: the start date of the calculation (according to the time zone of the exchange), the current volatility from the initial opening point or from the last closing point, the total volatility for all periods.
An indicator of useful use in everyday work.
Thanks for your attention!
Cerca negli script per "Volatility"


Volatility Tsunami RegimeVolatility Tsunami Regime
This indicator identifies periods of extreme volatility compression to help anticipate upcoming market expansions. It detects when volatility is unusually quiet, which historically precedes violent price moves.
The script pulls data from the CBOE VIX and VVIX indices regardless of the chart you are viewing. It calculates the standard deviation of both indices over a user-defined lookback period (default is 20). If the standard deviation drops below specific thresholds, the script flags the market regime as compressed.
The background color changes based on the severity of the compression. A red background signals a Double Compression, meaning both the VIX and VVIX are below their volatility thresholds. An orange background signals a Single Compression, meaning only one of the two indices has dropped below its threshold.
Use this tool to spot the "calm before the storm." When the background is red, volatility is statistically suppressed, making it a prime time to look for breakouts or buy options while premiums are cheap. Conversely, it serves as a warning to tighten stops if you are short volatility.

Volatility Forecast/*==============================================================================
Volatility Forecast — Publishable Documentation
Author: @BB_9791
License: Mozilla Public License 2.0
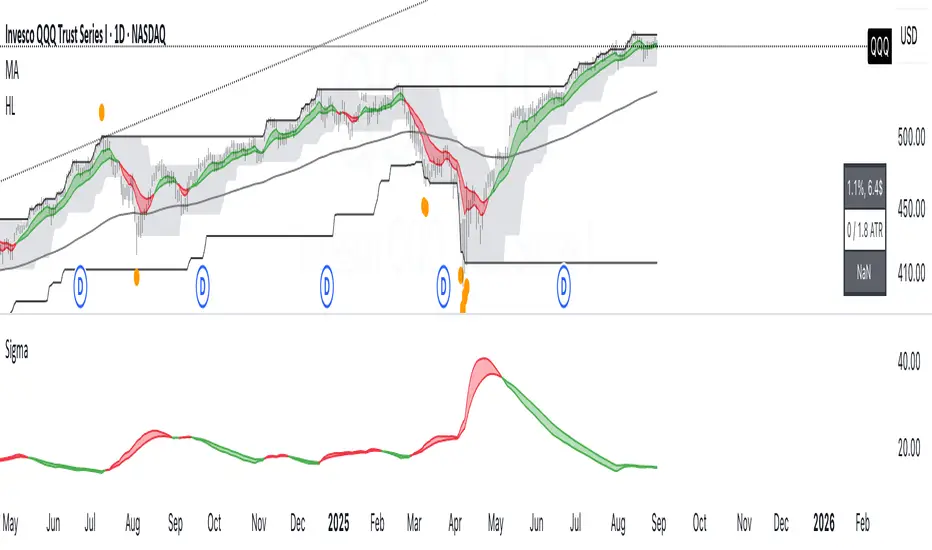
WHAT THIS INDICATOR SHOWS
- A daily volatility estimate in percent points, called sigma_day.
- A slow volatility anchor, the 10-year EMA of sigma_day.
- A blended volatility series in percent points:
sigma_blend = (1 − p) * sigma_day + p * EMA_10y(sigma_day)
where p is the Slow weight %, default 30.
- Optional annualization by multiplying by 16, this is a daily-to-annual
conversion used by Robert Carver in his writings.
METHODOLOGY, CREDIT
The estimator follows the approach popularized by Robert Carver
("Systematic Trading", "Advanced Futures Trading Strategies", blog qoppac).
Current daily volatility is computed as an exponentially weighted standard
deviation of daily percent returns, with alpha = 2 / (span + 1).
The slow leg is a long EMA of that volatility series, about 10 years.
The blend uses fixed weights. This keeps the slow leg meaningful through
large price level changes, since the blend is done in percent space first.
MATH DETAILS
Let r_t be daily percent return:
r_t = 100 * (Close_t / Close_{t−1} − 1)
EWMA mean and variance:
m_t = α * r_t + (1 − α) * m_{t−1}
v_t = α * (r_t − m_t)^2 + (1 − α) * v_{t−1}
where α = 2 / (span_current + 1)
Current daily sigma in percent points:
sigma_day = sqrt(v_t)
Slow leg:
sigma_10y = EMA(sigma_day, span_long)
Blend:
sigma_blend = (1 − p) * sigma_day + p * sigma_10y
Annualized option:
sigma_ann = 16 * sigma_blend
INPUTS
- Threshold (percent points): horizontal guide level on the chart.
- Short term span (days): EW stdev span for sigma_day.
- Long term span (days): EMA span for the slow leg, choose about 2500 for 10 years.
- Slow weight %: p in the blend.
- Annualize (x16): plot daily or annualized values.
- Show components: toggles Current and 10y EMA lines.
- The script uses the chart symbol by default.
PLOTS
- Blended σ% as the main line.
- Optional Current σ% and 10y EMA σ%.
- Editable horizontal threshold line in the same units as the plot
(percent points per day or per year).
- Optional EMA 9 and EMA 20 cloud on the blended series, green for uptrend
when EMA 9 is above EMA 20, red otherwise. Opacity is configurable.
HOW TO READ
- Values are percent points of movement per day when not annualized,
for example 1.2 means about 1.2% typical daily move.
- With annualize checked, values are percent points per year, for example 18
means about 18% annualized volatility.
- Use the threshold and the EMA cloud to mark high or low volatility regimes.
NOTES
- All calculations use daily data via request.security at the chart symbol.
- The blend is done in percent space, then optionally annualized, which avoids
bias from the price level.
- This script does not produce trading signals by itself, it is a risk and
regime indicator.
CREDITS
Volatility forecasting method and scaling convention credited to Robert Carver.
See his books and blog for background and parameter choices.
VERSION
v1.0 Initial public release.
==============================================================================*/

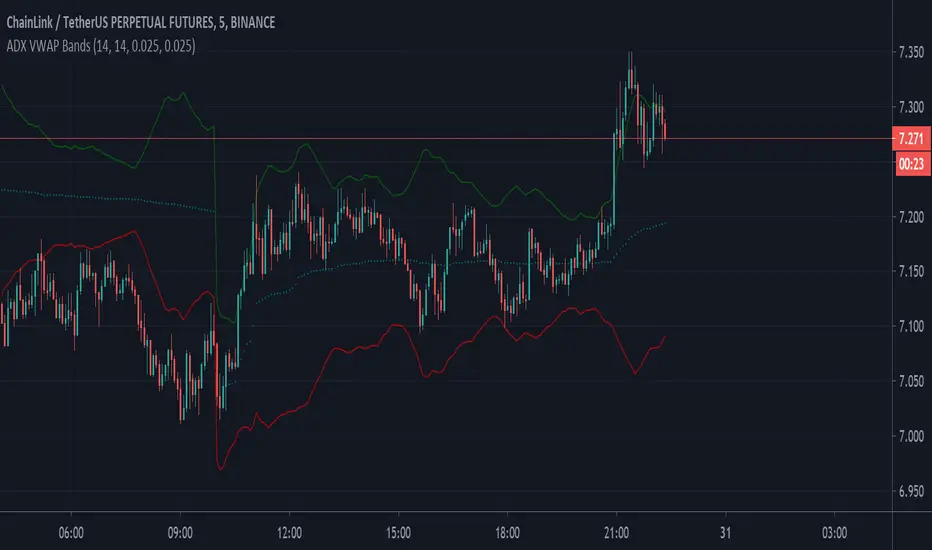
VOLATILITY Based VWAP Bands with Upper% and Lower% BandsVolatility based VWAP Bands with an Upper band x% higher than the normal VWAP and a Lower band x% lower.
The script uses ADX to create much better OVERBOUGHT and OVERSOLD regions.
- Settings Guide -
~ 0.01 in settings = 1% +/- VWAP
~ Step increment of 0.005 to make setting changes easier.


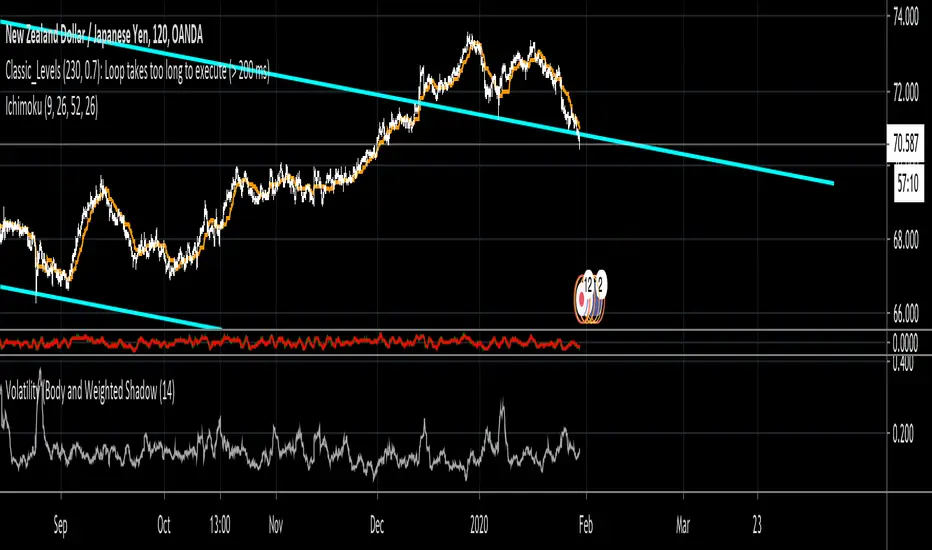
Volatility (Body and Weighted Shadow)- Volatility Indicator
- Replacement for ATR
- As each pair holds a different level of volatility, a stop loss can be set using this indicator rather than via a ratio 2:1, etc. e.g. 2 X Volatility Value = S/L...
- This indicator averages the bodies of candlesticks over a default length of 14 periods. It also considers the length of shadows via a weighted average. This is done as it is assumed that financial institutions tend to move price to levels that do not hold (shadows). Therefore, wick lengths are less significant than the candlestick bodies, so they are weighted to hold less value.
Volatility vs ATRVolatility vs ATR Indicator Description for TradingView
Volatility vs ATR is a powerful custom indicator designed to help traders analyze and compare market volatility with the Average True Range (ATR). This indicator provides valuable insights into the dynamic behavior of asset prices, enabling traders to make informed decisions about market trends, potential reversals, and risk management.
What Does It Measure?
Volatility: Represents the degree of price variation over a given period. Calculated using standard deviation or other measures, it highlights periods of heightened or reduced market activity.
Average True Range (ATR): Measures the average range of price movement over a specific period, providing a sense of the asset's price fluctuations and market activity.
How It Works
The indicator plots both Volatility and ATR on the same chart, making it easy to visualize how these metrics interact.
Rising Volatility often signals increased market uncertainty or the beginning of strong trends.
ATR Spikes typically accompany high volatility, helping identify potential breakout or breakdown scenarios.
By tracking the interplay between these metrics, traders can anticipate shifts in momentum, recognize consolidation phases, and plan trades more effectively.
Key Features
Dual-Line Display: Clearly plots both Volatility (red) and ATR (blue) for easy comparison.
Customizable Periods: Allows you to adjust the lookback period for both metrics to match your trading style.
Versatile Application: Works across all asset classes, including stocks, forex, crypto, and commodities.
Why Use Volatility vs ATR?
Trend Analysis: Identify trending vs. ranging markets by observing the relationship between Volatility and ATR.
Breakout Confirmation: Use Volatility and ATR spikes as confirmation signals for potential breakouts.
Risk Management: Plan stop-loss levels and position sizing based on ATR values.
How to Use It
Add the indicator to your chart.
Look for periods where Volatility diverges from ATR to spot potential market shifts.
Use the indicator in conjunction with price action and other technical tools for a comprehensive analysis.
This indicator is ideal for traders looking to enhance their strategies by understanding market dynamics through the lens of volatility and average price movement.
Let me know if you’d like further refinement!

Volatility Spectrum - Whvntr"Volatility Spectrum" is a useful technical indicator crafted for traders who prioritize precision in volatility analysis. This tool revolutionizes the traditional Average True Range (ATR) concept by offering a nuanced, multi-faceted view of market volatility.
Key Features:
Enhanced Volatility Insights: Seamlessly integrates standard ATR with an average ATR for a more detailed volatility analysis.
Customizable Parameters: Users can tailor the ATR and average ATR lengths to align with various trading styles and timeframes.
Multiple Smoothing Techniques: Options like RMA, SMA, EMA, or WMA are available to customize the ATR's responsiveness.
Dynamic Color Indicators: Unique color gradients visually represent different levels of volatility, aiding in quick and effective analysis.
Configurable Volatility Alerts: Set up alerts for specific high or low volatility conditions to assist in making informed decisions.
Intuitive Backgrounds: The background color shifts in response to volatility levels, offering an instant read on market dynamics .
Personalized Color Settings: Customize the color scheme for high and low volatility indicators to fit personal preferences and trading dashboards.
When and Where to Use:
Diverse Market Application: Suitable for various markets, including stocks, forex, and commodities.
Strategy Enhancement: Integrates with trading strategies for improved risk management and optimized entry/exit points.
Adaptable for All Trading Styles: Effective for both short-term day trading and long-term investment approaches.
Informed Trading Decisions: Best used in conjunction with other indicators for a well-rounded approach to volatility-based trading.
"Volatility Spectrum" is an essential tool for traders looking to enrich their understanding of market volatility. Its adaptability and depth make it a valuable component in any trader's toolkit, suitable for a range of markets and trading strategies.
"While 'Volatility Spectrum' provides valuable insights into market volatility, its indications should not be interpreted as definitive predictions or guarantees of future market behavior."


Volatility Pulse with Dynamic ExitVolatility Pulse with Dynamic Exit
Overview
This strategy, Volatility Pulse with Dynamic Exit, is designed to capture impulsive price moves following volatility expansions, while ensuring risk is managed dynamically. It avoids trades during low-volatility periods and uses momentum confirmation to enter positions. Additionally, it features a time-based forced exit system to limit overexposure.
How It Works
A position is opened when the current ATR (Average True Range) significantly exceeds its 20-period average, signaling a volatility expansion.
To confirm the move is directional and not random noise, the strategy checks for momentum: the close must be above/below the close of 20 bars ago.
Low volatility zones are filtered out to avoid chop and poor trade entries.
Upon entry, a dynamic stop-loss is set at 1x ATR, while take-profit is set at 2x ATR, offering a 2:1 reward-to-risk ratio.
If the position remains open for more than 42 bars, it is forcefully closed, even if targets are not hit. This prevents long-lasting, stagnant trades.
Key Features
✅ Volatility-based breakout detection
✅ Momentum confirmation filter
✅ Dynamic stop-loss and take-profit based on real-time ATR
✅ Time-based forced exit (42 bars max holding)
✅ Low-volatility environment filter
✅ Realistic settings with 0.05% commission and slippage included
Parameters Explanation
ATR Length (14): Captures recent volatility over ~2 weeks (14 candles).
Momentum Lookback (20): Ensures meaningful price move confirmation.
Volatility Expansion Threshold (0.5x): Strategy activates only when ATR is at least 50% above its average.
Minimum ATR Filter (1.0x): Avoids entries in tight, compressed market ranges.
Max Holding (42 bars): Trades are closed after 42 bars if no exit signal is triggered.
Risk-Reward (2.0x): Aiming for 2x ATR as profit for every 1x ATR risk.
Originality Note
While volatility and momentum have been used separately in many strategies, this script combines both with a time-based dynamic exit system. This exit rule, combined with an ATR-based filter to exclude low-activity periods, gives the system a practical edge in real-world use. It avoids classic rehashes and integrates real trading constraints for better applicability.
Disclaimer
This is a research-focused trading strategy meant for backtesting and educational purposes. Always use proper risk management and perform due diligence before applying to real funds.

VolatilityThis is a filtering indicator Volatility in the CTA contract of BG Exchange. According to their introduction, it should be calculated using this simple method.
However, you may have seen the problem. According to the exchange's introduction, the threshold should still be divided by 100, which is in percentage form. The result I calculated, even if not divided by 100, still shows a significant difference, which may be due to the exchange's mistake. Smart netizens, do you know how the volatility of BG Exchange is calculated.
The official introduction of BG Exchange is as follows: Volatility (K, Fluctuation) is an additional indicator used to filter out positions triggered by CTA strategy signals in low volatility markets. Usage: Select the fluctuation range composed of the nearest K candlesticks, and choose the highest and lowest closing prices. Calculation: 100 * (highest closing price - lowest closing price) divided by the lowest closing price to obtain the recent amplitude. When the recent amplitude is greater than Fluctuation, it is considered that the current market volatility meets the requirements. When the CTA strategy's position building signal is triggered, position building can be executed. Otherwise, warehouse building cannot be executed.
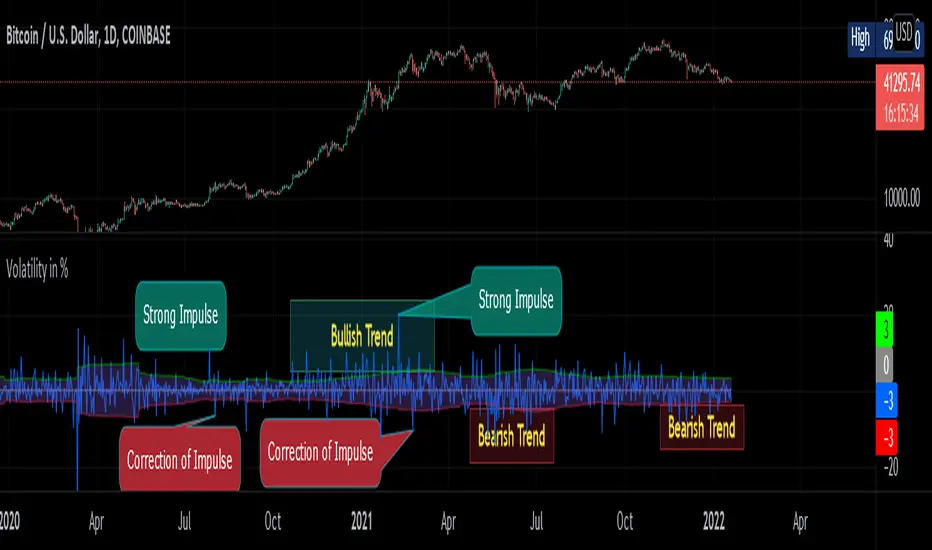
Volatility in % by zdmreVolatility is a statistical measure of the dispersion of returns for market index. In most cases, the higher the volatility, the higher the risk. Volatility is often measured as either the standard deviation or variance between returns from market index.
This indicator helps you identify the direction of the trend by calculating the standard deviation of the movement.
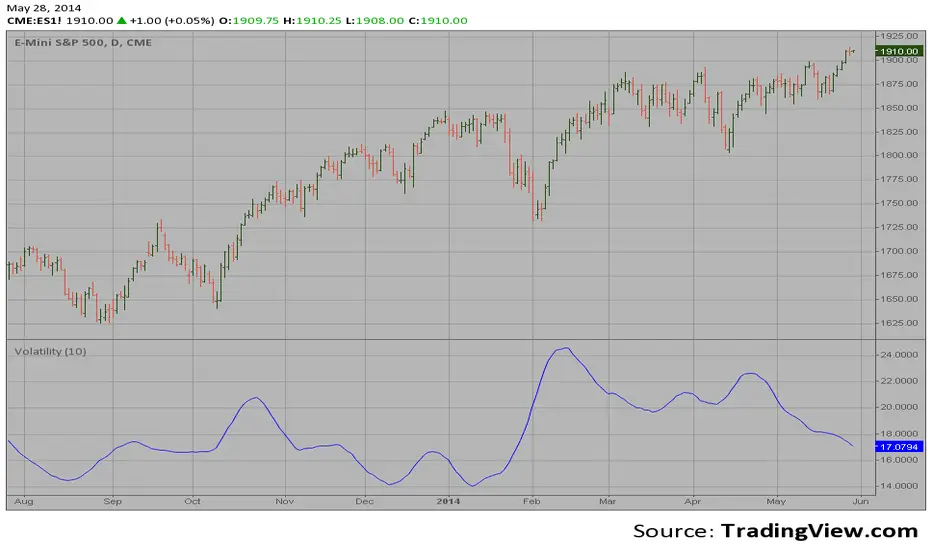
Volatility The Volatility function measures the market volatility by plotting a
smoothed average of the True Range. It returns an average of the TrueRange
over a specific number of bars, giving higher weight to the TrueRange of
the most recent bar.
Volatility ContractionVolatility Contraction is a strong trading setup for Positional Traders. It works on following time frame: Daily, Weekly and Monthly.

Volatility Traders Minds Strategy (VTM Strategy)Volatility Traders Minds Strategy (VTM Strategy)
I found this startegy on internet, with a video explaingin how it works.
Conditions for entry:
1 - Candles must to be above or bellow the 48 MA (Yellow line)
2 - Candles must to break the middle of bollinger bands
3 - Macd must to be above or bellow zero level;
4 - ADX must to be above 25 level
Credits to who developed this startegy (google it).
Thanks to all pinescripters mentined in the code for their snippets.
It could be improved with stop loss based on ATR etc.
I have also a study with alerts.
Please use comment section for any feedback or contact me if you need support.


VolatilityThis script shows three different calculations for volatility.
All three can be used as Stop-Loss...
- Absolute Price Changes
- Maximum Price Fluctuation
- and every one should know Average True Range
The script has a dark and light theme.
And the colors can be changed and each can be deactivated.
On top of that I stumbled over the fact that when MPF crosses over APC
this could result in a significant change in price and could also be used as an entry or exit.
This is also highlighted by default. You can change its background color and you can deactivate it too.
ACP measures volatility over most recent close prices.
This is excellent for comparing volatility.
It includes both frequency and magnitude.
In other words: Sum of differences between second to last close price and last close price as absolute value for 'n' bars.
MPF measures volatility over most recent candles, which could be used as an estimate of risk.
It may also be effective as the basis for a stop-loss or take-profit,
like the ATR but it ignores the frequency of directional changes within the time interval.
In other words: The difference between the highest high and lowest low over 'n' bars.
When you don't know what the ATR is then you can look at this link .

VolatilityFlex LevelsThe VolatilityFlex Levels indicator computes the degree of change (or sigma) by leveraging the selected Volatility Index (such as VIX or any user-specified volatility index). It utilizes this information to graphically represent distinct levels for a designated financial instrument. These levels include -sigma, -3/4sigma, -1/2sigma, -1/4sigma, 1/4sigma, 1/2sigma, 3/4sigma, and sigma.

Volatility StopThe Volatility Stop Indicator is able to define the current trend. When a downward trend is determined a red line above the prices bars is plotted; when an upward trend is determined a green line below the prices bars is plotted. These lines are generally used as trailing stops. The Volatility Stop Indicator is more used as an exit tool than an entry tool. When the price crosses the VStop value, the trend reverses and VStop moves to the other side of price.
We'd like to present you VStop indicator written in Pine Script. Please notice new Pine Script features used in this indicator: variables max_, min_, is_uptrend, vstop. We may refer to previous values of the indicator in the source code (e.g. vstop , is a vstop value on the previous bar) before the actual vstop variable definition. Enjoy and leave your comments!

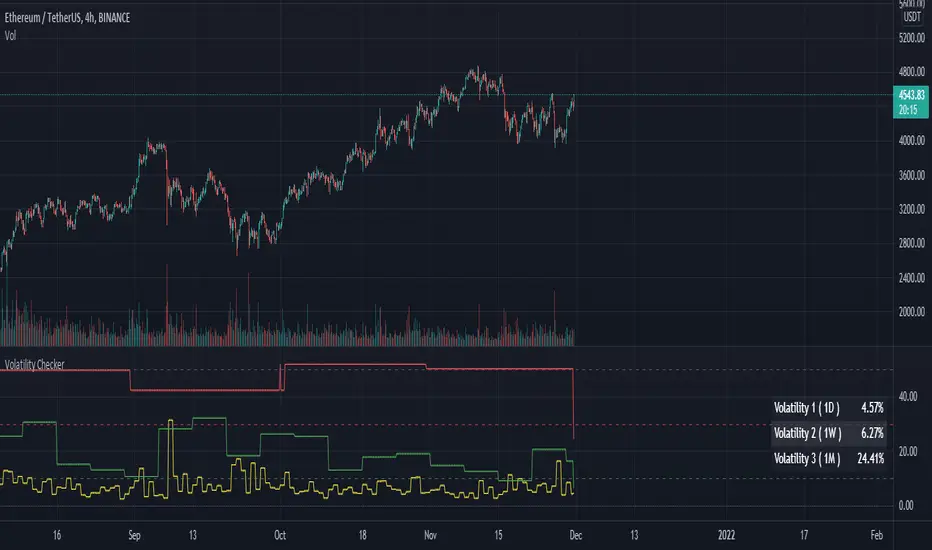
Volatility CheckerWhenever we want to find out volatility of the current chart, we need to visit screener and check the latest percentage. Because of this frustration by visiting screener page, I made this script. And there is no script like this, so it's open and free to use.
This script is detect current percentage of volatility as indicator way. Screener show default 1D volatility. But this script is not only show 1D volatility. You can change the resolution whatever you like. And you can switch more resolution style. But I think, 1D resolution is better. This script is best for crypto investors. I've no idea about stock/forex, so hmmmmm.
Hline helps you to detect the position of the volatility. I always like to check those symbol which is less than 30. Because it's best for scalping. Less than 10 is best for swing traders.
Feel free to use. Any feedback? welcome to comment zone :)