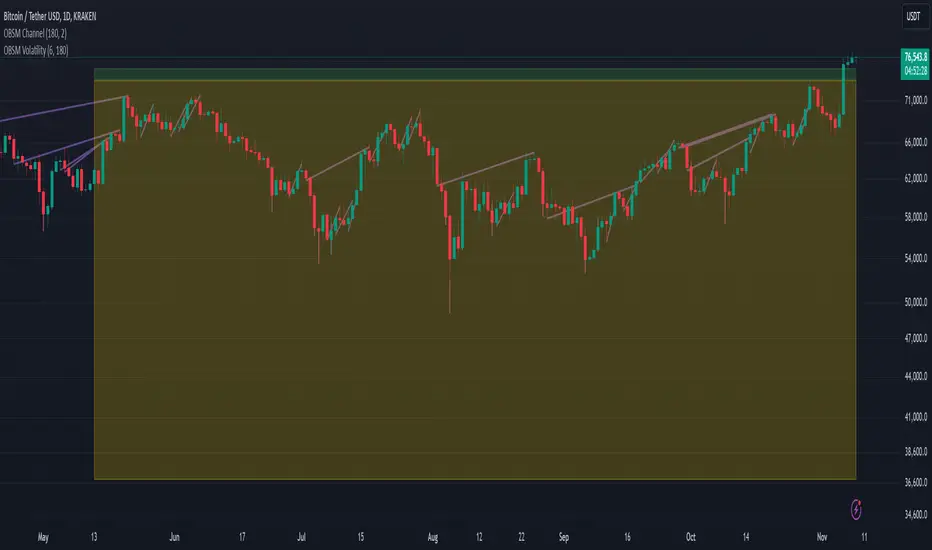
Session Volatility CalculatorHey traders!
This script calculates the average volatility of trading sessions.
You specify a start date, an end date, and a session time (eg. market open, Asian session etc)
The script then scans through all the price action on your chart and calculates the average price movement during that specified period.
What Is It For?
I created this script for my own purposes when developing certain strategies and testing certain ideas.
The purpose of this script is to give you an idea of how much price tends to move during certain times of day for certain markets.
You could think of it as a "session's average true range".
In crypto and forex this might be how much price tends to move on certain pairs during the Australian/Asian session, or the European session, or the overnight U.S. session etc.
In stocks this might be how much a symbol tends to move during the first hour of the day or the last hour of the day.
The point of calculating this information is for better understanding how markets move during certain times of day.
It's not a perfect science obviously since some days can be wilder than others depending on what fundamental events are developing, but it's useful information to have for times when there are no expected volatility-inducing events.
This info can help with optimizing targets and stop loss placement for certain day-trading strategies, and just generally getting an idea of what kinds of moves you might reasonably expect out of overnight positions or certain times of day etc - or at least that's what I use it for.
Settings
Hover your mouse over the "i" symbol to get more information on the script's settings, but here's a brief description:
Start Date: The date to begin calculating from (set to 1000 by default so it scans the entire chart).
End Date: The date to stop calculating (set to 2099 by default so it scans the entire chart)
Time Session: This is the time session during the day that you want to analyze.
Color Background: If turned on, this setting changes the background color to highlight the session.
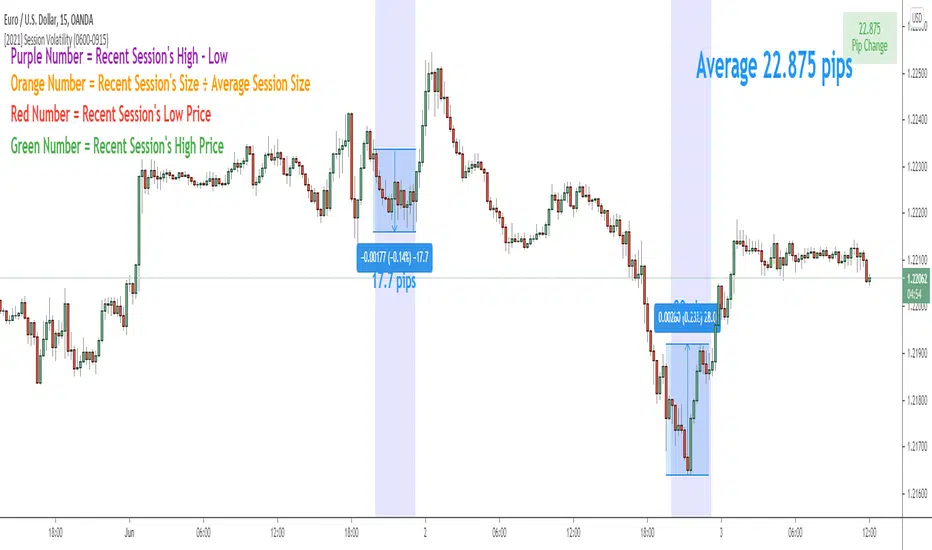
Indicator Values
The indicator outputs a handful of values onto your chart. This is what the colors correspond to:
Top-Right Box: The average price range during the given time of day over historical price action.
Green Number: The recent session's highest price.
Red Number: The recent session's lowest price.
Purple Number: The recent session's price range (high - low).
Orange Number: The recent session's range ÷ the average (outputs a relative % of the average).
Cerca negli script per "Volatility"
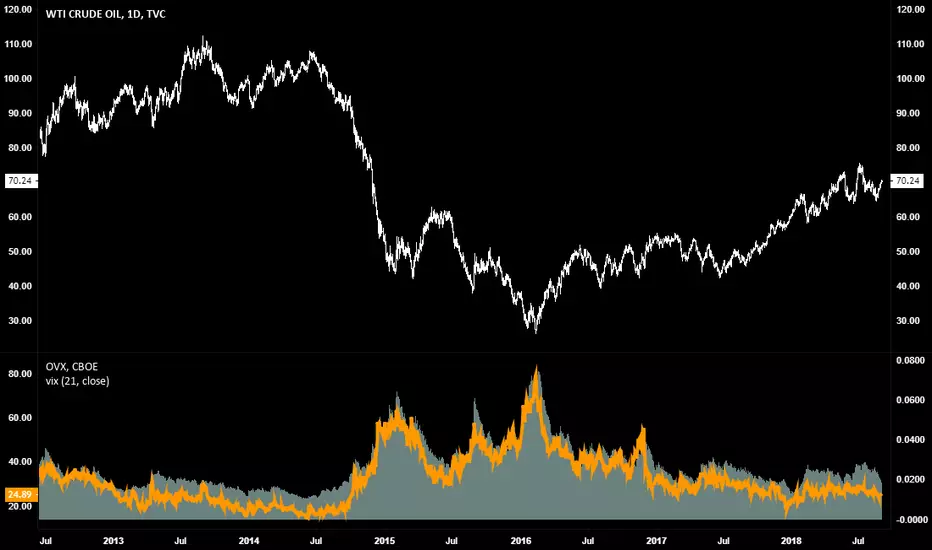
The dispersion of volatility indicesThe script is my implementation of "Forecasting a Volatility Tsunami" by Andrew Thrasher (Thrasher Analytics). You can find the paper here: www.researchgate.net
I've changed a bit the approach - instead of two volatility indices (VIX & VVIX), I used two more: VXN and VXD. Additionally, I average the percentiles, but there is an option to swtich it to the original approach.

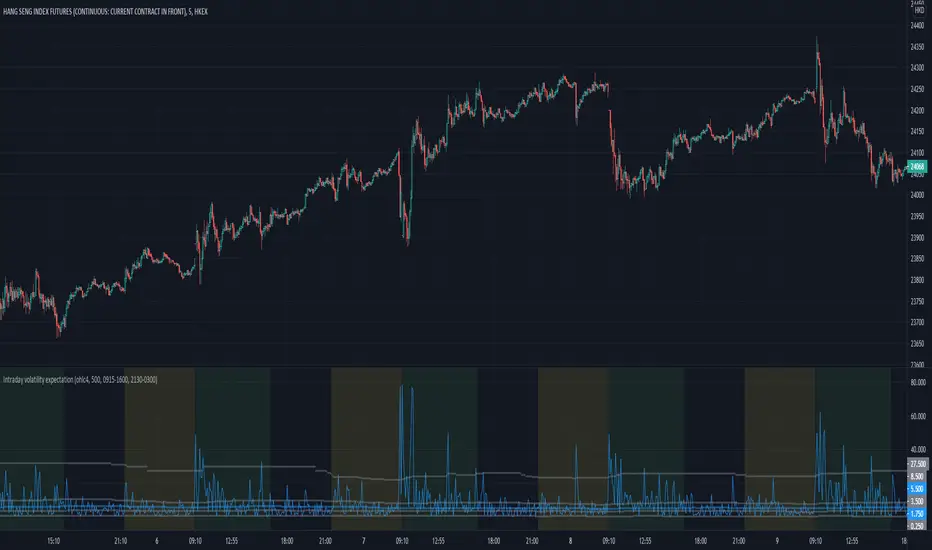
Intraday volatility expectationManaging expectation is important for price action traders.
This indicator mainly for intraday reference, and it plots the price change/ volatility statistics on a bar-to-bar basis, with the marking of +/- 1 and 2 sigma SD .
The user can refer to the historical volatility to manage their expectation of the velocity of price action by referring to these statistics.
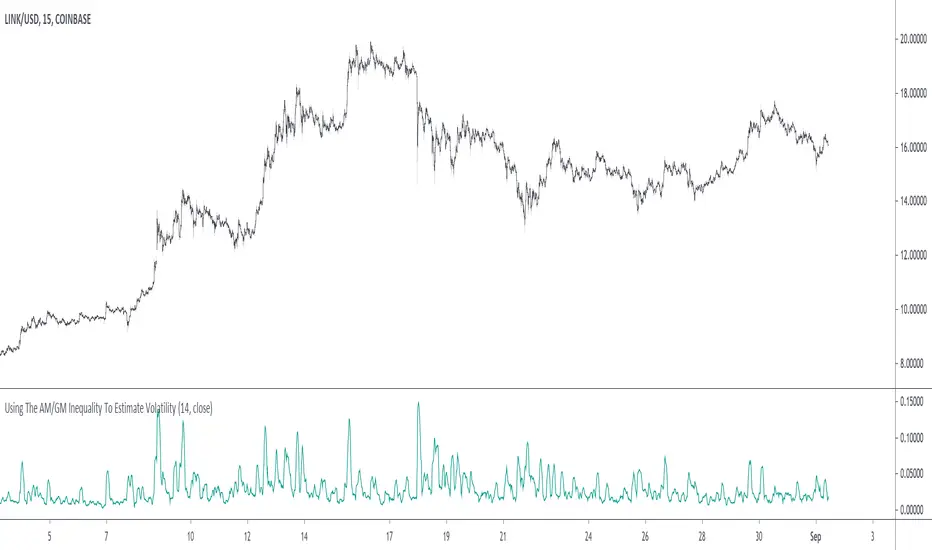
Using The AM/GM Inequality To Estimate VolatilityA volatility indicator derived from the AM/GM inequality. I don't think it will be necessary to describe the usage and interpretation of such indicator, and I don't think it is super useful, however, this is not the case of the script, which contains three ways to compute the geometric mean, with a classic, a simple, and an efficient way. The AM/GM inequality is also a really interesting concept, and I'll try to"prove" it in this post by using DSP. I also added more comments in the script in order to highlight some stuff.
The AM/GM Inequality
When we talk about the mean, we are referring to the "arithmetic" one by default, but there exist more types of means. Two other ones include the "geometric" and "harmonic" means, both are part of the Pythagorean means with the arithmetic mean.
Each one of them as several properties, but the most interesting aspect is their inequality, that is:
HM <= GM <= AM
The arithmetic mean is the one with the highest value, while the harmonic mean is the one with the lowest value. In the case each data point is equal to each other, all the means have the same value.
In our case, the inequality of interest is the inequality between the geometric and arithmetic mean, where the geometric mean is lower or equal than the arithmetic one. Many proofs/explanations exist, I'll try my version using DSP, where instead of thinking about means, we think about rolling means, which allows us to interpret them as low-pass filters. So we end up having the geometric moving average (GMA) and arithmetic moving average (SMA).
We know that GMA <= SMA , the SMA has a unity passband, this implies that the GMA has a passband lower than 1 (for non-equal input values), this explains why the GMA is smaller than the SMA. In order for a FIR filter to have a passband lower than 1, the sum of the filter coefficients must be lower than 1. In order to further proves this consider the following equation:
sqrt(a×b) = k×a + k×b
Here sqrt(a×b) is the geometric mean of a and b , the right-hand side of the equation is a weighted sum between a and b and coefficient k , we want to solve the equation with respect to k , if k×2 < 1 then we have the proof that GMA < SMA . The solution with respect to k is:
k = sqrt(a×b)/(a+b)
which always gives a number lower than 0.5, as such k×2 < 1 and thus the passband is lower than 1. If our input values are equal to each other, we end up with the following solution for k :
k = sqrt(a×a)/(a+a) = a/(2×a) = 0.5
as such the GMA has the coefficients of an SMA as long as the input values are equal to each other.
Because of this inequality, we can subtract the SMA to a GMA and take the square root of the result in order to have a volatility indicator, however, both moving averages are still pretty close to each other, which gives a very small result for the indicator.
Uwu I am a bit tired, better indicators coming up
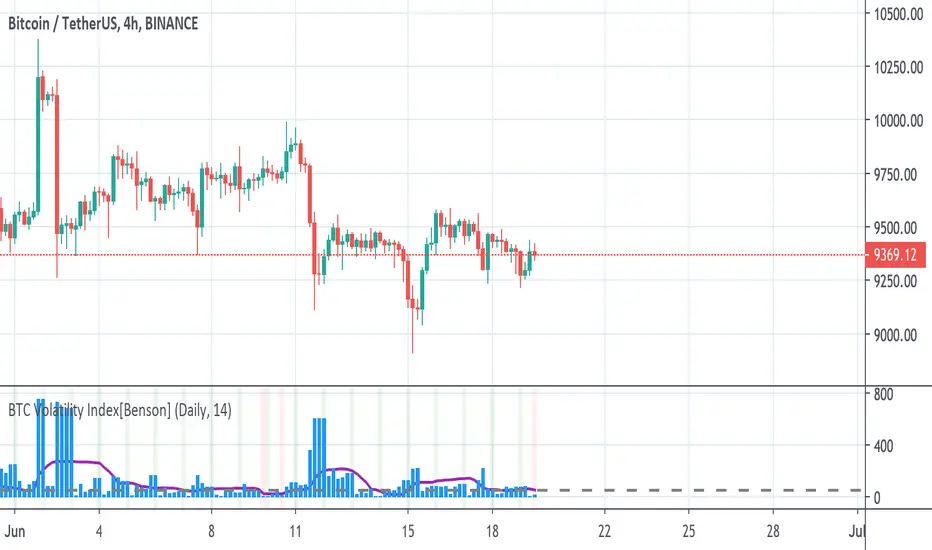
BTC Volatility Index[Benson]This indicator is for choosing the best timing to long BTC move future on FTX.
The basic idea is that when BTC's price volatility Index is relatively low(under 50 in 4hr timeframe or under 200 in D timeframe), it's more likely to have huge volatility afterwards, which it's a good time to long BTC's move future.
Green background --> Move future expected strike price
Red background --> Good timing to long BTC move future
Revolution Volatility Bands With Range Contraction Signal VIIAlso one of my favorite indicators. Very simple and easy to use. Essentially volatility bands with a technical analysis pattern, the triangle/wedge, which I have called "contraction signal". Put simply: When price is written in blue, volatility overall is falling. When the outer bands start to fatten up in blue, a contraction signal is forming. Works with any length of your choosing.

Best Volatility CalculatorHello traders,
This indicator shows the average volatility, of last N Periods, for the selected time frames.
You can select up to 2 timeframes with this version
Volatility is defined as the close of current candle - close of the previous N candle
Presented as Currency, Pip, percentage labels in a panel below.
Will calculate in real-time only for the current instrument on the chart.
The indicator is coded to not be repainting
Example
In the indicator screenshot, I used a lookback period of 1.
That compares the current candle close versus the previous one for the daily and weekly timeframe
Showing how the results are calculated for the weekly calculations
Enjoy :)
Best regards
Dave

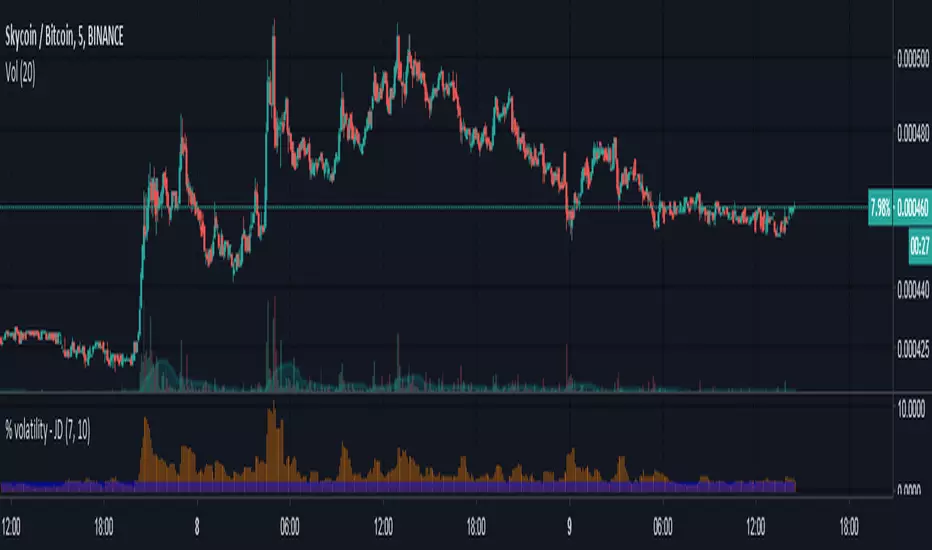
% volatility - JDA small script to quickly scan through coins based on % volatility, eg. for AB-trading.
Both lookback length of the number of bars and the minimum volatility threshold can be changed.
JD.
Realized VolatilityRealized Volatility, using the 21 period Average True Range formula with a log scaling of source input values.
Designed to match the CBOE's Volatility indexes across all timeframes and instruments.
ADX Volatility Moving AverageThe ADXVMA is a volatility based moving average with the volatility being determined by the value of the ADX. The ADXVMA provides levels of support during uptrends and resistance during downtrends. Original NT indicator by Fat Tails on futures.io, just ported it to pinescript

Chaikin Volatility Strategy Backtest Chaikin's Volatility indicator compares the spread between a security's
high and low prices. It quantifies volatility as a widening of the range
between the high and the low price.
You can use in the xPrice1 and xPrice2 any series: Open, High, Low, Close, HL2,
HLC3, OHLC4 and ect...
You can change long to short in the Input Settings
Please, use it only for learning or paper trading. Do not for real trading.

Chaikin Volatility StrategyChaikin's Volatility indicator compares the spread between a security's
high and low prices. It quantifies volatility as a widening of the range
between the high and the low price.
You can use in the xPrice1 and xPrice2 any series: Open, High, Low, Close, HL2,
HLC3, OHLC4 and ect...

Chaikin Volatility Chaikin's Volatility indicator compares the spread between a security's
high and low prices. It quantifies volatility as a widening of the range
between the high and the low price.
You can use in the xPrice1 and xPrice2 any series: Open, High, Low, Close, HL2,
HLC3, OHLC4 and ect...

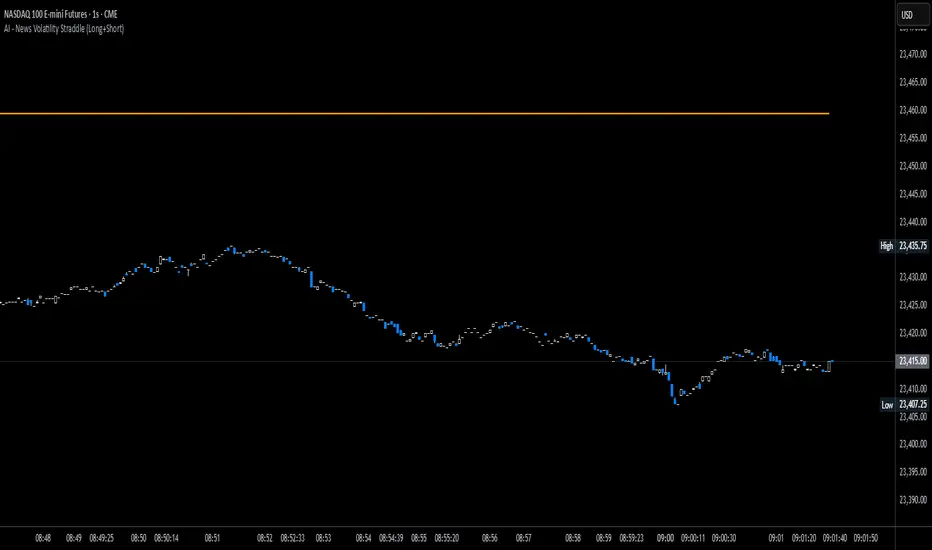
News Volatility Bracketing StrategyThis is a news-volatility bracketing strategy. Five seconds before a scheduled release, the strategy brackets price with a buy-stop above and a sell-stop below (OCO), then converts the untouched side into nothing while the filled side runs with a 1:1 TP/SL set the same distance from entry. Distances are configurable in USD or %, so it scales to the instrument and can run on 1-second data (or higher TF with bar-magnifier). The edge it’s trying to capture is the immediate, one-directional burst and liquidity vacuum that often follows market-moving news—entering on momentum rather than predicting direction. Primary risks are slippage/spread widening and whipsaws right after the print, which can trigger an entry then snap back to the stop.
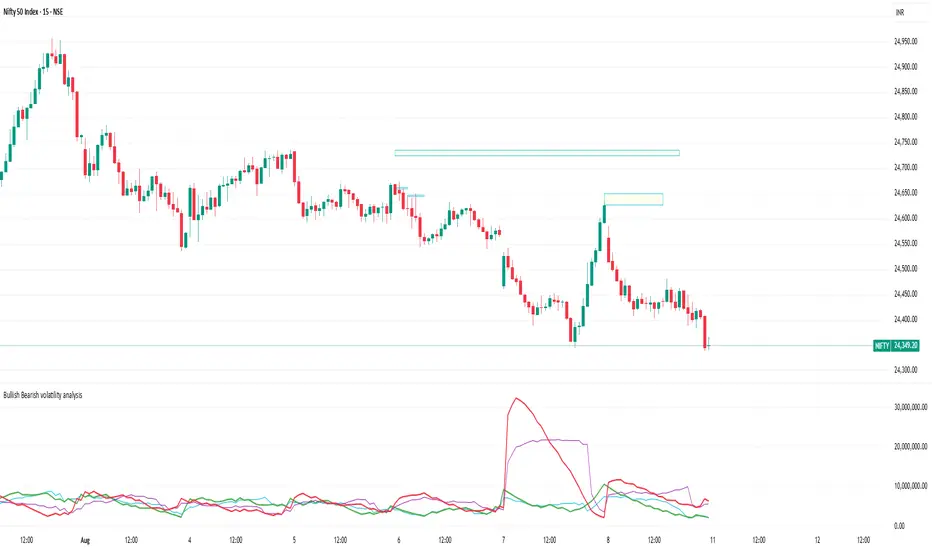
Bullish Bearish volatility analysisThis script is used to analyse Bullish/Bearish volatility direction based on volumes and moving average.
Volatility Visualizer by Oddbeaker LLCUse this to determine if a crypto pair has volatility suitable for your Oddbeaker Synthetic Miner. Draws entry/exit lines over the candles.
"Show me every place on the chart where I could have made X percent gains in Y days or less."
Inputs :
Percent Gain : Minimum percent gains to show on the chart.
Scan Bars : Maximum number of bars allowed to reach the profit target.
Notes :
Lines drawn on the chart indicate the entry and exit times and prices to reach the exact profit target.
The indicator only uses the low price of each candle to determine entry. It does not show every possible entry point.
When counting lines, count any group of lines that cross each other as one. Also, count any group of lines that do not cross but overlap in price over the same time period as one.
Tips :
For best results, set Percent Gain to double the amount of the sum of Min Profit and Min Stash on your Synth Miner. Example: If you have minProfit=5 and minStash=5, 5+5=10, so percentGain should be 20 on the chart.
Use a daily chart and set Scan Bars to 7 or less on highly volatile pairs.
Look for charts with the highest number of lines that don't overlap.
Use this indicator combined with the Synthetic Mining Channel for best results.
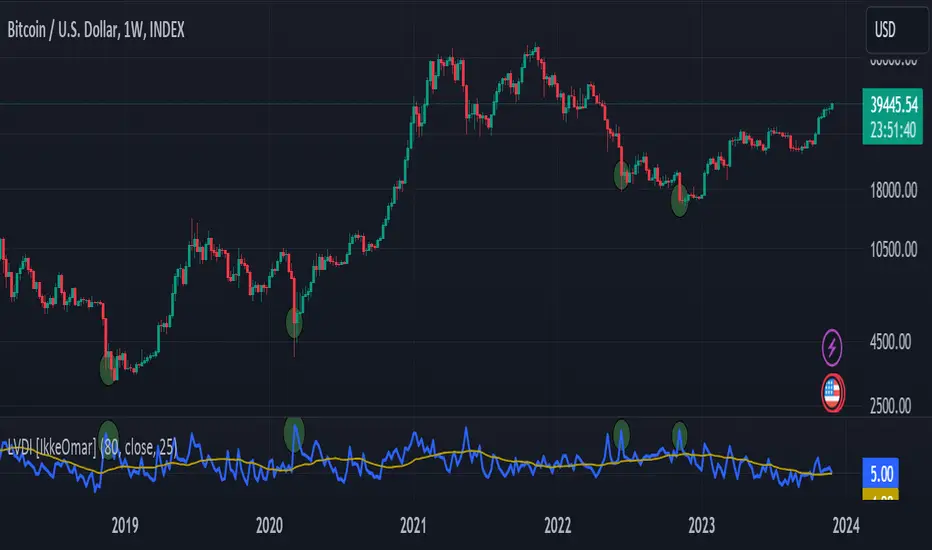
Logarithmic Volatility Direction Index [IkkeOmar]The LVDI is a Mean-Reversion Indicator. it doesn't detect trends and does not give a signal per se.
What it does is tell you if we have a flashcrash based on the price action and volume that is available. It is not always easy to see with the naked eye, so this indicator can help you DCA into an asset in a smarter way, if you couple it with other trend systems.
Think of this indicator like a form of a volatility index.
Inputs:
len and lenWMA are integers representing different lengths for calculations, and src is the data source
Keep in mind that "Length" is the lookback for the WMA, and the Length smooting is the lookback for the SMA of the "volume_weighted".
WMA Calculation
wma_basic = math.log10(ta.wma(src, len))
This calculates the logarithm (base 10) of the Weighted Moving Average (WMA) of the source data over len periods. WMA is a type of moving average giving more importance to recent data. The reason I use log10, is to make it transformative over a longer timeframe. This makes it easier to see the growth direction. I like to use this for crypto, since there is asymetric upside.
Volume Filter:
average_volume = ta.sma(volume, lenWMA)
volume_weighted = math.log10(wma_basic * (volume / math.log10(average_volume)))
Here, the script first calculates the Simple Moving Average (SMA) of the trading volume over lenWMA periods. Then, it computes a volume-weighted value of the WMA, adjusted by the logarithmic ratio of current volume to average volume.
Distance and Score Calculation:
distance = math.log10(src) - math.log10(volume_weighted)
score = math.sign(distance) * math.pow(math.abs(distance), 2)
The script calculates the logarithmic difference between the source data and the volume-weighted WMA. The score is determined by the sign of this distance multiplied by its square. This potentially amplifies the impact of larger distances.
Plotting:
plot(volume_weighted, title="Volume Weighted WMA", color=color.blue, linewidth = 2)
plot(ta.sma(volume_weighted, lenWMA), title="Volume Weighted WMA", color=color.rgb(189, 160, 0))
Mathematical concepts
Weighted Moving Average (WMA):
WMA is a moving average that assigns more weight to recent data points. The idea is that recent prices are more relevant to the current trend than older prices.
Logarithms:
The use of log10 (logarithm base 10) is interesting. Logarithms help in normalizing data and can make certain patterns more visible, especially when dealing with exponential growth or decay.
Volume Weighting:
Multiplying the WMA by the ratio of current volume to average volume (both logarithmic) integrates volume into the analysis. High trading volume can signify stronger market interest and can thus validate price movements.
Distance and Score:
The distance measures how far the current price is from the volume-weighted WMA on a logarithmic scale. The score squares this distance, potentially highlighting large divergences.
Case example
In the case above (which is a low timeframe that shouldn't be your main system) we see the blue line going up before going below the moving average line (orange). This indicates a local bottom zone. Does that mean that we wont go lower? No! What you can do is calculate a zone range.
We have an average line, you can get that from the POC with the VRVP.
Then you take the low and high of that zone and take the average:
(3.17% + 2.33%) / 2 = 2.75%
This means that we expect that the price can fall an additional 2.75%! Low and behold. When you check the same chart as above:
Hope it makes sense!
Stay safe everyone!
Don't hesitate to ask any questions if you have any!
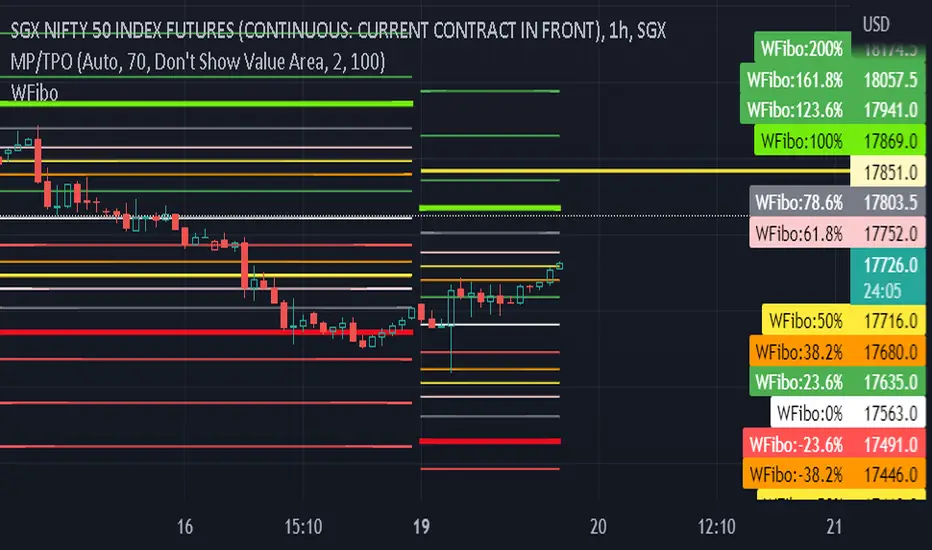
Fibonacci Ratios with Volatility(Weekly Time Frame.)Script is based on weekly time Frame. Fib ratios are drawn at the Open of the Market. Open price is compared with Previous week High , low and close. If weekly open is above Previous week high or low, Fib 0 % is plotted above High or the low as the case may be . If weekly open is between previous week high and low Fib 0% is equal to previous week Close and other fib ratios are plotted accordingly. As its vol based, works fantastically. This script is inspired by Fibonacci and Volatility script by PB GHOSH.
ATR and IV Volatility TableThis is a volatility tool designed to get the daily bottom and top values calculated using a daily ATR and IV values.
ATR values can be calculated directly, however for IV I recommend to take the values from external sources for the asset that you want to trade.
Regarding of the usage, I always recommend to go at the end of the previous close day of the candle(with replay function) or beginning of the daily open candle and get the expected values for movements.
For example for 26April for SPX, we have an ATR of 77 points and the close of the candle was 4296.
So based on ATR for 27 April our TOP is going to be 4296 + 77 , while our BOT is going to be 4296-77
At the same time lets assume the IV for today is going to be around 25% -> this is translated to 25 / (sqrt (252)) = 1.57 aprox
So based on IV our TOP is going to be 4296 + 4296 * 0.0157 , while our BOT is going to be 4296 - 4296 * 0.0157
I found out from my calculations that 80-85% of the times these bot and top points act as an amazing support and resistence points for day trading, so I fully recommend you to start including them into your analysis.
If you have any questions let me know !

BitMEX BTC Volatility IndexThis indicator displays the BitMEX BTC Volatility Index ( BVOL24H ) as an indicator and it can be compared to the VIX of the cryptocurrencies.
more information about how BVOL24H is calculated can be found here: www.bitmex.com
Symbol can be changed in the parameters

Previous Earnings Volatility v1 by RMThis study checks previous Stock trends (volatility) before Earnings announcements. This indicator is used to gauge the stock personality before earnings. Some are consistently better than others.
The range to be analysed before earnings is modified in "Candles before EA to plot Trend" , and the total period under study (how many Earnings periods) is set by "Date From" and "Date To" parameters.
The indicator shows closing values for the periods analysed and presents a tables with the summary, how many are up and down.
Used part of this code as published by @PineCoders and Public Library, This script is based on previous work from several people like Sushil Kothawade and other open source coders:
in.tradingview.com
Disclaimer: This is not a Financial advisory tool. For education purposes only. * Use at your own risk *

Percentage Volume VolatilityI was looking for a script similar to ATR that would show percentage point volatility relative to current price. It's way easier to compare 2 different tickers, with similar entry conditions, and judge witch one has bigger gains predisposition than calculating everything with just ATR value.
Unfortunately I haven't found any, so there is one I've composed out of ATR and VWAP. First choice is self explanatory, the VWAP on the other choice in my opinion shows more faithful average price than SMAs or EMAs. Feel free to adjust the script if You feel like it.
Cheers - Mizer.

Realized Volatility (annualized for any time frame)Plots standard deviation of returns (realized volatility), and annualizes it for the selected timeframe. Suitable for forex/cryptocurrencies which trade 24/7.
