Multi-Timeframe Volatility ATR - [by Oberlunar]This script (for now in beta release) is specifically designed for scalping or traders operating on lower timeframes (if you are in a timeframe of one minute wait one minute to collect statistics). Its primary purpose is to provide detailed insights into market volatility by calculating the ATR (Average True Range) and its percentage changes, allowing traders to quickly identify shifts in market conditions.
The ATR is calculated across six user-defined timeframes, which can include very short intervals such as 5 or 15 seconds. This setup enables real-time monitoring of volatility, which is critical for scalping strategies. The script collects a rolling history of the last five ATR values for each timeframe. These historical values are used to calculate percentage changes by comparing the current ATR with the oldest value in the history, offering a clear view of how volatility is evolving over time.
Percentage changes are displayed dynamically in a table, with color-coded feedback to indicate the direction of the change: green for increases, red for decreases, and gray for stability or insufficient data. This visual representation makes it easy to spot whether market volatility is rising or falling at a glance.
By progressively collecting data, the script becomes increasingly effective as more ATR values are accumulated. This functionality is especially useful for traders on lower timeframes, where rapid changes in volatility can signal breakout opportunities or shifts in market dynamics.
Soon I will update personalized ATR parameters, and lookback strategies for statistics.
Cerca negli script per "Volatility"

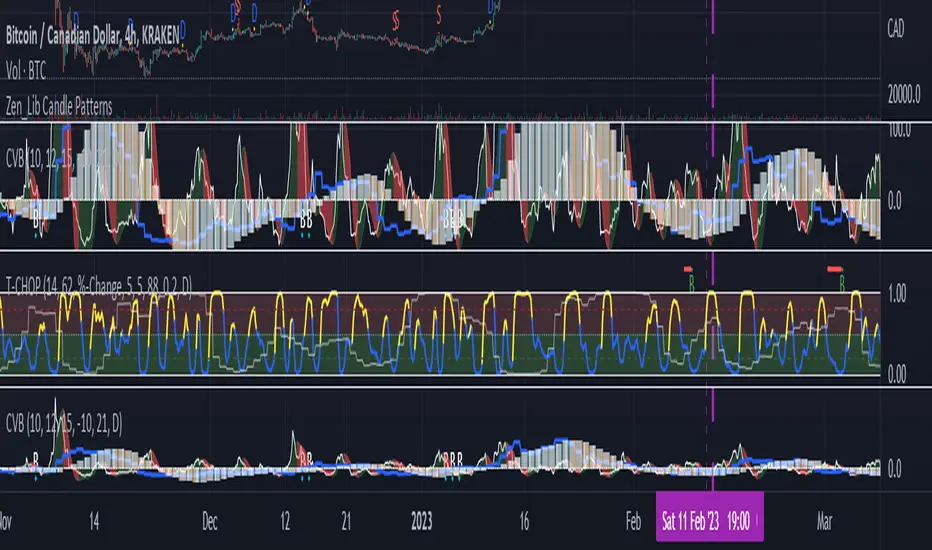
Breadth of Volatility The Breadth of Volatility (BoV) is an indicator designed to help traders understand the activity and volatility of the market. It focuses on analyzing how fast prices are moving and how much trading volume is driving those movements. By combining these two factors—price speed and volume strength—the BoV provides a single value that reflects the current level of market activity. This can help traders identify when the market is particularly active or calm, which is useful for planning trading strategies.
The speed component of the BoV measures how quickly prices are moving compared to their recent average. This is done by using a metric called the Average True Range (ATR), which calculates the typical size of price movements over a specific period. The BoV compares the current price change to this average, showing whether the market is moving faster or slower than usual. Faster price movements generally indicate higher volatility, which might signal opportunities for active traders.
The strength component focuses on the role of trading volume in price changes. It multiplies the trading volume by the size of the price movement to create a value called volume strength. This value is then compared to the highest volume strength seen over a recent period, which helps gauge whether the current price action is being strongly supported by trading activity. When the strength value is high, it suggests that market participants are actively trading and supporting the price movement.
These two components—speed and strength—are averaged to calculate the Breadth of Volatility value. While the formula also includes a placeholder for a third component (related to fundamental analysis), it is currently inactive and does not influence the final value. The BoV is displayed as a line on a chart, with a zero line for reference. Positive BoV values indicate heightened market activity and volatility, while values near zero suggest a quieter market. This indicator is particularly helpful for new traders to monitor market conditions and adjust their strategies accordingly, whether they’re focusing on trend-following or waiting for calmer periods for more conservative trades.
Important Notice:
Trading financial markets involves significant risk and may not be suitable for all investors. The use of technical indicators like this one does not guarantee profitable results. This indicator should not be used as a standalone analysis tool. It is essential to combine it with other forms of analysis, such as fundamental analysis, risk management strategies, and awareness of current market conditions. Always conduct thorough research or consult with a qualified financial advisor before making trading decisions. Past performance is not indicative of future results.
Disclaimer:
Trading financial instruments involves substantial risk and may not be suitable for all investors. Past performance is not indicative of future results. This indicator is provided for informational and educational purposes only and should not be considered investment advice. Always conduct your own research and consult with a licensed financial professional before making any trading decisions.
Note: The effectiveness of any technical indicator can vary based on market conditions and individual trading styles. It's crucial to test indicators thoroughly using historical data and possibly paper trading before applying them in live trading scenarios.

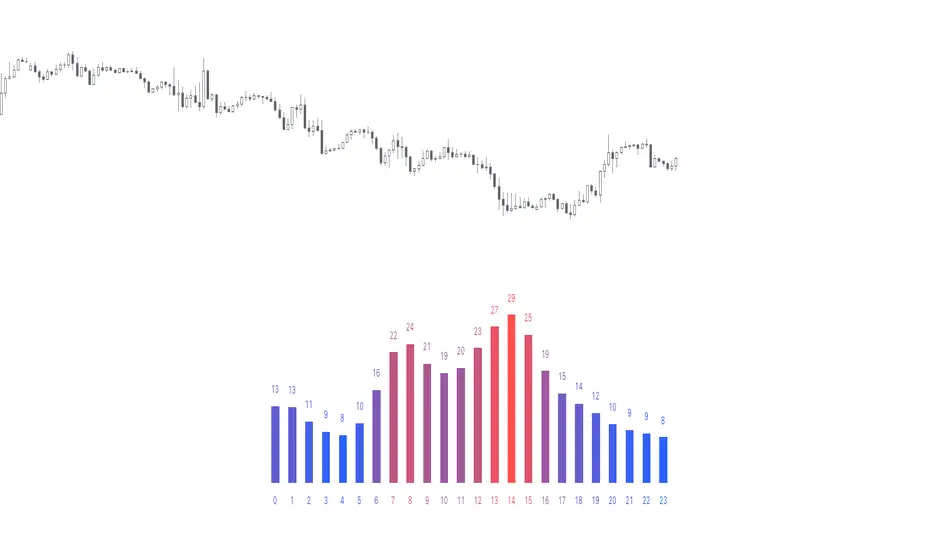
Time of Day - Volatility Report█ OVERVIEW
The indicator analyses the volatility and reports statistics by the time of day.
█ CONCEPTS
Around the world and at various times, different market participants get involved in the markets. How does this affect the market?
Knowing this gets you better prepared and improves your trading. Here are some ideas to explore:
When is the market busy and quiet?
What time is it the most volatile?
Which pairs in your watchlist are moving while you are actively trading?
Should you adjust your trading time? Should you change your trading pairs?
When does your strategy perform the best?
What entry times do your winners have in common? What about the exit times of your losers?
Is it worth keeping your trade open overnight?
Bitcoin (UTC+0)
Gold (UTC+0)
Tesla, Inc. (UTC+0)
█ FEATURES
Selectable time zones
Display the statistics in your geographical time zone (or other market participants), the exchange time zone, or UTC+0.
Configurable outputs
Output the report statistics as mean or median.
█ HOW TO USE
Plot the indicator and visit the 1H timeframe.
█ NOTES
Gaps
The indicator includes the volatility from gaps.
Calculation
The statistics are not reported from absolute prices (does not favor trending markets) nor percentage prices (does not depict the different periods of volatility that markets can go through). Instead, the script uses the prices relative to the average range of previous days (daily ATR).
Extended trading session
The script analyses extended hours when activated on the chart.
Daylight Saving Time (DST)
The exchange time or geographical time zone selected may observe Daylight Saving Time. For example, NASDAQ:TSLA always opens at 9:30 AM New York time but may see different opening times in another part of the globe (New York time corresponds to UTC-4 and UTC-5 during the year).
Artharjan INDIA VIX v/s Nifty Volatility DashboardHi,
I have created Artharjan INDIA VIX v/s Nifty Volatility Dashboard to forecast the Annual, Quarterly, Monthly, Weekly, Daily and Hourly Volatility of NIFTY Benchmark Index based on current value of INDIA VIX. This will help Index Options Sellers to decide the range of Nifty for the given period based on current level of volatility indicated by INDIA VIX.
Options Sellers may make use of the Min Range and Max Range values for the Strike Price Selection.
Regards
Rahul Desai
@Artharjan

Squeeze Momentum + Volatility [LeonidasCrypto]Based on Squeeze Momentum indicator by LazyBear
This custom version of SQ is part of my Trading System.
How to use it.
Please read the description of the original author of this indicator here.
Volatility .
When the market is contracting or sideways usually you will see red or blue dots.
Blue dots. the market is in sideways and the volatility is low.
Red dots. the market is in the climax of volatility usually after of a big move this is a potential signal the peak of the move is near.
I added volatility to SQ because I consider volatility is a key factor for trading to anticipate the moves.

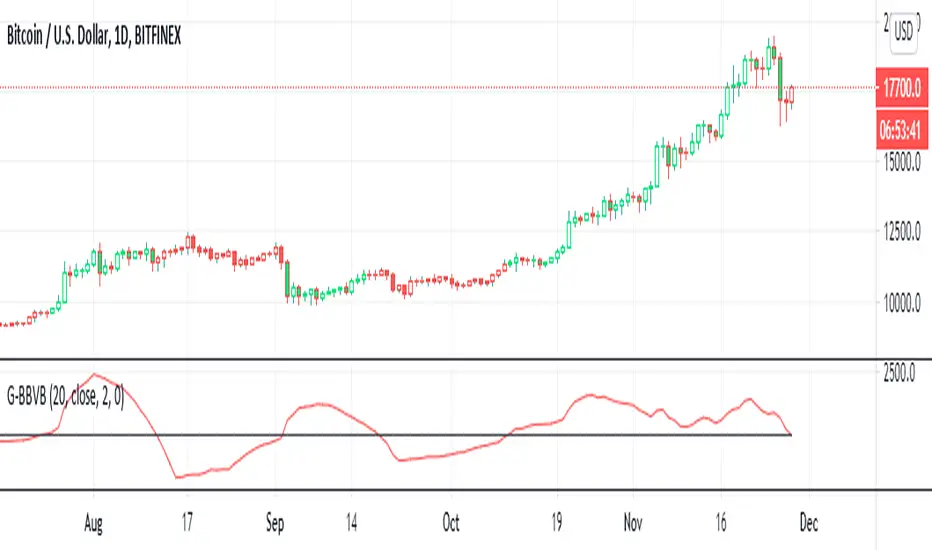
G-Bollinger bands volatility breakout v.1This is my frist publish scrpit. I developed this indicator origin is BB. It make from easy idea but powerful for sideway to breakout
1. I findout volatility by upper band of BB - lower band of BB (I called "Aline")
2. I created SMA of Aline (I called Bline)
3. I created the special line is "Cline" from Aline - Bline
4. I created 0 line " Baseline "
G-BBvB is the very good indicator to detect low volatility to begin the volatility = Buy signal
Now I can't find the sell signal form indicator. I try backtest sell at Cline cross zeroline but it not work.
I'll develop "G" indicator for free .
Goodluck :D
Relative Candle Volatility IndexI am not certain if something similar is already available out there. However, here's my own implementation of my simple idea of using the length of the candle-body, or wicks (high-low), to derive a Relative Volatility Index / Oscillator.
In summary: When the R.CVI is significantly positive, it indicates a sudden increase in volatility; whereas, when the R.CVI drops significantly negative, it indicates a sudden decrease in volatility -- in relative to the (just prior) market trend.
If you do wish to copy, modify, and publish an alternate version base on this script, please do not plagiarize and kindly reference/link back to this original script. =D
~ * ~ * ~ * ~ * ~ * ~ * ~ * ~ * ~ * ~ * ~ * ~ * ~ * ~ * ~ * ~ * ~ * ~ * ~ * ~ * ~
Note:
In no way is this intended as a financial/investment/trading advice. You are responsible for your own investment decisions and trades.
Please exercise your own judgement for your own trades base on your own risk-aversion level and goals as an investor or a trader. The use of OTHER indicators and analysis in conjunction (tailored to your own style of investing/trading) will help improve confidence of your analysis, for you to determine your own trade decisions.
~ * ~ * ~ * ~ * ~ * ~ * ~ * ~ * ~ * ~ * ~ * ~ * ~ * ~ * ~ * ~ * ~ * ~ * ~ * ~ * ~
Please check out my other indicators sets and series, e.g.
LIVIDITIUM (dynamic levels),
AEONDRIFT (multi-levels standard deviation bands),
FUSIONGAPS (MA based oscillators),
MAJESTIC (Momentum/Acceleration/Jerk Oscillators),
PRISM (pSAR based oscillator, with RSI/StochRSI as well as Momentum/Acceleration/Jerk indicators),
PDF (parabolic SAR /w HighLow Trends Indicator/Bar-color-marking + Dynamic Fib Retrace and Extension Level)
and more to come.
Constructive feedback and suggestions are welcome.
~ JuniAiko
(=^~^=)v~

@WACC Volatility Weighted PUT/CALL Positions [SPX]This indicator is based on Volatility and Market Sentiment. When volatility is high, and market sentiment is positive, the indicator is in a low or 'buy state'. When volatility is low and market sentiment is poor, the indicator is high.
The indicator uses the VIX as it's volatility input.
The indicator uses the spread between the Call Volume on SPX/SPY and the Put Volume.
This is pulled from CVSPX and PVSPX.
When volatility and put/call reaches a critical level, such as the levels present in a crisis or a sell off, the line will be green. See Sept 2015, 2008, and Feb 2018.
This level can be edited in the source code.
As the indicator is based on Put/Call, the indicator works best on larger time frames as the put/call ratio becomes a more discernible measure of sentiment over time.

Relative Volatility IndexCorrected Relative Volatility Index. This indicator was originally developed by Donald Dorsey (Stocks & Commodities V.11:6 (253-256): The Relative Volatility Index).
The indicator was revised by Dorsey in 1995 (Stocks & Commodities V.13:09 (388-391): Refining the Relative Volatility Index).
I suggest the refined RVI with optional settings. If you disabled Wilder's Smoothing and Refined RVI you will get the original version of RVI (1993, as built-in).
Also, you can choose an algorithm for calculating Standard Deviation.

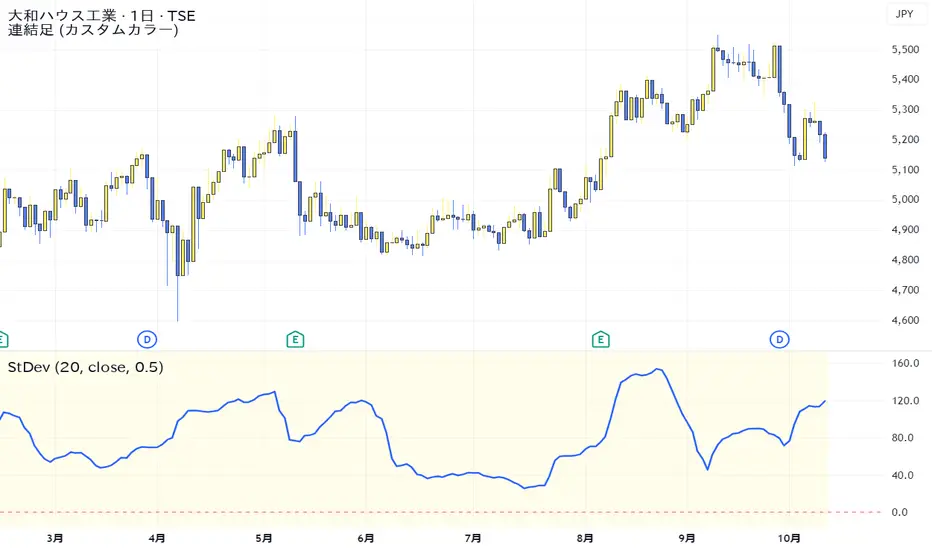
Standard Deviation VolatilityThe Standard Deviation (StDev) measures the volatility or dispersion of price from its historical average. Higher values suggest greater price fluctuation and potentially a trending market. Lower values indicate lower volatility, often found during consolidation or ranging markets.
標準偏差(Standard Deviation)は、価格の過去の平均からの**ばらつき(ボラティリティ)**を測る指標です。値が高いほど価格変動が激しく、トレンド相場であることを示唆します。値が低いほど、レンジ相場または保ち合いであることを示します。
Smart Volatility Squeeze + Trend Filter📌 Purpose
This indicator detects volatility squeeze conditions when Bollinger Bands contract inside Keltner Channels and signals potential breakout opportunities.
It also includes an optional EMA-based trend filter to align signals with the dominant market direction.
🧠 How It Works
1. Squeeze Condition
Bollinger Bands (BB): Length = 20, StdDev = 2.0 (default)
Keltner Channels (KC): EMA Length = 20, ATR Multiplier = 1.5 (default)
Squeeze ON: Occurs when BB Upper < KC Upper and BB Lower > KC Lower (low volatility zone).
2. Breakout Signals
Long Breakout: Price crosses above BB Upper after squeeze.
Short Breakout: Price crosses below BB Lower after squeeze.
3. Trend Filter (optional)
EMA(50) used to confirm breakout direction:
Long signals allowed only if price > EMA(50)
Short signals allowed only if price < EMA(50)
Toggle Use Trend Filter to enable/disable.
4. Visual & Alerts
Green circle at chart bottom indicates Squeeze ON.
Green/Red triangles mark breakouts.
Background gradually brightens during squeeze buildup.
Alerts available for long and short breakouts.
📈 How to Use
Look for Squeeze ON → then wait for breakout arrows.
Trade in breakout direction, preferably with trend filter ON.
Works best on higher timeframes (1h, 4h, D) and trending markets.
Markets: Crypto, Forex, Stocks — effective in volatile assets.
⚙️ Inputs
BB Length / StdDev
KC EMA Length / ATR Multiplier
Use Trend Filter
Trend EMA Length
⚠️ Disclaimer
This script is for educational purposes only. It does not constitute financial advice.
Always test thoroughly before live trading.

Symbol vs Benchmark Performance & Volatility TableThis tool puts the current symbol’s performance and volatility side-by-side with any benchmark —NASDAQ, S&P 500, NIFTY or a custom index of your choice.
A quick glance shows whether the stock is outperforming, lagging, or just moving with the market.
⸻
Features
• ✅ Returns over 1W, 1M, 3M, 6M, 12M
• 🔄 Benchmark comparison with optional difference row
• ⚡ Volatility snapshot (20D, 60D, or 252D)
• 🎛️ Fully customizable:
• Show/hide rows and timeframes
• Switch between default or custom benchmarks
• Pick position, size, and colors
Built to answer a simple, everyday question — “How’s this really doing compared to the broader market?”
Thanks to @BeeHolder, whose performance table originally inspired this.
Hope it makes your analysis a little easier and quicker.

Market Volatility Key: CHOP, ATR, VIX & 10Y BondThis script builds upon existing market analysis tools by providing a comprehensive dashboard that combines the Choppiness Index (CHOP), Average True Range (ATR) with a user-selectable timeframe, VIX (Volatility Index), and the 10-year US Treasury bond price in a compact tile format. The color-coded key provides quick visual cues for market conditions—highlighting whether the market is trending or consolidating—allowing traders to make informed decisions quickly.
For example, when trading the Nasdaq (NQ), you might use this indicator to help manage your scalping trades. If you trade on a 10-minute chart but set the ATR timeframe to 1 minute, it helps identify whether there is enough price movement to justify entering a trade. If the ATR is less than 10, it suggests there's not enough range for scalping opportunities, and you may choose to stay out of the trade.
This expanded indicator integrates and enhances existing concepts to deliver a well-rounded view of volatility, trend strength, and market conditions all in one glance, making it an essential tool for both trend-following and scalping strategies.

Zero-lag Volatility-Breakout EMA Trend StrategyThis is a simple volatility-breakout strategy which uses the difference in two different zero-lag* EMAs (explained below on what exactly I mean by this) to track the upwards or downwards strength of an instrument. When the difference breaks above a Bollinger Band of a configurable standard deviation multiple, the strategy enters based off the direction of the base EMA used (i.e. if the difference breaks above and the current EMA is rising, a long entry is produced. If the difference breaks above and the current EMA is falling, a short entry is produced).
The two EMA-type metrics used to calculate the volatility difference are calculated by the following formula:
top_ema = math.max(src, ta.ema(src, length))
bottom_ema = math.min(src, ta.ema(src, length))
ema_difference = (top_ema - bottom_ema) - 1
This produces a difference which responds immediately to large price movements, instead of lagging if it used strictly the EMA itself.
SETTINGS
Source : The source of the strategy - close, hlc3, another indicator plot, etc.
EMA Difference Length : The length of both the EMA difference statistics and the base EMA used to calculate the entry side.
Standard Deviation Multiple : The Bollinger Bands multiple used when the difference is breaking out.
Use Binary Strategy : The strategy has two configurations: Binary and Rapid-Exit. 'Binary' means that it will not close a long position until a short position is generated, and vice-versa. 'Rapid-Exit' will close a long or short position once the difference reaches the middle Bollinger Band MA. This means that turning on 'Binary' will expose you to more market risk, but potentially greater market return. Turning off 'Binary' will exit quickly and reduce drawdown.
The strategy results below use 10% equity and 0.1% fees per trade.

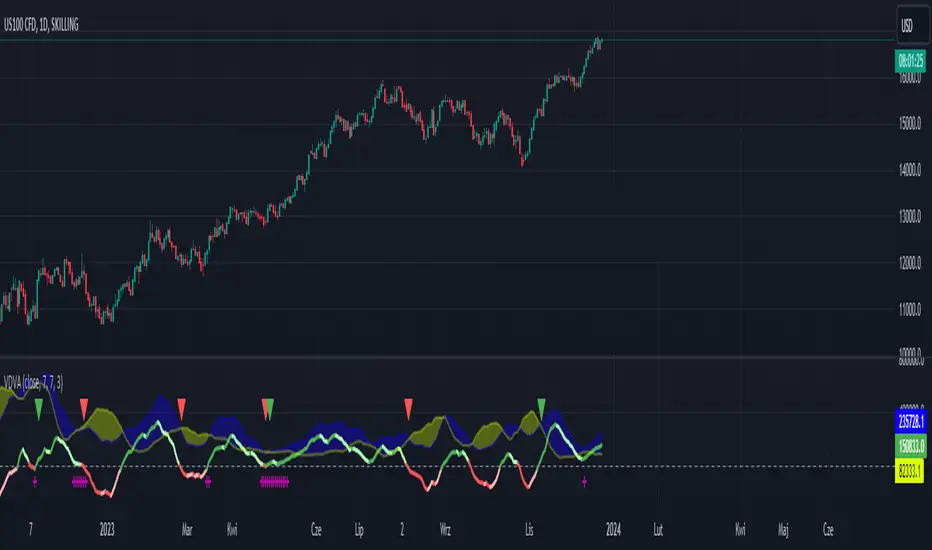
VDVA - Volume Delta Volatility AmplifierThis script defines an indicator named VDVA (Volume Delta Volatility Amplifier), which combines volume delta (the difference between volume up and volume down) and volatility (ATR) into one line. This line is then smoothed using a moving average and compared with the zero level and a shorter-period moving average. The script also plots shapes when the rate of change of the line exceeds the first standard deviation. Moreover, the script uses Bollinger Bands and Keltner Channels to determine the squeeze condition, which is a signal of a potential breakout. Finally, the script plots two bar charts that show the volume up and volume down multiplied by ATR.
dark green line - bullish
light green line - potential bearish
dark red line - bearish
light red line - potential bullish
blue cloud - bullish
yellow cloud - bearish
red triangle - bearish entry
green triangle - bullish entry
purple cross - squeeze
JZ_Chaikin HTF Volatility BreakoutFirst off, all credit to Harry Potter as this is a minor customization of his indicator.
Basic additions:
-- Added a Higher Timeframe that is set to Daily but can be changed. Timeframe does wait until barstate.isconfirmed so won't repaint.
-- Added HMA smoothing line to both Chart and HTF. Can be used as it's own signal, as confirmation or in combination with faster signal line -- Breakout signal & Range Highlight use both.
-- Added optional coloring of HMA based on whether increasing or decreasing.
-- Added a low volatility option that highlights Range/No Trade zones. Defval is off so needs to be selected from inputs.
Breakout Signals are very simple and both take the HTF signal and HMA. When the faster Volatility line rises from below zero and comes within the range of -10 to 0, AND the HMA signals is increasing (and also below zero) for confirmation, generates a breakout signal of an incoming big move. You can alter the breakout threshold to be greater or less than -10, I just found that works best for filtering out the noise and false signals. Won't catch everything, but pretty reliable when it does.
Tested mostly on BTC so can't vouch for other assets and would likely need modification.
I've JUST taught myself coding from scratch (and to say I'm an amateur is an understatement), so apologies in advance if anything is unclear or could be coded better. Open to any suggestions.
Heikin Ashi Volatility Percentile - TraderHalaiThe Heikin Ashi Volatility Percentile (HAVP) Oscillator was inspired by the legendary Bollinger Band Width Percentile indicator(known as BBWP), written by Caretaker, and made famous by Eric Krown, a famous influencer.
This script borrows aspects of the BBWP indicator which enables the HAVP oscillator to visually match the look and feel of BBWP and allows similar configuration functions (such as colouring function, smoothing MAs and alerts)
The fundamentals of this script are however different to BBWP. Instead of Bollinger band width, this script uses a reverse function of Heikin Ashi close (implemented in my Smoothed Heikin Ashi Trend
indicator, linked below).
The reverse Heikin Ashi close is smoothed using Ehler's SuperSmoother function, providing smooth oscillation and earlier signals of volatility tops and bottoms.
From an automated backtest that I have conducted on the BTCUSD index pair, I have observed comparable performance to BBWP across multiple timeframes when combining with stochastic direction to give a bias on overall direction. Using parameters I have tested, it performs better on mid-term timeframes such as 3h,4h and 6h. BBWP outperforms on 1h and 1d, with lower timeframes being comparable.
From the results, using HAVP over BBWP tends to result in reduced holding time and more frequent trades, which may or may not be desirable, although the behaviour can be adjusted using the parameters provided.
For instance, the smoother oscillation provided by HAVP provides a great predictability factor and earlier confirmation signals, which is something that Ehler emphasised in his trading style, and something which I agree with personally. I would encourage you to try out both HAVP and BBWP and see which fits your trading style.
Releasing this as open source allows for the betterment of the community and further development, criticism and discussion.
Thanks and enjoy! :)

Cryptogrithm's Secret Momentum and Volatility IndicatorThis indicator is hard-coded for Bitcoin, but you may try it on other asset classes/coins. I have not updated this indicator in over 3 years, but it seems to still work very well for Bitcoin.
This indicator is NOT for beginners and is directed towards intermediate/advanced traders with a sensibility to agree/disagree with what this indicator is signalling (common sense).
This indicator was developed back in 2018 and I has not been maintained since, which is the reason why I am releasing it. (It still works great though! At the time of this writing of May 2022).
How to use:
Terms:
PA (Price Action): Literally the candlestick formations on your chart (and the trend formation). If you don't know how to read and understand price action, I will make a fast-track video/guide on this later (but in the meanwhile, you need to begin by learning Order-Flow Analysis, please google it first before asking).
CG Level (Cryptogrithm Level/Yellow Line): PA level above = bullish, PA level below = bearish
CG Bands (Cryptogrithm Bands): This is similar to how bollingers work, you can use this the same was as bollinger bands. The only difference is that the CG bands are more strict with the upper and lower levels as it uses different calculations to hug the price tighter allowing it to be more reactive to drastic price changes (earlier signals for oversold/overbought).
CG Upper Band (Red Upper Line): Above this upper bound line means overbought.
CG Middle Band (Light Blue Line): If PA trades above this line, the current PA trend is bullish continuing in the uptrend. If PA trades below this line, the current PA trend is bearish continuing in the downtrend. This band should only be used for short-term trends.
CG Lower Band (Green Lower Line): Below this lower bound line means oversold.
What the CG Level (yellow line) tells you:
PA is trading above CG Level = Bullish
PA is trading below CG Level = Bearish
Distance between CG Level and price = Momentum
What this means is that the further away the price is from the CG Level, the greater the momentum of the current PA trend. An increasing gap between the CG Level and PA indicates the price's strength (momentum) towards the current upward/downward trend. Basically when the PA and CG Level diverge, it means that the momentum is increasing in the current trend and when they converge, the current trend is losing momentum and the direction of the PA trend may flip towards the other direction (momentum flip).
PA+CG Level Momentum:
To use the CG Level as a momentum indicator, you need to pay attention to how the price and the CG level are moving away/closer from each other:
PA + CG Level Diverges = Momentum Increasing
PA + CG Level Converges = Momentum Decreasing
Examples (kind of common sense, but just for clarity):
Case 1: Bullish Divergence (Bullish): The PA is ABOVE and trending AWAY above from the CG Level = very bullish, this means that momentum is increasing towards the upside and larger moves will come (increasing gap between the price and CG Level)
Case 2: Bearish Convergence (Bearish): - The PA is ABOVE the CG Level and trending TOWARDS the CG Level = bearish, there is a possibility that the upward trend is ending. Look to start closing off long positions until case 1 (divergence) occurs again.
Case 3: Neutral - The PA is trading on the CG Level (no clear divergence or convergence between the PA and CG Level) = Indicates a back and forth (tug of war) between bears and bulls. Beware of choppy price patterns as the trend is undecisive until either supply/liquidity is dried out and a winner between bull/bear is chosen. This is a no trade zone, but do as you wish.
Case 4: Bearish Divergence (Bearish): The PA is BELOW and trending AWAY BELOW from the CG Level = very bearish, this means that momentum is increasing towards the downside and larger downward moves will come (increasing gap between the price and CG Level).
Case 5: Bullish Convergence (Bullish): - The PA is BELOW the CG Level and trending TOWARDS the CG Level = bullish, there is a possibility that the downward trend is ending and a trend flip is occuring. Look to start closing off short positions until case 4 (divergence) occurs again.
CG Bands + CG Level: You can use the CG bands instead of the PA candles to get a cleaner interpretation of reading the momentum. I won't go into detail as this is pretty self-explanatory. It is the same explanation as PA+CG Level Momentum, but you are replacing the PA candles with the CG Bands for interpretation. So instead of the PA converging/diverging from the CG Level, the Upper and Lower Bound levels are converging/diverging from the CG level instead.
Convergence: CG Level (yellow line) trades inside the CG bands
Divergence: CG Level (yellow line) trades outside the CG bands
Bullish/Bearish depends on whether the CG Band is trading below or above the CG level. If CG Band is above the CG Level, this is bullish. If CG Band is below the CG level, this is bearish.
Crosses (PA or CG Band crosses with CG level): This typically indicates volatility is incoming.
There are MANY MANY MANY other ways to use this indicator that is not explained here and even other undiscovered methods. Use some common sense as to how this indicator works (it is a momentum indicator and volatility predictor). You can get pretty creative and apply your own methods / knowledge to it and look for patterns that occur. Feel free to comment and share what you came up with!

Directional Volatility and VolumeAn oscillator that manages to display the direction of volatility and volume in a single indicator. This allows viewing the trend in concert with the volume strength. Thus a trader can check if the price movement has volatility and volume behind it or not.

Action Section, Volatility Choppiness Indicator (by ChartArt)Here is a solution to find entry points to trade. This indicator highlights price sections with low choppiness, where both the ADX (Average Directional Index) indicator shows strong movement (up or down!) in the price and a customized Money Flow indicator (which uses only the change of the volume not the change of the price, hence a Volume Flow indicator), also shows volatility is present. Using higher filter values than the default setting of "30" reduces the noise, but also shows less 'action sections'. Vice versa using values lower than "30" increases the amount and duration of action sections which are shown.
The "action section" indicator does not show the direction if the price is going up or down. It shows if there is enough action worthy the time to trade (lower odds of a neutral sideways trend). Therefore in addition a Heikin-Ashi based price change indicator can optionally be plotted, which shows the actual direction of the price.
Action Section, High Volume Volatility & Low Price Choppiness Indicator
This indicator works only on charts which have volume data.

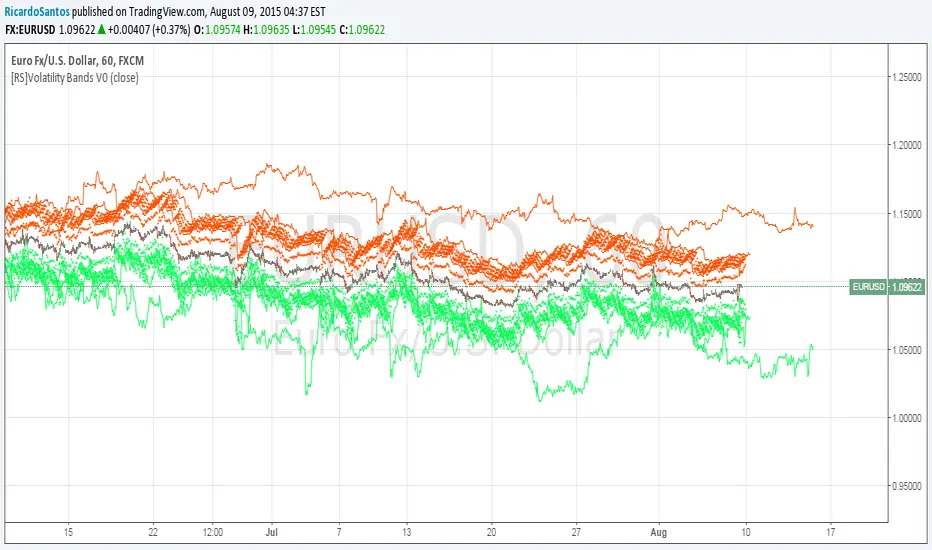
[RS]Volatility Bands V0EXPERIMENTAL:
Displays Volatility Cycles and forecasts maximum volatility expectancy for a predetermined time frame.
ATR Safe/Danger Volatility FilterATR Safe/Danger Volatility Filter colour coded on 50 ema red to show spikes
Harry Dunn Volatility BandsEnter strike price and 2 percentage numbers to automatically calculate and draw volatility bands on chart.
