Multi-Exchange Volume (30 Tickers) by kurtsmock + BV + rVolauthor: kurtsmock
Fully Customizable ticker set. Up to 30 Tickers. Bitcoin set as default.
-- IMPORTANT NOTE: --
30 Exchanges are a lot. It can take a while to load. You can fully customize this indicator to your liking. Here's how:
1. Load indicator
2. Open Settings
3. Uncheck the switch box for exchanges you want unincluded
4. At the bottom of the settings menu click "Defaults" and hit "Save as Default"
5. To turn them all back on, hit "Reset Settings" in that same "Defaults" menu and click "Save as Default" again.
Also, you don't have to use this with Bitcoin. This works with any asset, just change the ticker in the settings.
There's a lot going on with this indicator so the following is descriptions and instructions to help you better understand what's going on here. Thanks!
Goal:
- To provide a mechanism for assets on multiple exchanges to have their volume evaluated together
Edge:
- Having better and more complete volume information
Notes:
- The Default Exchanges for this indicator are highest volume bitcoin exchanges, but may contain "fake volume"
- Indicator is set for Bitcoin by default. However, you can change the tickers to reflect any asset you want
////// rVol //////
Goal:
- To understand how much volume is being executed relative to the same candle on previous days/periods
Edge:
- Higher rVol implies higher volatility and market interest.
- High rVol = higher than average volume . Markets move on volume so higher than average volume indicates increased market activity/volatility
- rVol is an indirect measure of active or anticipated volatility
Definitions:
- rVol: The volume of a period compared to the Average Volume of that same period in past sessions
- Important to note it does NOT add up the last 10 (default) candles, but rather the last 10 candles at session intervals.
- Example:
-- On a Tuesday, 1h chart it will add up the last ten Tuesday, 9:00 am candles, not including the current, active candle.
-- It then averages those lookback candles.
-- It then plots the percentage relationship between the most recent candle and the average of the lookback candles
-- Avg Vol of Lookback candles = 5000,
-- Volume of most recent candle = 4000: Output = rVol = 80:
-- Volume of most recent candle was 80% of the average volume in the 9 am time period of the last ten Tuesdays in the 9 am, 1h period
Notes:
- rVol does not add current candle volume into lookback sum. So, you set lookback to be: (not including the current day)
- rVol is on a switch. So, if you want to see rVol instead of volume, hit the switch in the settings
- If you want to see both, load 2 instances of the indicator.
////// Better-er Volume //////
Goal:
To Identify:
- When a candle closes at the highest volume * range relative to the lookback period and close > open
- When a candle closes at the highest volume * range relative to the lookback period and close < open
- When a candle closes at the highest volume / price relative to the lookback period
Edge:
- Identifies beginnings of price expansion, climax of price expansion, breakouts, pivots, and take profit points on the volume chart
Notes:
- Based generally on Barry Taylor's "Better Volume" indicator and ideas from Pascal Willain's book "Value in Time."
- Better-er Volume rules are applied to both Total Volume or rVol.
-- When rVol is displayed Better-er Volume is applied to rVol
-- When Total Volume is displayed Better-er Volume is applied to Total Volume
// Plot Key: //
Green Triangle Up = Often marks the beginning and/or end of price expansion to the upside
Red Triangle Up = Often marks the beginning and/or end of price expansion to the downside
Yellow Square = High Volume but Tight Range. Implies a Battle of Bulls and Bears. High Liquidity area. Provided Liquidity is not enough to move price. Thick Limit Order Book.
Purple Triangle Up or Down = Implies high market participation. Typically at the end of expansion when very significant s/r is hit
category: volume Volatility
tags: Volume rVol relativevolume Bitcoin cryptocurrency bettervolume
Many More Volume Indicators Coming Out Soon!
Cerca negli script per "Volatility"

Squeeze PRO Arrows [Makit0]SQUEEZE PRO INDICATOR v0.5Beta
Script based in:
original John Carter's ideas (SQUEEZE & SQUEEZE PRO)
LazyBear's script (Squeeze Momentum Indicator)
USE IT IN CONJUNCTION WITH THE SQUEEZE PRO INDICATOR
This system is based in the volatility reversion to the mean: volatility contraction leads to volatility expansion and the other way on
The arrows signal is a warning of volatility compression, more often than not this leads to a expansion of volatility and a move in the action price usually bigger than the expected move
Be aware of the trend direction don't take the arrows direction as certanty, use instead the momentum histogram in the Squeeze PRO Indicator to see the slope direction
By default the arrows are setted at 5 dots, they fire in the sixth dot after 5 dots of the same color. Try differents values to get more or less signals
here are 3 levels of compression:
Level 1: ORANGE, the lesser compresion level
Level 2: RED, the normal level marked by the original squeeze indicator
Level 3: YELLOW, the max compression level
The more the compression the bigger the after move
Simple and Exponential Moving Averages
There are 2 groups of Moving Averages within the indicator, the 8 & 21 EMAs and the 50, 100 & 200 SMAs
They are disabled by default, turn it on at your peace
Please check the John Carter's book (Mastering the Trade) and attend his webinars for more insight about the squeeze & squeeze pro systems
I'm starting at trading and learning every day, I attended one of his webinars about the Squeeze Pro, and with help of the LazyBear's Squeeze Momentum Indicator code up the Squeeze PRO.
Please be aware, I'm not an expert trader, only a developer with an idea: learn to pull out money from the market in a consistent way.
This is a Beta version, please feel free to comment and give feedback, anything you consider iteresting, the more you elaborate the better :D
Thanks you all!!!

HV ID/ND4 BreakoutThis indicator is based on Linda Raschke's ID/ND4 Historical Volatility Breakout strategy. It finds days where the high and low are within the previous day high and lows (Inside days), that have also, the narrowest trading range within the last 4 days (it basically checks if the current day has the narrowest range comparing it with the previous 3 days) when the short term historical volatility (6 period default) is relatively low compared to the longer term historical volatility (100 period default) (The condition is that the 6/100 Historical volatility is below 50% of its annual range).
More information about how to trade this strategy is described in the book but basically, you would want to place a resting buy and sell stops at the high and low of the day highlighted and enter if you get filled the next day.

QMA/SMA DifferenceIntroduction
The quadratic moving average (QMA) or quadratic weighted moving average (QWMA) is a type of moving average who is closer to the price when price is up trending. This moving average is defined as the square root of the moving average of the squared price. The QMA-SMA difference use this moving average to provide a new volatility indicator who aim to be reactive and filter noisy volatility in order to only provide essential information.
QMA - SMA
This indicator is defined as the difference between a quadratic moving average and a simple moving average of same period. Since the QMA emphasize up movements and tend to be away from down movements she is always greater than the simple moving average, so a simple difference between those moving average provide our volatility indicator. Below is a comparison with a standard deviation and the indicator of both period 100.
Since its a difference between two moving average it can be interesting to use a simple moving as source for the standard deviation to provide another comparison
The standard deviation is smoother but still contain more information as well as having less reactivity.
Conclusion
I have a presented a new volatility indicator based on the quadratic moving average and compared it with a classic standard deviation. It is possible to change the power order of the QMA in order to provide different results, in order to do so you must also change the root, this is done in pine with : pow(sma(pow(close,w),length),1/w) where w is the power order, notice that an high power order can provide non attributed values.

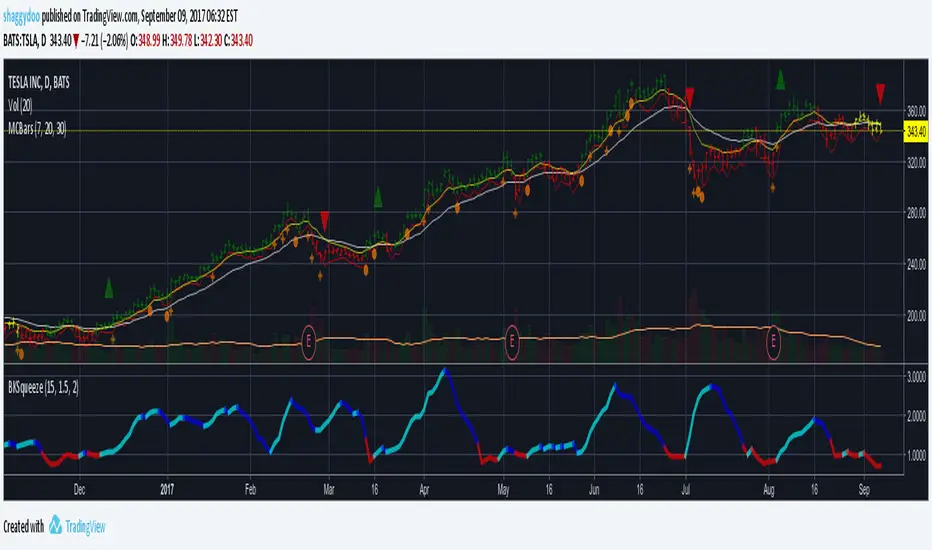
BKSqueezeThis is a price volatility compression and expansion indicator that uses the ratio of the Bollinger Band and Keltner Ratio.
Red segments indicate extreme price volatility compression that can be ideal entry points for stock/futures/forex and/or options positions.
Aqua segments indicate price volatility is expanding.
Blue segments indicate price volatility is compressing - can be used as an exit point or partial scale out point.
Note that the indicator doesn't indicate direction. One suggestion is to use the DMI indicator for this purpose - really depends on how early you enter the trade.
Suggest using a time period of 15 bars for volatile stocks, such as TSLA for example, otherwise a period of 20 bars suits most stocks/futures/forex symbols.
GC1 Orderflow Engine - sudoTLDR
This indicator measures relative buying and selling pressure by comparing GC1! futures returns against XAU price returns, normalized by their own volatility and weighted by GC1! volume. The result is a pressure histogram and line that show whether futures orderflow is leading, lagging, or diverging from spot gold in real time.
What this indicator does
The Orderflow Engine is designed to answer one core question:
Is GC1! futures orderflow applying net pressure in the same direction as XAU, or pushing against it?
It does this by isolating relative strength and weakness between futures and spot, rather than looking at price direction alone.
How the pressure calculation works
1. GC1! futures returns and XAU returns are calculated bar by bar
2. Each return is normalized by its own recent volatility
3. The normalized XAU return is subtracted from the normalized GC1! return
This creates a relative pressure value:
Positive pressure - GC1! futures are outperforming XAU
Negative pressure - GC1! futures are underperforming XAU
Near zero - futures and spot are moving in balance
To emphasize meaningful activity:
GC1! volume is converted into a normalized score
Higher-than-normal futures volume increases the weight of the pressure
Low-volume pressure is naturally dampened
The final output is clamped to keep the scale stable across different market conditions.
Visual output
Histogram
Green bars - positive futures pressure
Red bars - negative futures pressure
Gray bars - neutral or minimal pressure
Pressure line
A smoother view of the same pressure data
Useful for spotting momentum shifts and divergence
Zero line
Represents balance between futures and spot
Crosses often mark changes in orderflow control
Optional annotations
Regime shift markers based on futures participation
Optional percent-change labels for studying pressure acceleration
How to use it
-Confirm whether price moves are supported by futures orderflow
-Spot early divergence between GC1! and XAU
-Identify absorption , distribution , or initiative behavior
-Filter entries by trading only when pressure aligns with your bias
-This tool is best used as confirmation and context, not as a standalone signal generator.
Design philosophy
-Self-normalizing across sessions and volatility regimes
-No fixed thresholds that break over time
-Focused on relative behavior, not prediction
-Built to pair naturally with the Participation Regime indicator

[Kpt-Ahab] Assistant: Risk & DCA PlannerScript Description – Assistant: Risk & DCA Planner
The Risk & DCA Planner is a technical assistant for position and risk management.
It automatically calculates, based on volatility (ATR%), swing structure, and your settings:
Stop-Loss (SL) and corresponding Take-Profit targets (TPs) in R-multiples
DCA (Dollar-Cost-Averaging) levels — both price and amount
A market suitability check (based on volatility & volume)
Plus a clear table and summary label displayed on the chart
The script helps you plan risk, scaling, and profit targets consistently and quantitatively.
Core Logic
Risk Profile
Three modes: Low, Normal, High.
These define how reactive the script behaves internally:
Low → conservative, longer lookbacks, tighter analysis
Normal → balanced
High → aggressive, faster reaction, wider stops
Stop-Loss (SL)
Automatically calculated from ATR% and recent swing structure, limited by minimum and maximum thresholds.
The SL percentage defines the R-unit, which all TPs and DCA levels are based on.
Take-Profits (TPs)
Up to six targets, each a multiple of the defined risk (e.g., 1R, 2R, 3R).
Prices are automatically adjusted depending on long or short direction.
DCA Strategy
Optional. Adds scaling levels evenly between Entry and SL or in multiples of the ATR.
Each DCA allocation grows geometrically until the maximum position size is reached.
Suitability Check
Evaluates whether the market is within an appropriate ATR% range and has sufficient volume.
The table displays “OK” or “Caution” depending on volatility and historical consistency.
Visualization
Lines for SL, TPs, and DCA levels
A table with all parameters, prices, and risk data
A chart label summarizing key info (profile, direction, SL%, TPs, DCA, etc.)

EMA Oscillator [Alpha Extract]A precision mean reversion analysis tool that combines advanced Z-score methodology with dual threshold systems to identify extreme price deviations from trend equilibrium. Utilizing sophisticated statistical normalization and adaptive percentage-based thresholds, this indicator provides high-probability reversal signals based on standard deviation analysis and dynamic range calculations with institutional-grade accuracy for systematic counter-trend trading opportunities.
🔶 Advanced Statistical Normalization
Calculates normalized distance between price and exponential moving average using rolling standard deviation methodology for consistent interpretation across timeframes. The system applies Z-score transformation to quantify price displacement significance, ensuring statistical validity regardless of market volatility conditions.
// Core EMA and Oscillator Calculation
ema_values = ta.ema(close, ema_period)
oscillator_values = close - ema_values
rolling_std = ta.stdev(oscillator_values, ema_period)
z_score = oscillator_values / rolling_std
🔶 Dual Threshold System
Implements both statistical significance thresholds (±1σ, ±2σ, ±3σ) and percentage-based dynamic thresholds calculated from recent oscillator range extremes. This hybrid approach ensures consistent probability-based signals while adapting to varying market volatility regimes and maintaining signal relevance during structural market changes.
// Statistical Thresholds
mild_threshold = 1.0 // ±1σ (68% confidence)
moderate_threshold = 2.0 // ±2σ (95% confidence)
extreme_threshold = 3.0 // ±3σ (99.7% confidence)
// Percentage-Based Dynamic Thresholds
osc_high = ta.highest(math.abs(z_score), lookback_period)
mild_pct_thresh = osc_high * (mild_pct / 100.0)
moderate_pct_thresh = osc_high * (moderate_pct / 100.0)
extreme_pct_thresh = osc_high * (extreme_pct / 100.0)
🔶 Signal Generation Framework
Triggers buy/sell alerts when Z-score crosses extreme threshold boundaries, indicating statistically significant price deviations with high mean reversion probability. The system generates continuation signals at moderate levels and reversal signals at extreme boundaries with comprehensive alert integration.
// Extreme Signal Detection
sell_signal = ta.crossover(z_score, selected_extreme)
buy_signal = ta.crossunder(z_score, -selected_extreme)
// Dynamic Color Coding
signal_color = z_score >= selected_extreme ? #ff0303 : // Extremely Overbought
z_score >= selected_moderate ? #ff6a6a : // Overbought
z_score >= selected_mild ? #b86456 : // Mildly Overbought
z_score > -selected_mild ? #a1a1a1 : // Neutral
z_score > -selected_moderate ? #01b844 : // Mildly Oversold
z_score > -selected_extreme ? #00ff66 : // Oversold
#00ff66 // Extremely Oversold
🔶 Visual Structure Analysis
Provides a six-tier color gradient system with dynamic background zones indicating mild, moderate, and extreme conditions. The histogram visualization displays Z-score intensity with threshold reference lines and zero-line equilibrium context for precise mean reversion timing.
snapshot
4H
1D
🔶 Adaptive Threshold Selection
Features intelligent threshold switching between statistical significance levels and percentage-based dynamic ranges. The percentage system automatically adjusts to current volatility conditions using configurable lookback periods, while statistical thresholds maintain consistent probability-based signal generation across market cycles.
🔶 Performance Optimization
Utilizes efficient rolling calculations with configurable EMA periods and threshold parameters for optimal performance across all timeframes. The system includes comprehensive alert functionality with customizable notification preferences and visual signal overlay options.
🔶 Market Oscillator Interpretation
Z-score > +3σ indicates statistically significant overbought conditions with high reversal probability, while Z-score < -3σ signals extreme oversold levels suitable for counter-trend entries. Moderate thresholds (±2σ) capture 95% of normal price distributions, making breaches statistically significant for systematic trading approaches.
snapshot
🔶 Intelligent Signal Management
Automatic signal filtering prevents false alerts through extreme threshold crossover requirements, while maintaining sensitivity to genuine statistical deviations. The dual threshold system provides both conservative statistical approaches and adaptive market condition responses for varying trading styles.
Why Choose EMA Oscillator ?
This indicator provides traders with statistically-grounded mean reversion analysis through sophisticated Z-score normalization methodology. By combining traditional statistical significance thresholds with adaptive percentage-based extremes, it maintains effectiveness across varying market conditions while delivering high-probability reversal signals based on quantifiable price displacement from trend equilibrium, enabling systematic counter-trend trading approaches with defined statistical confidence levels and comprehensive risk management parameters.

Market Regime Matrix [Alpha Extract]A sophisticated market regime classification system that combines multiple technical analysis components into an intelligent scoring framework to identify and track dominant market conditions. Utilizing advanced ADX-based trend detection, EMA directional analysis, volatility assessment, and crash protection protocols, the Market Regime Matrix delivers institutional-grade regime classification with BULL, BEAR, and CHOP states. The system features intelligent scoring with smoothing algorithms, duration filters for stability, and structure-based conviction adjustments to provide traders with clear, actionable market context.
🔶 Multi-Component Regime Engine Integrates five core analytical components: ADX trend strength detection, EMA-200 directional bias, ROC momentum analysis, Bollinger Band volatility measurement, and zig-zag structure verification. Each component contributes to a sophisticated scoring system that evaluates market conditions across multiple dimensions, ensuring comprehensive regime assessment with institutional precision.
// Gate Keeper: ADX determines market type
is_trending = adx_value > adx_trend_threshold
is_ranging = adx_value <= adx_trend_threshold
is_maximum_chop = adx_value <= adx_chop_threshold
// BULL CONDITIONS with Structure Veto
if price_above_ema and di_bullish
if use_structure_filter and isBullStructure
raw_bullScore := 5.0 // MAXIMUM CONVICTION: Strong signals + Bull structure
else if use_structure_filter and not isBullStructure
raw_bullScore := 3.0 // REDUCED: Strong signals but broken structure
🔶 Intelligent Scoring System Employs a dynamic 0-5 scale scoring mechanism for each regime type (BULL/BEAR/CHOP) with adaptive conviction levels. The system automatically adjusts scores based on signal alignment, market structure confirmation, and volatility conditions. Features decision margin requirements to prevent false regime changes and includes maximum conviction thresholds for high-probability setups.
🔶 Advanced Structure Filter Implements zig-zag based market structure analysis using configurable deviation thresholds to identify significant pivot points. The system tracks Higher Highs/Higher Lows (HH/HL) for bullish structure and Lower Lows/Lower Highs (LL/LH) for bearish structure, applying structure veto logic that reduces conviction when price action contradicts the underlying trend framework.
// Define Market Structure (Bull = HH/HL, Bear = LL/LH)
isBullStructure = not na(last_significant_high) and not na(prev_significant_high) and
not na(last_significant_low) and not na(prev_significant_low) and
last_significant_high > prev_significant_high and last_significant_low > prev_significant_low
isBearStructure = not na(last_significant_high) and not na(prev_significant_high) and
not na(last_significant_low) and not na(prev_significant_low) and
last_significant_low < prev_significant_low and last_significant_high < prev_significant_high
🔶 Superior Engine Components Features dual-layer regime stabilization through score smoothing and duration filtering. The score smoothing component reduces noise by averaging raw scores over configurable periods, while the duration filter requires minimum regime persistence before confirming changes. This eliminates whipsaws and ensures regime transitions represent genuine market shifts rather than temporary fluctuations.
🔶 Crash Detection & Active Penalties Incorporates sophisticated crash detection using Rate of Change (ROC) analysis with severity classification. When crash conditions are detected, the system applies active penalties (-5.0) to BULL and CHOP scores while boosting BEAR conviction based on crash severity. This ensures immediate regime response to major market dislocations and drawdown events.
// === CRASH OVERRIDE (Active Penalties) ===
is_crash = roc_value < crash_threshold
if is_crash
// Calculate crash severity
crash_severity = math.abs(roc_value / crash_threshold)
crash_bonus = 4.0 + (crash_severity - 1.0) * 2.0
// ACTIVE PENALTIES: Force bear dominance
raw_bearScore := math.max(raw_bearScore, crash_bonus)
raw_bullScore := -5.0 // ACTIVE PENALTY
raw_chopScore := -5.0 // ACTIVE PENALTY
❓How It Works
🔶 ADX-Based Market Classification The Market Regime Matrix uses ADX (Average Directional Index) as the primary gatekeeper to distinguish between trending and ranging market conditions. When ADX exceeds the trend threshold, the system activates BULL/BEAR regime logic using DI+/DI- crossovers and EMA positioning. When ADX falls below the ranging threshold, CHOP regime logic takes precedence, with maximum conviction assigned during ultra-low ADX periods.
🔶 Dynamic Conviction Scaling Each regime receives conviction ratings from UNCERTAIN to MAXIMUM based on signal alignment and score magnitude. MAXIMUM conviction (5.0 score) requires perfect signal alignment plus favorable market structure. The system progressively reduces conviction when signals conflict or structure breaks, ensuring traders understand the reliability of each regime classification.
🔶 Regime Transition Management Implements decision margin requirements where new regimes must exceed existing regimes by configurable thresholds before transitions occur. Combined with duration filtering, this prevents premature regime changes and maintains stability during consolidation periods. The system tracks both raw regime signals and final regime output for complete transparency.
🔶 Visual Regime Mapping Provides comprehensive visual feedback through colored candle overlays, background regime highlighting, and real-time information tables. The system displays regime history, conviction levels, structure status, and key metrics in an organized dashboard format. Regime changes trigger immediate visual alerts with detailed transition information.
🔶 Performance Optimization Features efficient array management for zig-zag calculations, smart variable updating to prevent recomputation, and configurable debug modes for strategy development. The system maintains optimal performance across all timeframes while providing institutional-grade analytical depth.
Why Choose Market Regime Matrix ?
The Market Regime Matrix represents the evolution of market regime analysis, combining traditional technical indicators with modern algorithmic decision-making frameworks. By integrating multiple analytical dimensions with intelligent scoring, structure verification, and crash protection, it provides traders with institutional-quality market context that adapts to changing conditions. The sophisticated filtering system eliminates noise while preserving responsiveness, making it an essential tool for traders seeking to align their strategies with dominant market regimes and avoid adverse market environments.

Volatility Squeeze – Blue Zone (classic) Volatility Squeeze – Blue Zone
Highlights periods when volatility contracts by showing a blue band between the Bollinger Bands (BB) whenever they fall inside the Keltner Channel (KC).
Blue zone = squeeze: BB upper & lower are inside KC – market coiling.
Automatic breakout alert: optional alert fires on the first bar after the squeeze releases.
Fully adjustable: BB/KC length, BB σ, KC ATR multiplier, zone colour & opacity, border on/off.
Clean overlay: zone hugs price bar-by-bar and disappears only when the squeeze ends, so past squeezes remain visible for context.
Use it to spot low-volatility setups, then watch for momentum or volume confirmations when the squeeze breaks.

Liquidity Trap Zones [PhenLabs]📊 Liquidity Trap Zones
Version: PineScript™ v6
📌 Description
The goal of the Liquidity Trap Zones indicator is to try and help traders identify areas where market liquidity appears abundant but is actually thin or artificial, helping traders avoid potential fake outs and false breakouts. This advanced indicator analyzes the relationship between price wicks and volume to detect “mirage” zones where large price movements occur on low volume, indicating potential liquidity traps.
By highlighting these deceptive zones on your charts, the indicator helps traders recognize where institutional players might be creating artificial liquidity to trap retail traders. This enables more informed decision-making and better risk management when approaching key price levels.
🚀 Points of Innovation
Mirage Score Algorithm: Proprietary calculation that normalizes wick size relative to volume and average bar size
Dynamic Zone Creation: Automatically generates gradient-filled zones at trap locations with ATR-based sizing
Intelligent Zone Management: Maintains clean charts by limiting displayed zones and auto-updating existing ones
Scale-Invariant Design: Works across all assets and timeframes with intelligent normalization
Real-Time Detection: Identifies trap zones as they form, not after the fact
Volume-Adjusted Analysis: Incorporates tick volume when available for more accurate detection
🔧 Core Components
Mirage Score Calculator: Analyzes the ratio of price wicks to volume, normalized by average bar size
ATR-Based Filter: Ensures only significant price movements are considered for trap zone creation
EMA Smoothing: Reduces noise in the mirage score for clearer signals
Gradient Zone Renderer: Creates visually distinct zones with multiple opacity levels for better visibility
🔥 Key Features
Real-Time Trap Detection: Identifies liquidity mirages as they develop during live trading
Dynamic Zone Sizing: Adjusts zone height based on current market volatility (ATR)
Smart Zone Management: Automatically maintains a clean chart by limiting the number of displayed zones
Customizable Sensitivity: Fine-tune detection parameters for different market conditions
Visual Clarity: Gradient-filled zones with distinct borders for easy identification
Status Line Display: Shows current mirage score and threshold for quick reference
🎨 Visualization
Gradient Trap Zones: Purple gradient boxes with darker centers indicating trap strength
Mirage Score Line: Orange line in status area showing current liquidity quality
Threshold Reference: Gray line showing your configured detection threshold
Extended Zone Display: Zones automatically extend forward as new bars form
📖 Usage Guidelines
Detection Settings
Smoothing Length (EMA) - Default: 10 - Range: 1-50 - Description: Controls responsiveness of mirage score. Lower values make detection more sensitive to recent price action
Mirage Threshold - Default: 5.0 - Range: 0.1-20.0 - Description: Score above this level triggers trap zone creation. Higher values reduce false positives but may miss subtle traps
Filter Settings
ATR Length for Range Filter - Default: 14 - Range: 1-50 - Description: Period for volatility calculation. Standard 14 works well for most timeframes
ATR Multiplier - Default: 1.0 - Range: 0.0-5.0 - Description: Minimum bar range as multiple of ATR. Higher values filter out smaller moves
Display Settings
Zone Height Multiplier - Default: 0.5 - Range: 0.1-2.0 - Description: Controls trap zone height relative to ATR. Adjust for visual preference
Max Trap Zones - Default: 5 - Range: 1-20 - Description: Maximum zones displayed before oldest are removed. Balance clarity vs. history
✅ Best Use Cases
Identifying potential fakeout levels before entering trades
Confirming support/resistance quality by checking for liquidity traps
Avoiding stop-loss placement in trap zones where sweeps are likely
Timing entries after trap zones are cleared
Scalping opportunities when price approaches known trap zones
⚠️ Limitations
Requires volume data - less effective on instruments without reliable volume
May generate false signals during news events or genuine volume spikes
Not a standalone system - combine with price action and other indicators
Zone creation is based on historical data - future price behavior not guaranteed
💡 What Makes This Unique
First indicator to specifically target liquidity mirages using wick-to-volume analysis
Proprietary normalization ensures consistent performance across all markets
Visual gradient design makes trap zones immediately recognizable
Combines multiple volatility and volume metrics for robust detection
🔬 How It Works
1. Wick Analysis: Calculates upper and lower wicks for each bar. Normalizes by average bar size to ensure scale independence
2. Mirage Score Calculation: Divides total wick size by volume to identify thin liquidity. Applies EMA smoothing to reduce noise. Scales result for optimal visibility
3. Zone Creation: Triggers when smoothed score crosses threshold. Creates gradient boxes centered on trap bar. Sizes zones based on current ATR for market-appropriate scaling
💡 Note: Liquidity Trap Zones works best when combined with traditional support/resistance analysis and volume profile indicators. The zones highlight areas of deceptive liquidity but should not be the sole factor in trading decisions. Always use proper risk management and confirm signals with price action.

Rolling Log Returns [BackQuant]Rolling Log Returns
The Rolling Log Returns indicator is a versatile tool designed to help traders, quants, and data-driven analysts evaluate the dynamics of price changes using logarithmic return analysis. Widely adopted in quantitative finance, log returns offer several mathematical and statistical advantages over simple returns, making them ideal for backtesting, portfolio optimization, volatility modeling, and risk management.
What Are Log Returns?
In quantitative finance, logarithmic returns are defined as:
ln(Pₜ / Pₜ₋₁)
or for rolling periods:
ln(Pₜ / Pₜ₋ₙ)
where P represents price and n is the rolling lookback window.
Log returns are preferred because:
They are time additive : returns over multiple periods can be summed.
They allow for easier statistical modeling , especially when assuming normally distributed returns.
They behave symmetrically for gains and losses, unlike arithmetic returns.
They normalize percentage changes, making cross-asset or cross-timeframe comparisons more consistent.
Indicator Overview
The Rolling Log Returns indicator computes log returns either on a standard (1-period) basis or using a rolling lookback period , allowing users to adapt it to short-term trading or long-term trend analysis.
It also supports a comparison series , enabling traders to compare the return structure of the main charted asset to another instrument (e.g., SPY, BTC, etc.).
Core Features
✅ Return Modes :
Normal Log Returns : Measures ln(price / price ), ideal for day-to-day return analysis.
Rolling Log Returns : Measures ln(price / price ), highlighting price drift over longer horizons.
✅ Comparison Support :
Compare log returns of the primary instrument to another symbol (like an index or ETF).
Useful for relative performance and market regime analysis .
✅ Moving Averages of Returns :
Smooth noisy return series with customizable MA types: SMA, EMA, WMA, RMA, and Linear Regression.
Applicable to both primary and comparison series.
✅ Conditional Coloring :
Returns > 0 are colored green ; returns < 0 are red .
Comparison series gets its own unique color scheme.
✅ Extreme Return Detection :
Highlight unusually large price moves using upper/lower thresholds.
Visually flags abnormal volatility events such as earnings surprises or macroeconomic shocks.
Quantitative Use Cases
🔍 Return Distribution Analysis :
Gain insight into the statistical properties of asset returns (e.g., skewness, kurtosis, tail behavior).
📉 Risk Management :
Use historical return outliers to define drawdown expectations, stress tests, or VaR simulations.
🔁 Strategy Backtesting :
Apply rolling log returns to momentum or mean-reversion models where compounding and consistent scaling matter.
📊 Market Regime Detection :
Identify periods of consistent overperformance/underperformance relative to a benchmark asset.
📈 Signal Engineering :
Incorporate return deltas, moving average crossover of returns, or threshold-based triggers into machine learning pipelines or rule-based systems.
Recommended Settings
Use Normal mode for high-frequency trading signals.
Use Rolling mode for swing or trend-following strategies.
Compare vs. a broad market index (e.g., SPY or QQQ ) to extract relative strength insights.
Set upper and lower thresholds around ±5% for spotting major volatility days.
Conclusion
The Rolling Log Returns indicator transforms raw price action into a statistically sound return series—equipping traders with a professional-grade lens into market behavior. Whether you're conducting exploratory data analysis, building factor models, or visually scanning for outliers, this indicator integrates seamlessly into a modern quant's toolbox.

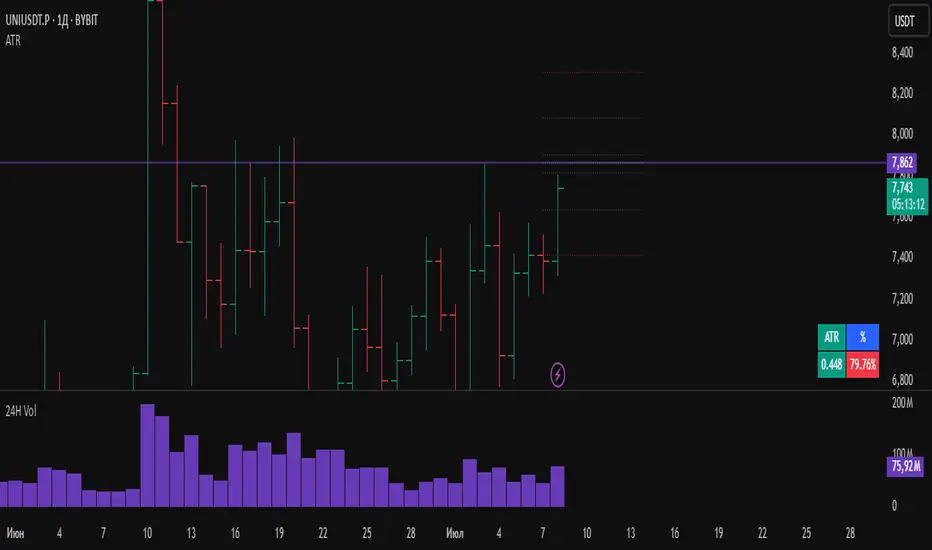
ATRWhat the Indicator Shows:
A compact table with four cells is displayed in the bottom-left corner of the chart:
| ATR | % | Level | Lvl+ATR |
Explanation of the Columns:
ATR — The averaged daily range (volatility) calculated with filtering of abnormal bars (extremely large or small daily candles are ignored).
% — The percentage of the daily ATR that the price has already covered today (the difference between the daily Open and Close relative to ATR).
Level — A custom user-defined level set through the indicator settings.
Lvl+ATR — The sum of the daily ATR and the user-defined level. This can be used, for example, as a target or stop-loss reference.
Color Highlighting of the "%" Cell:
The background color of the "%" ATR cell changes depending on the value:
✅ If the value is less than 10% — the cell is green (market is calm, small movement).
➖ If the value is between 10% and 50% — no highlighting (average movement, no signal).
🟡 If the value is between 50% and 70% — the cell is yellow (movement is increasing, be alert).
🔴 If the value is above 70% — the cell is red (the market is actively moving, high volatility).
Key Features:
✔ All ATR calculations and percentage progress are performed strictly based on daily data, regardless of the chart's current timeframe.
✔ The indicator is ideal for intraday traders who want to monitor daily volatility levels.
✔ The table always displays up-to-date information for quick decision-making.
✔ Filtering of abnormal bars makes ATR more stable and objective.
What is Adaptive ATR in this Indicator:
Instead of the classic ATR, which simply averages the true range, this indicator uses a custom algorithm:
✅ It analyzes daily bars over the past 100 days.
✅ Calculates the range High - Low for each bar.
✅ If the bar's range deviates too much from the average (more than 1.8 times higher or lower), the bar is considered abnormal and ignored.
✅ Only "normal" bars are included in the calculation.
✅ The average range of these normal bars is the adaptive ATR.
Detailed Algorithm of the getAdaptiveATR() Function:
The function takes the number of bars to include in the calculation (for example, 5):
The average of the last 5 normal bars is calculated.
pinescript
Копировать
Редактировать
adaptiveATR = getAdaptiveATR(5)
Step-by-Step Process:
An empty array ranges is created to store the ranges.
Daily bars with indices from 1 to 100 are iterated over.
For each bar:
🔹 The daily High and Low with the required offset are loaded via request.security().
🔹 The range High - Low is calculated.
🔹 The temporary average range of the current array is calculated.
🔹 The bar is checked for abnormality (too large or too small).
🔹 If the bar is normal or it's the first bar — its range is added to the array.
Once the array accumulates the required number of bars (count), their average is calculated — this is the adaptive ATR.
If it's not possible to accumulate the required number of bars — na is returned.
Что показывает индикатор:
На графике внизу слева отображается компактная таблица из четырех ячеек:
ATR % Уровень Ур+ATR
Пояснения к столбцам:
ATR — усреднённый дневной диапазон (волатильность), рассчитанный с фильтрацией аномальных баров (слишком большие или маленькие дневные свечи игнорируются).
% — процент дневного ATR, который уже "прошла" цена на текущий день (разница между открытием и закрытием относительно ATR).
Уровень — пользовательский уровень, который задаётся вручную через настройки индикатора.
Ур+ATR — сумма уровня и дневного ATR. Может использоваться, например, как ориентир для целей или стопов.
Цветовая подсветка ячейки "%":
Цвет фона ячейки с процентом ATR меняется в зависимости от значения:
✅ Если значение меньше 10% — ячейка зелёная (рынок пока спокоен, маленькое движение).
➖ Если значение от 10% до 50% — фон не подсвечивается (среднее движение, нет сигнала).
🟡 Если значение от 50% до 70% — ячейка жёлтая (движение усиливается, повышенное внимание).
🔴 Если значение выше 70% — ячейка красная (рынок активно движется, высокая волатильность).
Особенности работы:
✔ Все расчёты ATR и процентного прохождения производятся исключительно по дневным данным, независимо от текущего таймфрейма графика.
✔ Индикатор подходит для трейдеров, которые торгуют внутри дня, но хотят ориентироваться на дневные уровни волатильности.
✔ В таблице всегда отображается актуальная информация для принятия быстрых торговых решений.
✔ Фильтрация аномальных баров делает ATR более устойчивым и объективным.
Что такое адаптивный ATR в этом индикаторе
Вместо классического ATR, который просто усредняет истинный диапазон, здесь используется собственный алгоритм:
✅ Он берет дневные бары за последние 100 дней.
✅ Для каждого из них рассчитывает диапазон High - Low.
✅ Если диапазон бара слишком сильно отличается от среднего (более чем в 1.8 раза больше или меньше), бар считается аномальным и игнорируется.
✅ Только нормальные бары попадают в расчёт.
✅ В итоге считается среднее из диапазонов этих нормальных баров — это и есть адаптивный ATR.
Подробный алгоритм функции getAdaptiveATR()
Функция принимает количество баров для расчёта (например, 5):
Считается 5 последних нормальных баров
pinescript
Копировать
Редактировать
adaptiveATR = getAdaptiveATR(5)
Пошагово:
Создаётся пустой массив ranges для хранения диапазонов.
Перебираются дневные бары с индексами от 1 до 100.
Для каждого бара:
🔹 Через request.security() подгружаются дневные High и Low с нужным смещением.
🔹 Считается диапазон High - Low.
🔹 Считается временное среднее диапазона по текущему массиву.
🔹 Проверяется, не является ли бар аномальным (слишком большой или маленький).
🔹 Если бар нормальный или это самый первый бар — его диапазон добавляется в массив.
Как только массив набирает заданное количество баров (count), берётся их среднее значение — это и есть адаптивный ATR.
Если не удалось набрать нужное количество баров — возвращается na.
ZenLab ATR FNSThis indicator was created specifically for Zen Labs which includes a custom ATR (Average True Range) table that displays the ATR value for a selected period of candles.
ATR is a volatility indicator that measures the average range between high and low prices over a given number of periods. It helps traders assess how much an asset typically moves, providing valuable information for setting stop losses, take profits, or identifying market conditions. It adapts to changing market conditions, making it useful across different timeframes and asset classes.
How the ATR Indicator Works:
The ATR is based on the concept of True Range (TR), which is the greatest of the following three values:
- Current High minus Current Low
- Absolute value of Current High minus Previous Close
- Absolute value of Current Low minus Previous Close
Averaging the True Range:
Once the True Range is calculated for each period, the ATR is computed by averaging these True Ranges over a set number of periods and is displayed in the table.
Interpreting the ATR:
- A higher ATR value indicates higher volatility—prices are moving more significantly.
- A lower ATR value indicates lower volatility—prices are more stable and less active.
Enjoy!
- Rebel Empire

Linear % ST | QuantEdgeB🚀 Introducing Linear Percentile SuperTrend (Linear % ST) by QuantEdgeB
🛠️ Overview
Linear % SuperTrend (Linear % ST) by QuantEdgeB is a hybrid trend-following indicator that combines Linear Regression, Percentile Filters, and Volatility-Based SuperTrend Logic into one dynamic tool. This system is designed to identify trend shifts early while filtering out noise during choppy market conditions.
By utilizing percentile-based median smoothing and customized ATR multipliers, this tool captures both breakout momentum and pullback opportunities with precision.
✨ Key Features
🔹 Percentile-Based Median Filtering
Removes outliers and normalizes price movement for cleaner trend detection using the 50th percentile (median) of recent price action.
🔹 Linear Regression Smoothing
A smoothed baseline is computed with Linear Regression to detect the underlying trend while minimizing lag.
🔹 SuperTrend Structure with Adaptive Bands
The indicator implements an enhanced SuperTrend engine with custom ATR bands that adapt to trend direction. Bands tighten or loosen based on volatility and trend strength.
🔹 Dynamic Long/Short Conditions
Long and short signals are derived from the relationship between price and the SuperTrend threshold zones, clearly showing trend direction with optional "Long"/"Short" labels on the chart.
🔹 Multiple Visual Themes
Select from 6 built-in color palettes including Strategy, Solar, Warm, Cool, Classic, and Magic to match your personal style or strategy layout.
📊 How It Works
1️⃣ Percentile Filtering
The source price (default: close) is filtered using a nearest-rank 50th percentile over a custom lookback. This normalizes data to reflect the central tendency and removes noisy extremes.
2️⃣ Linear Regression Trend Base
A Linear Regression Moving Average (LSMA) is applied to the filtered median, forming the core trend line. This dynamic trendline provides a low-lag yet smooth view of market direction.
3️⃣ SuperTrend Engine
ATR is applied with custom multipliers (different for long and short) to create dynamic bands. The bands react to price movement and only shift direction after confirmation, preventing false flips.
4️⃣ Trend Signal Logic
• When price stays above the dynamic lower band → Bullish trend
• When price breaks below the upper band → Bearish trend
• Trend direction remains stable until violated by price.
⚙️ Custom Settings
• Percentile Length → Lookback for percentile smoothing (default: 35)
• LSMA Length → Determines the base trend via linear regression (default: 24)
• ATR Length → ATR period used in dynamic bands (default: 14)
• Long Multiplier → ATR multiplier for bullish thresholds (default: 0.8)
• Short Multiplier → ATR multiplier for bearish thresholds (default: 1.9)
✅ How to Use
1️⃣ Trend-Following Strategy
✔️ Go Long when price breaks above the lower ATR band, initiating an upward trend
✔️ Go Short when price falls below the upper ATR band, confirming bearish conditions
✔️ Remain in trend direction until the SuperTrend flips
2️⃣ Visual Confirmation
✔️ Use bar coloring and the dynamic bands to stay aligned with trend direction
✔️ Optional Long/Short labels highlight key signal flips
👥 Who Should Use Linear % ST?
✅ Swing & Position Traders → To ride trends confidently
✅ Trend Followers → As a primary directional filter
✅ Breakout Traders → For clean signal generation post-range break
✅ Quant/Systematic Traders → Integrate clean trend logic into algorithmic setups
📌 Conclusion
Linear % ST by QuantEdgeB blends percentile smoothing with linear regression and volatility bands to deliver a powerful, adaptive trend-following engine. Whether you're a discretionary trader seeking cleaner entries or a systems-based trader building logic for automation, Linear % ST offers clarity, adaptability, and precision in trend detection.
🔹 Key Takeaways:
1️⃣ Percentile + Regression = Noise-Reduced Core Trend
2️⃣ ATR-Based SuperTrend = Reliable Breakout Confirmation
3️⃣ Flexible Parameters + Color Modes = Custom Fit for Any Strategy
📈 Use it to spot emerging trends, filter false signals, and stay confidently aligned with market momentum.
📌 Disclaimer: Past performance is not indicative of future results. No trading strategy can guarantee success in financial markets.
📌 Strategic Advice: Always backtest, optimize, and align parameters with your trading objectives and risk tolerance before live trading.

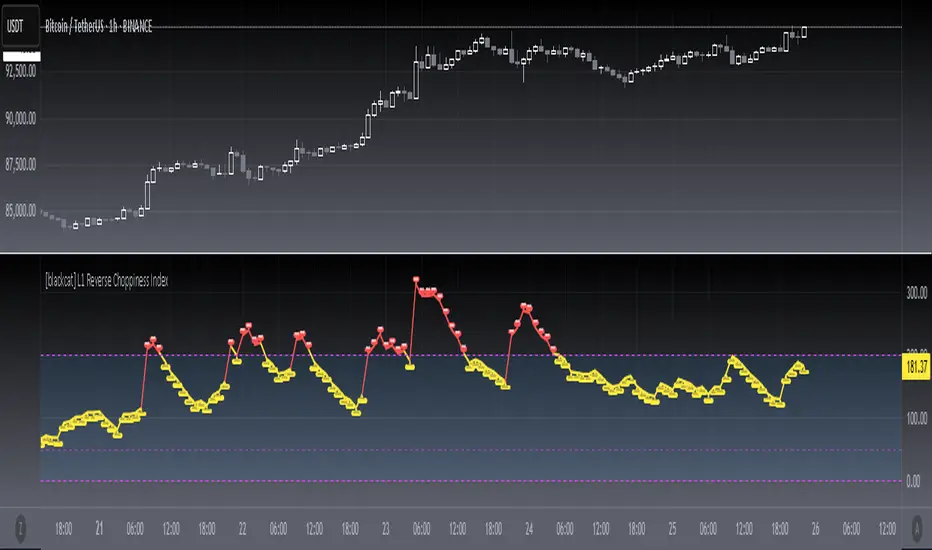
[blackcat] L1 Reverse Choppiness IndexThe Choppiness Index is a technical indicator that is used to measure market volatility and trendiness. It is designed to help traders identify when the market is trending and when it is choppy, meaning that it is moving sideways with no clear direction. The Choppiness Index was first introduced by Australian commodity trader E.W. Dreiss in the late 1990s, and it has since become a popular tool among traders.
Today, I created a reverse version of choppiness index indicator, which uses upward direction as indicating strong trend rather than a traditional downward direction. Also, it max values are exceeding 100 compared to a traditional one. I use red color to indicate a strong trend, while yellow as sideways. Fuchsia zone are also incorporated as an indicator of sideways. One thing that you need to know: different time frames may need optimize parameters of this indicator. Finally, I'd be happy to explain more about this piece of code.
The code begins by defining two input variables: `len` and `atrLen`. `len` sets the length of the lookback period for the highest high and lowest low, while `atrLen` sets the length of the lookback period for the ATR calculation.
The `atr()` function is then used to calculate the ATR, which is a measure of volatility based on the range of price movement over a certain period of time. The `highest()` and `lowest()` functions are used to calculate the highest high and lowest low over the lookback period specified by `len`.
The `range`, `up`, and `down` variables are then calculated based on the highest high, lowest low, and closing price. The `sum()` function is used to calculate the sum of ranges over the lookback period.
Finally, the Choppiness Index is calculated using the ATR and the sum of ranges over the lookback period. The `log10()` function is used to take the logarithm of the sum divided by the lookback period, and the result is multiplied by 100 to get a percentage. The Choppiness Index is then plotted on the chart using the `plot()` function.
This code can be used directly in TradingView to plot the Choppiness Index on a chart. It can also be incorporated into custom trading strategies to help traders make more informed decisions based on market volatility and trendiness.
I hope this explanation helps! Let me know if you have any further questions.
VIX Monitor [Zero54]NSE:BANKNIFTY1!
This is a simple but invaluable tool for both day traders and positional traders. VIX is about market expectations of volatility
The VIX is a very good and sound measure of risk in the markets. It gives these stock traders who are in intraday trading and short term traders an idea of whether the volatility is going up or going down in the market. They can calibrate their strategy accordingly. When the volatility is likely to shoot up sharply, the intraday traders run the risk of stop losses getting triggered quickly. Hence they can either reduce their leverage or they can widen their stop losses accordingly.
Also if you notice VIX is a very good and reliable gauge of index movement. If you plot the VIX and the Nifty movement you will see a clear negative correlation in the charts itself. Markets typically tend to peak out when the VIX is bottoming out and the markets tend to bottom out when the VIX is peaking out. This is a useful input for index trades.
You can use this simple indicator to monitor VIX real time. You can use it for short time frame intraday and also multi-hour, multi-day charts. You can also plot a moving average to gauge the VIX trend.
Also is the ability to monitor, Nifty and BankNifty the same way you are able to monitor the VIX (as explained above). The overall market moves in correlation with these main Indexes. So if you are trading a specific counter, you can also keep an eye on the index to get an idea where the counter may be going next.
The source code is open, please feel to modify or re-use as you feel it’s necessary. Any changes, improvements, bugs, please let me know.
Please like/boost this indicator and also add your comments, if you find it useful.

HPK Crash IndicatorFrom Hari P. Krishnan's book, The Second Leg Down: Strategies for Profiting after a Market Sell-Off :
"We start by specifying the year on year (YoY) change in the index. Next, we calculate the 5 year trailing Z score of the YoY returns. We also calculate the 5 year trailing Z score of 1 month historical volatility for the index, using daily returns. Our crisis warning indicator flashes if both Z scores are above 2. In other words, recent price increases and current volatility need to be at least 2 standard deviations above normal.
It can be seen that this basic implementation is reasonably effective, accepting that the effective sample set is small. A false signal is given in mid-2006, but the signal is quickly washed away. The remaining signals occur fairly close to the point of collapse. The idea that elevated volatility is predictive of danger is not new and underpins many asset allocation schemes. However, Sornette deserves credit for moving away from a largely valuation-based approach to predicting crises to one that relies upon price action itself."

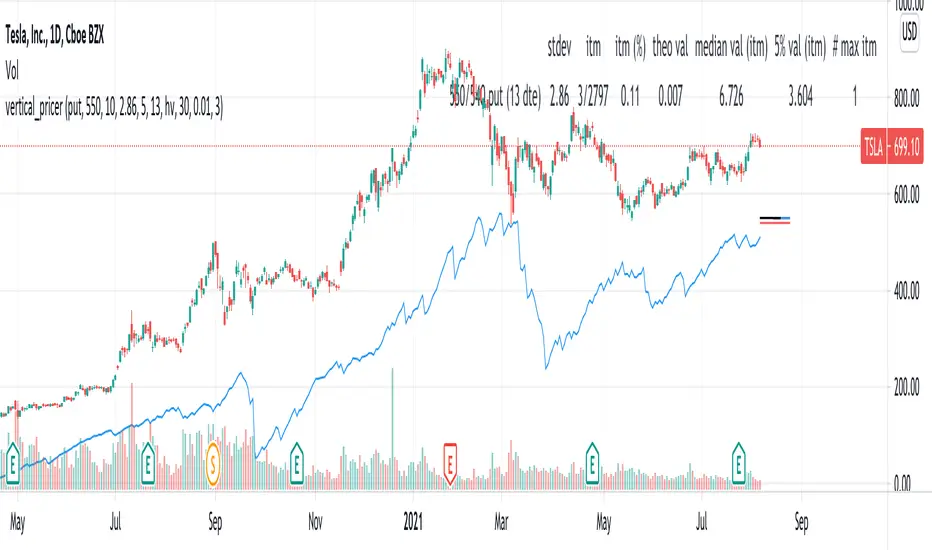
vertical_pricer
USAGE
1. Select the type of contract (call or put), the long strike, and the width.
2. Select the volatility model
3. The standard deviation is shown, enter it into the input.
The tool gives a theoretical price of a vertical spread, based on a
historical sample. The test assumes that a spread of equal width was sold on
every prior trading day at the given standard deviation, based on the
volatility model and duration of the contract. For example, if the 20 dte
110 strike is presently two standard deviations based on the 30 period
historical volatility, then the theoretical value is the average price all
2SD (at 20 dte) calls upon expiration, limited by the width of the spread and
normalized according to the present value of the underlying.
Other statistics include:
- The number of spreads in the sample, and percentage expired itm
- The median value at expiration
- The Nth percentile value of spreads at expiration
- The number of spreads that expired at max loss
Check the script comments and release notes for further updates, since Tradingview doesn't allow me to edit this description.
Efficient Trend Step Mod (v.3)This is a version 3 of my mod of the script by alexgrover - Efficient Trend Step.
The logic is based on calculation of Kaufman's efficiency ratio (ER):
ER = Direction / Volatility
where:
Direction = ABS (Close – Close )
Volatility = n ∑(ABS(Close – Close ))
n = The efficiency ratio period.
This version features volatility and volume filter and custom performance module.

Combo VIX and DXYHello traders
It's been a while :)
I wanted to share a cool script that you can use for any asset class.
The script isn't really special - though what it displays is super helpful
Volatility Index $VIX
(Source: Wikipedia)
VIX is the ticker symbol and the popular name for the Chicago Board Options Exchange's CBOE Volatility Index, a popular measure of the stock market's expectation of volatility based on S&P 500 index options.
It is calculated and disseminated on a real-time basis by the CBOE, and is often referred to as the fear index or fear gauge.
I consider that a $VIX above 30% is a very bearish signal.
Above 30% translating investors selling in masse their assets. #blood #on #the #street
Dollar Index $DXY
(Source: Wikipedia)
The U.S. Dollar Index (USDX, DXY, DX, or, informally, the "Dixie") is an index (or measure) of the value of the United States dollar relative to a basket of foreign currencies, often referred to as a basket of U.S. trade partners' currencies.
The Index goes up when the U.S. dollar gains "strength" (value) when compared to other currencies.
The index is designed, maintained, and published by ICE (Intercontinental Exchange, Inc.), with the name "U.S. Dollar Index" a registered trademark.
It is a weighted geometric mean of the dollar's value relative to following select currencies:
Euro (EUR), 57.6% weight
Japanese yen (JPY) 13.6% weight
Pound sterling (GBP), 11.9% weight
Canadian dollar (CAD), 9.1% weight
Swedish krona (SEK), 4.2% weight
Swiss franc (CHF) 3.6% weight
In "bear markets", the $DXY usually goes up.
People are selling their hard assets to get some $USD in return - pumping the $DXY higher
Corollary
I'm not sure which one happens first between a bearish $DXY or bearish $DXY... though both are usually correlated
If:
- $VIX goes above 30%, usually $DXY increases and assets versus the good old' $USD drop
- $VIX goes below 30%, usually $DXY decreases and assets versus the good old' $USD increases
This is a nice lever effect between both the $VIX, $DXY and the assets versus the $USD
That's being said, I don't only use those 2 information to enter in a trade.
It gives me though a strong confirmation whenever I'm long or short
Imagine I get a LONG signal but the combo $VIX + $DXY is bearish... this tells me to be cautious and to:
- enter at a pullback
- protect my position quickly at breakeven
- take my profit quick
For a mega bull market (some called it hyperinflation), you want your fiat to drop in value for the counter-asset to increase in value.
And before you ask.... yes I look at what $DXY is doing before taking a trade on $BTCUSD :)
In other words, $DXY going down is quite bullish for Bitcoin.
Settings and Alerts
The settings by default are the ones I use for my trading.
The background colors will be colored whenever the COMBO is bullish (green) or bearish (red)
Alerts are enabled using the brand new alert function published last week by @TradingView
That's it for today, I hope you'll like it :)
PS: In this chart above, I'm using the Supertrend indicator from @KivancOzbilgic
Dave

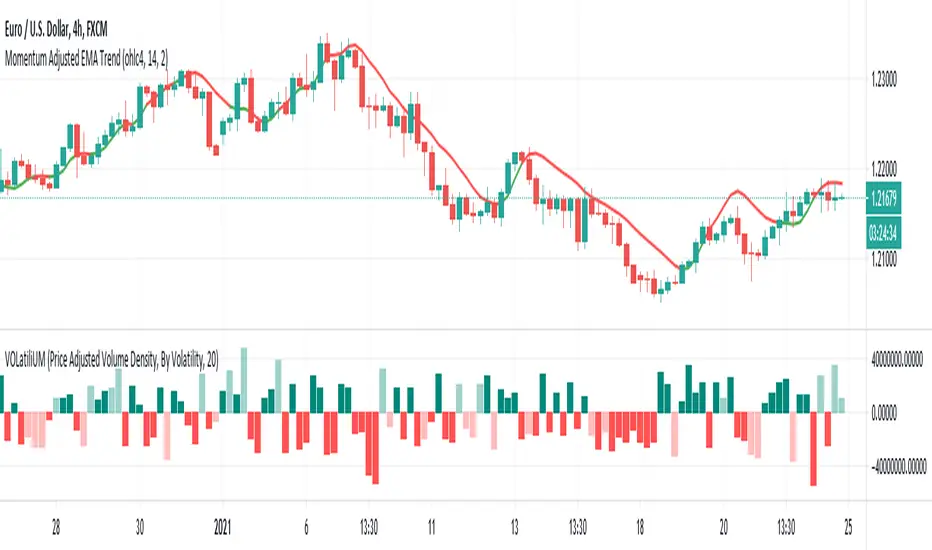
VOLatiliUMThis is a useful conjunction of volume and volatility together in one script, so I named it a blended name!
It can show the diagram of:
- Volume
- Volume Variation (Volume - Past Volume)
- Volume Density (Volume / (High - Low))
- Volatility in combination with the aforesaid ones
It also offers two concepts of bar colorizing, by using the size of the bars or by applying volatility from a higher time frame (HTF).
The option "Absolute Bar Values" is included for the ones who like to see all bars positive above the zero line!
Feel free to use the script and send me your opinions. Thanks.
Sigma Spike Filtered Binned OPR ( Adam H. Grimes )As originally described by Adam H. Grimes.
For analyzing the location of Open within the day's range (OPR). The OPR histogram displays the binned distribution of OPR values for the chart history. Fat tails at the extremes indicates that Open occurred more often close to the day's high or low.
The OPR results are filtered according to volatility using Grime's Sigma Spike. So that OPR values are only recorded when volatility exceeds a threshold (relative high range days).
This may (strong emphasis on may) indicate the opportunity for trades early in the day on days that begin with a high amount of relative volatility and trading with the direction that price is moving away from the open.
