[MAD] WaveBuilderThe WaveBuilder indicator is a powerful technical analysis tool that combines wave calculations, channel formation, and smoothing techniques to identify trends, reversals, and potential trading opportunities.
It provides users with customizable settings for different timeframes, smoothing averages, channel levels, and alert conditions, making it a comprehensive and versatile tool for analyzing market dynamics.
----------------------
Wave Settings:
The Wave Settings section in the Multitimeframe WaveTrend indicator allows you to configure parameters related to the wave calculations based on different timeframes and lengths. This section focuses on four different lengths. Here are the details of the Wave Settings (4 Lengths):
Timeframe 1 (TF1): This parameter allows you to select the first timeframe for the wave calculation. You can choose any valid timeframe.
Weight (F1): This setting represents the weight for Timeframe 1. It is a floating-point value that affects the impact of this timeframe in the wave calculation.
Multiplier 2 (TF2): This parameter specifies the multiplier for the second timeframe. It determines the ratio between Timeframe 2 and Timeframe 1.
Weight (F2): This setting represents the weight for Timeframe 2. It determines the influence of Timeframe 2 in the wave calculation.
Multiplier 3 (TF3): This parameter defines the multiplier for the third timeframe. It determines the ratio between Timeframe 3 and Timeframe 1.
Weight (F3): This setting represents the weight for Timeframe 3. It determines the impact of Timeframe 3 in the wave calculation.
Multiplier 4 (TF4): This parameter specifies the multiplier for the fourth timeframe. It determines the ratio between Timeframe 4 and Timeframe 1.
Weight (F4): This setting represents the weight for Timeframe 4. It determines the influence of Timeframe 4 in the wave calculation.
WaveBuilder Fast: This parameter sets the length of the fast wave average. It represents the number of bars considered in the calculation of the fast wave average.
WaveBuilder Slow: This parameter sets the length of the slow wave average. It represents the number of bars considered in the calculation of the slow wave average.
The Wave Settings allow you to configure different timeframes, multipliers, and weights for wave calculations. These settings provide flexibility in customizing the indicator's behavior based on your preferred trading strategy and market conditions.
----------------------
Counter Oscillator:
The Counter Oscillator section in the Multitimeframe WaveTrend indicator enables you to configure parameters related to a counter oscillator. This oscillator helps identify potential reversals or countertrend movements.
Here are the details of the Counter Oscillator settings:
Multiplier Counter (TF5): This parameter allows you to select the multiplier counter timeframe. It determines the ratio between the multiplier counter and the main timeframes.
Weight (F5): This setting represents the weight for the multiplier counter. It determines the influence of the multiplier counter in the counter oscillator calculation.
Length (will_length): This parameter sets the length or period of the counter oscillator. It represents the number of bars considered in the counter oscillator calculation.
The Counter Oscillator settings provide additional insights into the market by analyzing countertrend movements. By adjusting the multiplier counter and length parameters, you can customize the counter oscillator to suit your trading preferences.
----------------------
Wave Smoothing and Mixing:
The Wave Smoothing and Mixing section in the Multitimeframe WaveTrend indicator allows you to configure parameters related to the smoothing and mixing of the wave calculations. Here are the details of the Wave Smoothing and Mixing settings:
Average 1 Type: This parameter allows you to select the type of smoothing average for the first average. You have various options such as WMA, HMA, VWMA, LMA, RMA, SMA, EMA, and more.
Length 1: This setting determines the length or period of the first smoothing average. It represents the number of bars considered in the calculation.
Average 2 Type: This parameter allows you to select the type of smoothing average for the second average.
Length 2: This setting determines the length or period of the second smoothing average.
Mix Factor AVG1-AVG2: This parameter controls the mixing factor between the first and second smoothing averages. It affects the weighting or blending of the two averages.
POW - Factor: This parameter adjusts the power factor, which can compress or expand the resulting values. It allows you to fine-tune the output based on your preferences.
The Wave Smoothing and Mixing settings enable you to smooth the wave calculations and mix different averages to create a more refined and customized output. By selecting the desired smoothing types, adjusting the lengths, and modifying the mix factor and power factor, you can tailor the indicator to your specific trading style.
----------------------
Channel Levels and Alert Mode:
The Channel Levels and Alert Mode section in the Multitimeframe WaveTrend indicator allows you to configure parameters related to the channel levels and the alert mode. Here are the details of the Channel Levels and Alert Mode settings:
Channel Width: This parameter determines the width or range of the channel levels. It represents the distance between the upper and lower channel lines.
Channel Shift Up/Down: This setting allows you to shift the entire channel up or down. It represents the vertical offset of the channel lines.
Alert Mode (Alertmode): This parameter determines the type of alert triggered by the indicator based on the channel levels.
You have options such as Outside, CrossIn, CrossOut, ChangeDir-All, and ChangeDir-Outside.
Channel Levels: The upper and lower channel levels are calculated based on the channel width and offset. They provide visual boundaries for the price movement within the channel.
The Channel Levels and Alert Mode settings help define the channel levels and specify the conditions for generating alert notifications.
By adjusting the channel width, offset, and selecting the appropriate alert mode, you can customize the indicator's behavior according to your trading requirements.
----------------------
Dynamic Channel:
The Dynamic Channel section in the Multitimeframe WaveTrend indicator allows you to configure parameters related to the dynamic channel formation.
This feature helps create channels based on different smoothing averages.
Here are the details of the Dynamic Channel settings:
Channel Average 1 Type: This parameter allows you to select the type of smoothing average for the first channel average.
Length 1: This setting determines the length or period of the first channel average.
Channel Average 2 Type: This parameter allows you to select the type of smoothing average for the second channel average.
Length 2: This setting determines the length or period of the second channel average.
MA 1 / MA 2 Mix Factor: This parameter controls the mixing factor between the first and second channel averages. It affects the weighting or blending of the two averages.
Mixing Off Dynamic in Weight: This parameter allows you to mix off the dynamic in weight.
Smoothing Type: This parameter allows you to select the type of smoothing for the trend within the dynamic channel.
Smoothing Length: This setting determines the length or period of the trend smoothing within the dynamic channel.
The Dynamic Channel settings enable you to create channels based on different smoothing averages and adjust the weighting between them. Additionally, you can apply further smoothing to the trend within the dynamic channel. This feature helps identify trends and potential trade opportunities within the channel.
----------------------
Speed of Change Rate:
The Speed of Change Rate section in the Multitimeframe WaveTrend indicator allows you to configure parameters related to the rate of change in the indicator. Here are the details of the Speed of Change Rate settings:
Plot Speed (plot_speed): This setting determines whether to plot the speed of change on the chart.
Speed Scaling (change_factor): This parameter adjusts the scaling factor for the speed of change.
Speed Smoother (smoothtype_change): This parameter allows you to select the type of smoothing average for the speed of change calculation.
Speed Length (change_length): This setting determines the length or period of the speed of change calculation.
The Speed of Change Rate settings provide insights into the rate at which the indicator values are changing. By visualizing and analyzing the speed of change, you can identify potential acceleration or deceleration in the price movement.
----------------------
Signal Main Configuration:
The Signal Main Configuration section in the Multitimeframe WaveTrend indicator allows you to configure parameters related to the signal input and passthrough. Here are the details of the Signal Main Configuration settings:
Signal Type (inputtype): This parameter determines the type of signal input. You have options such as MultiBit and NoInput.
Select L1 Indicator Signal (inputModule): This parameter allows you to select the source of the L1 indicator signal. You can choose any valid input source, such as the closing price or another indicator.
Signal Passthrough (Passthrough): This setting enables or disables the passthrough of the signal. When enabled, the indicator passes the input signal to the output.
The Signal Main Configuration settings allow you to define the type of signal input and control whether to pass the signal through the indicator or not. This feature provides flexibility in integrating the indicator with other trading strategies or indicators.
----------------------
Multibit Modified Channel:
The Multibit Modified Channel section in the Multitimeframe WaveTrend indicator allows you to configure parameters related to the modified channel based on the multibit input. Here are the details of the Multibit Modified Channel settings:
Input Bull (CH_Trendup_in): This parameter allows you to specify the input channel for bullish signals.
Bull Offset (trendfactorbull): This setting determines the offset for the bullish signals in the modified channel.
Input Bear (CH_Trenddown_in): This parameter allows you to specify the input channel for bearish signals.
Bear Offset (trendfactorbaer): This setting determines the offset for the bearish signals in the modified channel.
The Multibit Modified Channel settings enable you to modify the channel based on the multibit input. By specifying the input channels for bullish and bearish signals and adjusting the respective offsets,
you can customize the channel representation based on your trading strategy.
Multibit Output:
The Multibit Output section in the Multitimeframe WaveBuilder indicator allows you to configure parameters related to the output of the multibit signals and alerts. Here are the details of the Multibit Output settings:
Output Bull (CH_Buy_out): This parameter specifies the output channel for bullish signals.
Output Bear (CH_Sell_out): This parameter specifies the output channel for bearish signals.
Show Alerts (showalerts): This setting determines whether to display alert notifications for the multibit signals.
The Multibit Output settings define the output channels for bullish and bearish signals and control the display of alert notifications. This allows you to visualize and receive alerts for the multibit signals generated by the indicator.
----------------
Here a overview from the settings
--------------------------------
The pipeline of the WaveBuilder can be understood in the following structured manner:
----------
Wave Calculation:
Wave calculation is performed using the input parameters, resulting in wave values.
The wave values are then averaged using Average 1 and Average 2, and the weighted average is obtained.
The weighted average is mixed with other factors to create a mixed value.
----------
Channel Formation:
The mixed value is multiplied by a weight to generate a dynamic part.
The dynamic part is combined with the static channel and the multibit modification to form a base value.
----------
Smoothing and Mixing:
The base value is averaged using Average 1 and Average 2, and the weighted average is calculated.
The mixed2 value is obtained by smoothing the weighted average.
The mixed2 value is further processed using power compression (POW) to refine the output.
----------
Plotting:
The final smoothed and processed values are plotted to visualize the indicator on the chart.
By following this pipeline, the WaveBuilder combines wave calculations, channel formation, smoothing techniques, and power compression to provide valuable insights into market trends and potential trading opportunities.
--------------------------------
Librarys used:
djmad/Signal_transcoder_library
djmad/MAD_MATH
djmad/Mad_Standardparts
Cerca negli script per "WaveTrend"

Rubotics TDI Top/Bottom Indicator**Rubotics TDI Top/Bottom Indicator (Rubots TDI T/B)**
This proprietary indicator integrates several technical analysis tools into one cohesive system to help traders identify potential top and bottom signals directly on the price chart. Unlike standard indicators that merely plot common metrics, this script uniquely fuses a custom moving average algorithm with established oscillators to enhance signal clarity and market timing.
**Core Components and Unique Features:**
- **Global Visual Settings:**
- Easily toggle visual elements (tables, background highlights) that display key metrics and trading setup information.
- Provides a detailed on-chart display of strategy data and essential trading parameters.
- **MAVW Calculation (Proprietary):**
- Computes a series of weighted moving averages using Fibonacci-inspired lengths (3, 5, 8, 13, 21, 34) to generate a dynamic moving average (MAVW).
- The MAVW line is color-coded—blue when trending upward, red when trending downward, and yellow when neutral—to offer an immediate visual cue of market direction.
- **RSI Module:**
- Calculates the RSI on a user-selected price source (default: close) with a customizable period (default: 14).
- Adjustable thresholds (default: 45 and 55) allow for fine-tuning of overbought and oversold conditions.
- **TDI Component:**
- Adapts the RSI into a dynamic channel using a simple moving average and a scaled standard deviation (multiplied by 1.6185) to form upper and lower bands.
- Incorporates both fast and slow moving averages (default periods: 2 and 7) with optional band filling to visually highlight momentum changes.
- **Note:** The TDI logic is based on public methodologies for converting RSI data into a dynamic indicator.
- **WaveTrend Oscillator:**
- Uses configurable channel and smoothing parameters to generate a WaveTrend line for additional momentum confirmation.
- The oscillator is used to further validate top and bottom signals by identifying overbought or oversold conditions.
- **Note:** The WaveTrend calculations are derived from widely available, public-domain techniques.
- **Signal Generation:**
- **Buy Signal:** Generated when the RSI is below its lower threshold, the TDI fast MA crosses above the lower band (with prior bar confirmation), the price is below the MAVW, and the WaveTrend indicates oversold conditions.
- **Sell Signal:** Generated when the RSI is above its upper threshold, the TDI fast MA crosses below the upper band (with prior bar confirmation), the price is above the MAVW, and the WaveTrend signals overbought conditions.
- Signals are visually marked on the chart with upward and downward triangles and accompanied by alert conditions.
- **Volume-Based Bar Coloring & Additional Visuals:**
- Colors price bars based on volume relative to a moving average to highlight the strength of moves.
- Provides background color changes and a dynamic table of key metric values (MAVW, RSI, TDI bands, WaveTrend) for real-time analysis.
**Customization and Originality:**
- Extensive input parameters allow traders to adjust each component to suit their trading style and market conditions.
- The unique combination of the proprietary MAVW calculation with traditional RSI, TDI, and WaveTrend elements creates a robust system for detecting market tops and bottoms.
- **Closed-Source Justification:**
This indicator is published as a closed-source script due to the proprietary enhancements integrated into the MAVW algorithm and signal generation logic. These unique modifications provide added value beyond standard public indicators.

Ultimate Multi-Asset Correlation System by able eiei Ultimate Multi-Asset Correlation System - User Guide
Overview
This advanced TradingView indicator combines WaveTrend oscillator analysis with comprehensive multi-asset correlation tracking. It helps traders understand market relationships, identify regime changes, and spot high-probability trading opportunities across different asset classes.
Key Features
1. WaveTrend Oscillator
Main Signal Lines: WT1 (blue) and WT2 (red) plot momentum and its moving average
Overbought/Oversold Zones: Default levels at +60/-60
Cross Signals:
🟢 Bullish: WT1 crosses above WT2 in oversold territory
🔴 Bearish: WT1 crosses below WT2 in overbought territory
Higher Timeframe (HTF) Analysis: Shows WT1 from 4H, Daily, and Weekly timeframes for trend confirmation
2. Multi-Asset Correlation Tracking
Monitors relationships between:
Major Assets: Gold (XAUUSD), Dollar Index (DXY), US 10-Year Yield, S&P 500
Crypto Assets: Bitcoin, Ethereum, Solana, BNB
Cross-Asset Analysis: Correlation between traditional markets and crypto
3. Market Regime Detection
Automatically identifies market conditions:
Risk-On: High correlation + positive sentiment (🟢 Green background)
Risk-Off: High correlation + negative sentiment (🔴 Red background)
Crypto-Risk-On: Strong crypto correlations (🟠 Orange background)
Low-Correlation: Divergent market behavior (⚪ Gray background)
Neutral: Mixed signals (🟡 Yellow background)
How to Use
Basic Setup
Add to Chart: Apply the indicator to any chart (works on all timeframes)
Choose Display Mode (Display Options):
All: Shows everything (recommended for comprehensive analysis)
WaveTrend Only: Focus on momentum signals
Correlation Only: View market relationships
Heatmap Only: Simplified correlation view
Enable Asset Groups:
✅ Major Assets: Traditional markets (stocks, bonds, commodities)
✅ Crypto Assets: Digital currencies
Mix and match based on your trading focus
Reading the Charts
WaveTrend Section (Bottom Panel)
Above 0 = Bullish momentum
Below 0 = Bearish momentum
Above +60 = Overbought (potential reversal)
Below -60 = Oversold (potential bounce)
Lighter lines = Higher timeframe trends
Correlation Histogram (Colored Bars)
Blue bars: Major asset correlations
Orange bars: Crypto correlations
Purple bars: Cross-asset correlations
Bar height: Correlation strength (-50 to +50 scale)
Background Color
Intensity reflects correlation strength
Color shows market regime
Dashboard Elements
🎯 Market Regime Analysis (Top Left)
Current Regime: Overall market condition
Average Correlation: Strength of relationships (0-1 scale)
Risk Sentiment: -100% (risk-off) to +100% (risk-on)
HTF Alignment: Multi-timeframe trend agreement
Signal Quality: Confidence level for current signals
📊 Correlation Matrix (Top Right)
Shows correlation values between asset pairs:
1.00: Perfect positive correlation
0.75+: Strong correlation (🟢 Green)
0.50+: Medium correlation (🟡 Yellow)
0.25+: Weak correlation (🟠 Orange)
Below 0.25: Negative/no correlation (🔴 Red)
🔥 Correlation Heatmap (Bottom Right)
Visual matrix showing:
Gold vs. DXY, BTC, ETH
DXY vs. BTC, ETH
BTC vs. ETH
Color-coded strength
📈 Performance Tracker (Bottom Left)
Tracks individual asset momentum:
WT1 Values: Current momentum reading
Status: OB (overbought) / OS (oversold) / Normal
Trading Strategies
1. High-Probability Trend Following
✅ Entry Conditions:
WaveTrend bullish/bearish cross
HTF Alignment matches signal direction
Signal Quality > 70%
Correlation supports direction
2. Regime Change Trading
🎯 Watch for regime shifts:
Risk-Off → Risk-On = Consider long positions
High correlation → Low correlation = Reduce position size
Crypto-Risk-On = Focus on crypto longs
3. Divergence Trading
🔍 Look for:
Strong correlation breakdown = Potential volatility
Cross-asset correlation surge = Follow the leader
Volume-price correlation extremes = Trend confirmation
4. Overbought/Oversold Reversals
⚡ Trade reversals when:
WT crosses in extreme zones (-60/+60)
HTF alignment shows opposite trend weakening
Correlation confirms mean reversion setup
Customization Tips
Fine-Tuning Parameters
WaveTrend Core:
Channel Length (10): Lower = more sensitive, Higher = smoother
Average Length (21): Adjust for your timeframe
Correlation Settings:
Length (50): Longer = more stable, Shorter = more responsive
Smoothing (5): Reduce noise in correlation readings
Market Regime:
Risk-On Threshold (0.6): Lower = earlier regime signals
High Correlation Threshold (0.75): Adjust sensitivity
Custom Asset Selection
Replace default symbols with your preferred markets:
Major Assets: Any forex, indices, bonds
Crypto: Any digital currencies
Must use correct exchange prefix (e.g., BINANCE:BTCUSDT)
Alert System
Enable "Advanced Alerts" to receive notifications for:
✅ Market regime changes
✅ Correlation breakdowns/surges
✅ Strong signals with high correlation
✅ Extreme volume-price correlation
✅ Complete HTF alignment
Correlation Interpretation Guide
ValueMeaningTrading Implication+0.75 to +1.0Strong positiveAssets move together+0.5 to +0.75Moderate positiveGenerally aligned+0.25 to +0.5Weak positiveLoose relationship-0.25 to +0.25No correlationIndependent movements-0.5 to -0.25Weak negativeSlight inverse relationship-0.75 to -0.5Moderate negativeTend to move opposite-1.0 to -0.75Strong negativeStrongly inversely correlated
Best Practices
Use Multiple Timeframes: Check HTF alignment before trading
Confirm with Correlation: Strong signals work best with supportive correlations
Watch Regime Changes: Adjust strategy based on market conditions
Volume Matters: Enable volume-price correlation for confirmation
Quality Over Quantity: Trade only high-quality setups (>70% signal quality)
Common Patterns to Watch
🔵 Risk-On Environment:
Gold-BTC positive correlation
DXY negative correlation with risk assets
High crypto correlations
🔴 Risk-Off Environment:
Flight to safety (Gold up, stocks down)
DXY strength
Correlation breakdowns
🟡 Transition Periods:
Low correlation across assets
Mixed HTF signals
Use caution, reduce position sizes
Technical Notes
Calculation Period: Uses HLC3 (average of high, low, close)
Correlation Window: Rolling correlation over specified length
HTF Data: Accurately calculated using security() function
Performance: Optimized for real-time calculation on all timeframes
Support
For optimal performance:
Use on 15-minute to daily timeframes
Enable only needed asset groups
Adjust correlation length based on trading style
Combine with your existing strategy for confirmation
Enjoy comprehensive multi-asset analysis! 🚀

MFx Radar (Money Flow x-Radar)Description:
MFx Radar is a precision-built multi-timeframe analysis tool designed to identify high-probability trend shifts and accumulation/distribution events using a combination of WaveTrend dynamics, normalized money flow, RSI, BBWP, and OBV-based trend biasing.
Multi-Timeframe Trend Scanner
Analyze trend direction across 5 customizable timeframes using WaveTrend logic to produce a clear trend consensus.
Smart Money Flow Detection
Adaptive hybrid money flow combines CMF and MFI, normalized across lookback periods, to pinpoint shifts in accumulation or distribution with high sensitivity.
Event-Based Labels & Alerts
Minimalist "Accum" and "Distr" text labels appear at key inflection points, based on hybrid flow flips — designed to highlight smart money moves without clutter.
Trigger & Pattern Recognition
Built-in logic detects anchor points, trigger confirmations, and rare "Snake Eye" formations directly on WaveTrend, enhancing trade timing accuracy.
Visual Dashboard Table
A real-time table provides score-based insight into signal quality, trend direction, and volume behavior, giving you a full picture at a glance.
MFx Radar helps streamline discretionary and system-based trading decisions by surfacing key confluences across price, volume, and momentum all while staying out of your way visually.
How to Use MFx Radar
MFx Radar is a multi-timeframe market intelligence tool designed to help you spot trend direction, momentum shifts, volume strength, and high-probability trade setups using confluence across price, flow, and timeframes.
Where to find settings To see the full visual setup:
After adding the script, open the Settings gear. Go to the Inputs tab and enable:
Show Trigger Diamonds
Show WT Cross Circles
Show Anchor/Trigger/Snake Eye Labels
Show Table
Show OBV Divergence
Show Multi-TF Confluence
Show Signal Score
Then, go to the Style tab to adjust colors and fills for the wave plots and hybrid money flow. (Use published chart as a reference.)
What the Waves and Colors Mean
Blue WaveTrend (WT1 / WT2). These are the main momentum waves.
WT1 > WT2 = bullish momentum
WT1 < WT2 = bearish momentum
Above zero = bullish bias
Below zero = bearish bias
When WT1 crosses above WT2, it often marks the beginning of a move — these are shown as green trigger diamonds.
VWAP-MACD Line
The yellow fill helps spot volume-based momentum.
Rising = trend acceleration
Use together with BBWP (bollinger band width percentile) and hybrid money flow for confirmation.
Hybrid Money Flow
Combines CMF and MFI, normalized and smoothed.
Green = accumulation
Red = distribution
Transitions are key — especially when price moves up, but money flow stays red (a divergence warning).
This is useful for spotting fakeouts or confirming smart money shifts.
Orange Vertical Highlights
Shows when price is rising, but money flow is still red.
Often a sign of hidden distribution or "exit pump" behavior.
Table Dashboard (Bottom-Right)
BBWP (Volatility Pulse)
When BBWP is low (<20), it signals consolidation — a breakout is likely to follow.
Use this with ADX and WaveTrend position to anticipate directional breakouts.
Trend by ADX
Shows whether the market is trending and in which direction.
Combined with money flow and RSI, this gives strong confirmation on breakouts.
OBV HTF Bias
Gives higher timeframe pressure (bullish/bearish/neutral).
Helps avoid taking counter-trend trades.
Pattern Labels (WT-Based)
A = Anchor Wave — WT hitting oversold
T = Trigger Wave — WT turning back up after anchor
👀 = Snake Eyes — Rare pattern, usually signaling strong reversal potential
These help in timing entries, especially when they align with other signals like BBWP breakouts, confluence, or smart money flow flips.
Multi-Timeframe (MTF) Consensus
The system checks WaveTrend on 5 different timeframes and gives:
Color-coded signals on each TF
A final score: “Mostly Up,” “Mostly Down,” or “Mixed”
When MTFs align with wave crosses, BBWP expansion, and hybrid money flow shifts, the probability of sustained move is higher.
Divergence Spotting (Advanced Tip)
Watch for:Price rising while money flow is red → Possible trap / early exit
Price dropping while money flow is green → Early accumulation
Combine this with anchor-trigger patterns and MTF trend support for spotting bottoms or tops early.
Final Tips
Use WT trigger crosses as initial signal. Confirm with money flow direction + color flip
Look at BBWP for breakout timing. Use table as your decision dashboard
Favor trades that align with MTF consensus

REV01 - Combined WT and SQZMOM Indicator and VWAP [KMARHOUMI]The Combined WaveTrend and Squeeze Momentum Indicator with VWAP (CWT_SQZMOM) is a powerful trading tool designed for traders looking to capitalize on market momentum and volatility squeezes, with the added insight of volume-weighted average price (VWAP) levels.
This custom indicator integrates three key components:
WaveTrend Oscillator: A momentum indicator that highlights potential reversal points in the market by identifying overbought and oversold conditions.
Squeeze
Momentum Indicator (SQZMOM): Identifies market consolidation periods (squeeze) and potential momentum breakouts, offering visual cues for significant price movements.
Volume-Weighted Average Price (VWAP): Provides a baseline measure of the average price based on volume, crucial for understanding market direction within a trading day.
Features
Visual Cues: Utilizes color-coded histograms, circles, and triangles to provide clear visual signals for trading opportunities.
Customizable Parameters: Allows traders to adjust input values for the WaveTrend Oscillator and Squeeze Momentum Indicator to fit various trading styles and timeframes.
Dynamic Indicators: Combines price momentum with volume data, offering a comprehensive view of market conditions.
How to Use
Setup: Apply the indicator to any chart in a trading platform that supports Pine Script (e.g., TradingView). Adjust the input parameters as needed to match your trading strategy and the asset's volatility.
Reading the Indicator:
WaveTrend Crossovers: Look for blue circles indicating a bullish crossover of the WaveTrend lines (wt1 crosses above wt2) and fuchsia circles for a bearish crossover (wt1 crosses below wt2). These points signal potential reversal opportunities.
Squeeze Momentum (SQZMOM): Green triangles at the bottom indicate a "Squeeze On" condition, suggesting market consolidation and potential for a breakout. Red triangles at the top signal a "Squeeze Off" condition, indicating the end of the squeeze and the start of a momentum phase.
VWAP: The price position relative to the VWAP line helps identify the overall market trend. Prices above VWAP may indicate bullish conditions, while prices below VWAP suggest bearish conditions.
Example Scenario for Going Long
Imagine the asset's price has been consolidating, and you observe a green triangle ("Squeeze On") at the bottom of the chart, indicating a potential breakout. Shortly after, a blue circle appears, signaling a bullish crossover in the WaveTrend Oscillator. If this crossover occurs above the VWAP line, it strengthens the signal for a long position. Traders might enter a long trade at this point, setting a stop loss below the recent low and a take profit at a previous resistance level or using a risk-reward ratio that suits their strategy.

CUO WITH BLUE BULL// Core Ultra Oscillator (CUO) with Blue Bull
//
// The Core Ultra Oscillator (CUO) is a technical analysis tool designed to identify potential trend reversals and breakout opportunities by combining momentum, volume, and divergence analysis.
// It aims to enhance divergence-based trading by incorporating additional filters to reduce false signals during strong market trends.
// The indicator integrates WaveTrend Oscillator, regular volume and Cumulative Volume Delta (CVD), generating unique divergence signals enhanced with trend filters to allow greater flexibility in trading style and market type.
//
// Key Features:
// - WaveTrend Oscillator: Plots momentum with customizable overbought and oversold levels, displaying buy (green dots) and sell (red dots) signals for prints in extreme zones.
// - Divergence Detection: Identifies regular and hidden bullish/bearish divergences on WaveTrend and CVD, using green/red lines to connect fractal points for potential trend reversals.
// - Cumulative Volume Delta (CVD): Measures buying and selling pressure with smoothed, normalized delta, enhanced by trend and slope filters for signal reliability.
// - Trend Shift Dots:
// - Green White Dot: Indicates the end of a bearish CVD trend, suggesting a potential bullish shift.
// - Black Dot (Red Center): Signals the end of a bullish CVD trend, indicating a potential bearish shift.
// - Seven Unique Dot Signals:
// - Blue Dot (Blue Bull): Highlights potential bullish breakouts based on accumulated momentum.
// - Yellow Dot (Gold Extreme Buy): Marks potential buying opportunities near market bottoms, often following an amber dot.
// - Purple Dot (Extreme Sell): Identifies high-probability sell signals using divergence and trend weakness filters.
// - Black Dot (Yellow Center): Targets first sign of weakness after a strong bullish trend ends, aiming to capture significant selloffs.
// - Dark Blue Dot: Signals peaks in oversold regions after a bullish trend has ended and momentum has flipped towards the bears.
// - Dark Grey Dot: Warns of potential tops via CVD bearish divergences, ideally confirmed with Purple Dot or regular divergences.
// - Amber Dot: Indicates potential bottoms via CVD bullish divergences, to be confirmed with Yellow Dot or regular divergences.
// - Comprehensive Alerts: Includes 15 alert conditions for WaveTrend, CVD, and dot signals to support real-time trading decisions.
//
// How to Use:
// - Apply the indicator to any chart to monitor momentum, volume, and divergences.
// - Adjust Trend momentum, WaveTrend, CVD, and trend thinning parameters through input settings.
// - Use dot signals and divergence lines to time trade entries and exits.
// - Configure alerts for real-time notifications of key signals.
//
// Note: This indicator is for informational purposes only and does not constitute financial advice. Users are encouraged to backtest thoroughly and evaluate the indicator’s performance in their trading strategy.
Market SniperThis Pine Script is a simplified trading algorithm designed to detect and signal potential buying and selling points based on the WaveTrend Oscillator and the volume traded.
Inputs and Setup:
The script initiates by defining key parameters: 'Wave Channel Length' (n1) set at 9 and 'Wave Average Length' (n2) set at 12. It also establishes a 'Volume Multiplier' (set at 2), and a 'Lookback Period' for volume calculation (set at 60 minutes). These values can be customized according to user preferences.
WaveTrend Oscillator Calculation:
It then calculates the WaveTrend Oscillator. The WaveTrend Oscillator is a momentum-based indicator that determines trend direction and potential reversal points. This is accomplished by applying an exponential moving average (EMA) and a simple moving average (SMA) to the average price data.
Volume Average Calculation:
Simultaneously, the script calculates the simple moving average of the volume over the defined 'Lookback Period'.
Buy and Sell Signals Definition:
The core of the trading signals lies in the crossing of the two lines of the WaveTrend Oscillator (wt1 and wt2) and whether the volume is higher than a certain threshold (defined by the 'Volume Multiplier' times the average volume). Specifically:
A 'Buy' signal is defined when the wt1 line crosses up the wt2 line and the volume is greater than the 'Volume Multiplier' times the average volume.
Conversely, a 'Sell' signal is defined when the wt1 line crosses down the wt2 line and the volume is greater than the 'Volume Multiplier' times the average volume.
Signal Plotting and Alert Creation:
Each time a 'Buy' or 'Sell' condition is met, the script plots a corresponding label directly on the price chart: a 'Buy' label below the bars for buy signals, and a 'Sell' label above the bars for sell signals. Additionally, it sets alerts based on these 'Buy' and 'Sell' signals with corresponding messages.
TradingWolf Premium OscillatorsThe TradingWolf Premium Oscillators is a unique and enhanced selection of oscillators designed to help give you an edge on the markets.
Within this one indicator you will have access to RSI, Stochastic, MACD, Awesome Oscillator, Wavetrend, Zig Zag Pivots and DPO.
Including Divergence and Hidden Divergence signals for them.
Below each indicator is explained along with its enhancements to help you understand it better.
This script comes with the 'TradingWolf Premium' to get access, read the Author’s Instructions below.
There are extensive explanations on how to use these oscillators in our documentation on the website but we will give a simple overview here.
RSI
We try not to mess with these too much because if used correctly, they are very powerful tools. The main differences you will notice is that we have highlighted the areas where you should be paying attention to the oscillator with reversal/continuation zones.
The most popular feature from these will be the 4 divergences which can be toggled on or off in the settings.
Stochastic
Stochastic we have tried to keep as similar to the original as possible, main features are being able to select alternate timeframes for it to be calculated on as well as displaying divergences.
We have created a highlighted zone for when price enters the overbought/sold territory. A lot of traders will look for crossovers happening in these areas however from our tests we have discovered entering trades as the Stochastic comes out of these areas has hugely reduced losing trades, still not a perfect strategy but it does often show that the trend is showing weakening momentum and its commonly followed by a period of sideways action before continuing in a new direction.
MACD
We have calculated a dynamic extreme range for the MACD, you will notice the green/red bars as the bottom and top of the Oscillator. These levels help adjust with the assets volatility so they will work universally on all assets and timeframes. When these levels get more narrow, this indicates there is a potential larger move to come, similar thought process to a Bollinger band squeeze.
We like the Divergence signals you receive whilst in this OB/OS range as they give more confluence behind the divergence signal that price has over extended and is looking to retrace or consolidate.
Awesome Oscillator
The Awesome Oscillator is based on some pretty simple calculations but is hugely powerful.
The 3 main use cases are crossing the 0 value, showing weakening momentum and divergence signals.
We Particularly like the Divergence signals it gives us as they tend to be more accurate than any other oscillator.
Wavetrend
Wavetrend we try describe as a more dynamic Stochastic/MACD, it moves smoother and quicker without giving too many false signals.
Conditions we use the Wavetrend for are similar to the MACD where we are looking for crossovers or divergences in the extreme bands, these shouldn’t be used to trade alone and should be paired with other pieces of confluence for a higher probability trade however this is one of our favourites.
We also have a VWAP extreme detector which we pair with the Wavetrend, helping us identify areas where price should start cooling off.
Zig Zag
The main purpose of the standard Zig Zag is to analyse historical data to be able to observe cycle's in a market's movement, this requires a bit more explanation than we can include here so please refer to our documentation on the website for further guidance.
DPO
The detrended price oscillator is unlike other oscillators, such as the Stochastic or MACD the DPO is not a momentum indicator. It instead highlights peaks and troughs in price, which are used to estimate buy and sell points in line with the historical cycle.
We personally think this is the most under-rated oscillator out there, if you simply followed the DPO above 0 for long and below for short on higher timeframes you can outperform the buy and hold return of Bitcoin (BTCUSDT)...
This is just one simple way of using the DPO there are other more in depth methods of using it within our documentation.

AOT Red Storm V25 Adaptive EditionOverview
AOT Red Storm V25 is an invite-only, institutional-style trend suite designed for intraday and swing traders.
It does not try to predict exact tops or bottoms. Instead, it focuses on:
Multi-timeframe trend alignment
Smart 8-minute internal timeframe for cleaner structure
Adaptive support/resistance zones
Volatility and volume-based risk filtering
A compact HUD to summarize market state in one glance
Core Components
This script is not a simple mashup of public indicators.
It integrates several classic building blocks into a single, coherent decision framework:
Adaptive Supertrend Core:
Supertrend is calculated on an internal 8-minute timeframe (for intraday charts up to 60m), which we found offers a better balance between noise and structure for crypto futures.
WaveTrend Tactical Radar:
WaveTrend is only used for exit timing and risk-off zones (overheat / exhaustion), not as a standalone entry trigger. It works together with the trend core and cooldown logic.
Dual-Layer Support & Resistance:
Local SR zones are drawn on the current chart for execution precision, while 30m-level zones track higher-timeframe liquidity and turning areas.
Trendlines & Structural BOS:
Automatic trendlines and BOS (Break of Structure) are derived from pivot points, to visualize trend continuation vs. potential reversals.
Volatility & Volume Risk Filter:
Abnormal range bars and daily volume completion are monitored to help traders avoid chasing dangerous moves.
AI-style HUD Panel:
The on-chart HUD summarizes trend, momentum, volatility, and volume completion into a compact dashboard so traders don’t need to open multiple indicators.
How it works in practice
The 8-minute engine drives the main trend color and entry markers.
Local & 30m SR zones provide execution context and profit-taking areas.
WaveTrend helps identify when to reduce risk or take partial profits during extended moves.
The HUD acts as a “mission control” view to keep the trader aligned with the dominant state of the market.
Intended Use
For traders who already understand risk management and position sizing.
As a decision support tool, not as an auto-trading holy grail.
Best used on BTC/ETH futures from 1m–30m charts.
What it is NOT
It is not a guaranteed-profit system.
It is not an AI that predicts the future.
It does not replace your own risk control or psychology.
Risk Notice
Trading and investing involve risk. Historical behavior of any logic or visual structure does not guarantee future results. This script is for informational and educational purposes only and does not constitute financial advice.
概览
AOT Red Storm V25 是一套面向实盘交易员的“机构级趋势可视化套件”,采用封闭源码 + 邀请制。
它不是在“预测行情”,而是帮助你:
对齐多周期趋势结构
用 8 分钟内部周期做更干净的趋势骨架
叠加本地 + 30m 双重支撑阻力
利用波动率和成交量过滤危险行情
用一个 HUD 面板把核心信息集中展示
核心模块
8m SuperTrend 趋势骨架:内部固定使用 8 分钟周期来做趋势与结构识别,减少噪音。
WaveTrend 战术雷达:只用于辅助止盈/减仓,而不是单独进场信号。
本地 + 30m 支撑阻力区:当前周期做精确执行,30m 负责定位大级别流动性区域。
自动趋势线 + BOS:用结构高低点标记 HH/LL / BOS,辅助趋势延续与反转识别。
波动 & 量能风控:用异常大K / 当日量能进度,提示极端风险。
AI 风格 HUD 面板:把趋势、动能、波动率、量能等压缩在一个信息面板中。
适用人群
有一定交易经验,重视风控与执行纪律的交易员;
用作决策辅助,而不是“闭眼跟随”的圣杯系统;
建议用于 BTC/ETH 永续 1–30m 等周期。
不是什么
不保证稳定盈利;
不预测未来;
不替代你的仓位管理与心理建设。

Sk Macd TrendSk Macd Trend + Hidden Bullish MACD Divergence (Enhanced)
Original Author: Sujeetjeet1705
Enhanced by: Community Contribution (MACD-style Hidden Bullish Signal)
A powerful and widely respected WaveTrend-based oscillator with all the original premium features intact:
• Laguerre-smoothed WaveTrend (WT1 & WT2)
• Professional 4-color momentum histogram (strong/weak bull & bear)
• Filled MACD/Signal area for instant trend bias
• Built-in regular + hidden divergences (signal & histogram)
• Smart trailing stop system with ATR-based dynamic stops
• Clean buy/sell cross signals with overbought/oversold filtering
NEW POWERFUL ADDITION:
Hidden Bullish MACD-Style Divergence Detector
(Exactly like institutional MACD hidden bullish setups)
The indicator now highlights — with a bright blue histogram bar and a blue square below the price candle — when ALL three high-probability conditions are met simultaneously:
1. WaveTrend Histogram (wt3) is below zero (still in bearish territory)
2. Histogram is rising (wt3 > wt3 ) → momentum turning up
3. Price makes a higher low (low > low ) → bullish hidden divergence
This is one of the strongest early-reversal signals in technical analysis and often marks the exact bottom before explosive bounces.
Key Features:
• Blue square appears directly on the main chart (overlay)
• Histogram turns solid blue only on valid setups (very easy to spot)
• No repainting — 100% real-time reliable
• Works perfectly on all timeframes and assets
• All original features, colors, and logic preserved
Perfect for swing traders, reversal hunters, and anyone looking to catch major turns early.
Use with confidence — this is now one of the most complete and visually intuitive WaveTrend oscillators available on TradingView.
Enjoy the edge!

CryptoGraph Entry BuilderA complete system to generate buy & sell signals, based on multiple indicators, timeframes and assets
═════════════════════════════════════════════════════════════════════════
🟣 How it works
This indicator allows you to create buy & sell signals, based on multiple trigger conditions, placed in one easy to use TradingView indicator to produce alerts, backtest, reduce risk and increase profitability. This script is especially designed to be used with the CryptoGraph Strategizer indicator. Signals produced by this indicator, can be used as external input with the CryptoGraph Strategizer, by adding both indicators to your chart and selecting "External Input" as entry source in the inputs of the Strategizer indicator. From that point on, buy & sell signals generated by the Entry Builder, will be used for backtesting.
Each trigger or filtering condition is selectable and able to be combined using the selection boxes.
Trigger or filter conditions can be used on a different timeframes, and with different assets or coin pairs. Make sure to set higher timeframe filters, to a higher timeframe than your chart timeframe.
🟣 How to use
• Add the indicator to your chart
• Select an indicator you woud like to use for entry analysis. Combine more indicators for more entry filtering
• Configure entry conditions per indicator. It is recommended to add and configure one indicator at a time
• Analyse your buy/sell entries
• Connect to CryptoGraph Strategizer as external input source for backtesting purposes
🟣 Indicator Filters
• ATR :
Average True Range (ATR) is a tool used in technical analysis to measure volatility .
Possible options for ATR entry filtering are an ATR value greater/smaller than your input variable for trade entries, or the ATR crossing your input variable for trade entries.
This enables the possibility to only enter positions when the market has a certain degree of volatility .
• ADX :
The Average Directional Index ( ADX ) helps traders determine the strength of a trend, not its actual direction. It can be used to find out whether the
market is ranging or starting a new trend.
Possible options for ADX entry filtering are an ADX value greater/smaller than your input variable for trade entries, or the ADX crossing your input variable for trade entries.
• OBV :
The On Balance Volume indicator (OBV) is used in technical analysis to measure buying and selling pressure. It is a cumulative indicator meaning that on days where price went up, that day's volume is added to the cumulative OBV total.
Possible options for OBV entry filtering are Regular, Hidden or Regular&Hidden divergences. Divergence is when the price of an asset is moving in the opposite direction of a technical indicator, such as an oscillator, or is moving contrary to other data. Divergence warns that the current price trend may be weakening, and in some cases may lead to the price changing direction.
• Moving Average :
Moving Average (MA) is a price based, lagging (or reactive) indicator that displays the average price of a security over a set period of time. A Moving Average is a good way to gauge momentum as well as to confirm trends, and define areas of support and resistance .
Possible options for MA entry filtering are price being above/below Moving Average 1, price crossing up/down Moving Average 1, Moving Average 1 being above/below Moving Average 2 and Moving Average 1 crossing up/down Moving Average 2.
• Supertrend :
Supertrend (ST) is a trend-following indicator based on Average True Range (ATR). The calculation of its single line combines trend detection and volatility . It can be used to detect changes in trend direction and to position stops.
Possible options for ST entry filtering are Supertrend being in upward/downward direction, or Supertrend changing direction.
• RSI :
The Relative Strength Index ( RSI ) is a well versed momentum based oscillator which is used to measure the speed (velocity) as well as the change (magnitude) of directional price movements.
Possible options for RSI entry filtering are RSI being smaller/greater than your input value, or RSI crossing up/down your input value.
• Stochastic RSI :
The Stochastic RSI indicator ( Stoch RSI ) is essentially an indicator of an indicator. It is used in technical analysis to provide a stochastic calculation to the RSI indicator. This means that it is a measure of RSI relative to its own high/low range over a user defined period of time.
Possible options for Stoch RSI entry filtering are Stoch RSI crossing below or above your input value.
• VWAP Bands :
Volume Weighted Average Price ( VWAP ) is a technical analysis tool used to measure the average price weighted by volume . VWAP is typically used with intraday charts as a way to determine the general direction of intraday prices.
We use standard deviations, determined by user input, to create VWAP bands.
Possible options for VWAP long entry filtering are: price being below the lower VWAP band, price crossing back up the lower VWAP band or price crossing down the lower VWAP band.
Possible options for VWAP short entry filtering are: price being above the upper VWAP band, price crossing back down the upper VWAP band, or price crossing up the upper VWAP band.
• Bollinger Bands :
Bollinger Bands (BB) are a widely popular technical analysis instrument created by John Bollinger in the early 1980’s. Bollinger Bands consist of a band of three lines which are plotted in relation to security prices. The line in the middle is usually a Simple Moving Average ( SMA ) set to a period of 20 days (the type of trend line and period can be changed by the trader; however a 20 day moving average is by far the most popular).
Possible options for BB long entry filtering are: price being below the lower Bollinger band , price crossing back up the lower Bollinger band or price crossing down the lower Bollinger band .
Possible options for BB short entry filtering are: price being above the upper Bollinger band , price crossing back down the upper Bollinger band , or price crossing up the upper Bollinger band .
• WaveTrend :
WaveTrend (WT) is a smoothed momentum oscillator which enables it to detect true reversals in an accurate manner.
Possible options for WT entry filtering are: Green/red dots below or above a certain WaveTrend value, Regular Divergence, Hidden Divergence and Regular&Hidden Divergence.

Minimal Godmode 2.1// Acknowledgments:
// Original Godmode Authors:
// @Legion, @LazyBear, @Ni6HTH4wK, @xSilas
// Drop a line if you use or modify this code.
// Godmode 3.1.4: @SNOW_CITY
// Godmode 3.2: @sco77m4r7in and @oh92
// Godmode3.2+LSMA: @scilentor
// Godmode 4.0.0-4.0.1: @chrysopoetics
// Jurik Moving Average: @everget
// Constance Brown Composite Index RSI: @LazyBear
// Wavetrend Oscillator: @fskrypt
// TTM Squeeze: @Greeny
// True TSI/RSI: @cI8DH and @chrysopoetics
// Laguerre RSI (Self-Adjusting Alpha with Fractals Energy): @everget
// RSI Shaded: @mortdiggiddy
// Minimal Godmode v2.0:
// 6 BTC pairs/exchanges (instead of 11) to reduce loading time from the pinescript security() function
// Volume Composite for engine calculation
// TTM Squeeze on Wavetrend Signal
// Constance Brown Composite Index RSI (CBCI)
// TrueTSI (Godmode 4.0.0 implementation)
// Laguerre RSI (LRSI)
// Minimal Godmode v2.1:
// Removed TTM Squeeze and Volume Composite
// EMA for Wavetrend Signal
// Multi-exchange for BTC no longer the default
// mg engine toggle for CBCI, Laguerre RSI, and TTSI
// Wavetrend Histogram component toggle
NEURAL FLOW INDEX — Core Energy • Momentum Stream • Pulse SyncNeural Flow Index (NFI) — Advanced Triple-Layer Reversal Framework
The Neural Flow Index (NFI) is a next-generation market oscillator designed to reveal the hidden synchronization between trend energy, cyclical momentum, and internal pulse dynamics.
It merges three powerful analytical layers into a single, normalized view:
Core Energy Curve (based on RSO logic) — captures structural trend bias and volatility expansion.
Momentum Stream (WaveTrend algorithm) — visualizes cyclical motion of price waves.
Pulse Sync (Stochastic RSI adaptation) — measures short-term momentum rhythm and overextension.
Each layer feeds into a unified flow model that adapts to both trend-following and reversal conditions. The goal is not to chase every fluctuation, but to sense where momentum, direction, and volatility converge into true inflection points.
Conceptual Mechanics
The oscillator translates complex market behavior into an elegant, multi-phase signal system:
Core Energy Curve (RSO foundation):
A smoothed dynamic field representing the overall strength and direction of market pressure.
Green energy indicates expansion (bullish dominance); red energy reflects contraction (bearish decay).
Momentum Stream (WaveTrend):
The teal line functions like an electro-wave, oscillating through phases of expansion and exhaustion.
It provides the heartbeat of the market — smooth, rhythmic, and beautifully cyclic.
Pulse Sync (Stochastic RSI):
The purple line acts as the market’s nervous pulse, reacting to micro-momentum changes before the larger trend adjusts.
It identifies micro-tops and micro-bottoms that precede major trend shifts.
When these three forces align, they create high-probability reversal zones known as Neural Nodes — regions where energy, momentum, and rhythm converge.
Trading Logic
Potential Entry Zones:
When the purple Pulse Sync line crosses the green Momentum Stream near the lower or upper bounds of the oscillator, a potential turning point forms.
Yet, these crossovers are only validated when the Core Energy histogram (RSO) simultaneously supports the same direction — confirming that energy and rhythm are synchronized.
Histogram Confirmation:
The histogram is the “voice” of the oscillator.
Rising green volume within the histogram during a Pulse-Momentum crossover suggests a legitimate upward reversal.
Conversely, expanding red energy during an upper-band cross indicates momentum exhaustion and an early short-side opportunity.
Neutral Zones:
When all three layers flatten near the zero line, the market enters an equilibrium phase — no clear trend dominance, ideal for patience and re-entry planning.
| Layer | Representation | Color | Function |
| --------------------- | ------------------- | ----------------- | ------------------------------ |
| **Core Energy Curve** | Area / Histogram | Lime-Red gradient | Trend bias & volatility energy |
| **Momentum Stream** | WaveTrend line | Teal | Cyclical flow of price |
| **Pulse Sync** | Stochastic RSI line | Purple | Short-term momentum rhythm |
Interpretation Summary
Converging Waves: Trend, momentum, and pulse move together → strong continuation.
Diverging Waves: Pulse or Momentum decouple from Core Energy → early reversal warnings.
Histogram Expansion: Confirms direction and strength of the new wave.
Crossovers at Extremes: Potential entries, especially when confirmed by energy alignment.
🪶 Philosophy Behind NFI
The Neural Flow Index is not just a technical indicator — it’s a behavioral visualization system.
Instead of focusing on lagging confirmations, it captures the neural pattern of price motion:
how liquidity flows, contracts, and expands through time.
It bridges the gap between pure mathematics and market intuition — giving traders a cinematic, harmonic view of energy transition inside price structure.

WT + Stoch RSI Reversal Combo📊MR.Z RSI : WT + Stochastic RSI Reversal Combo
This custom indicator combines WaveTrend oscillator and Stochastic RSI to detect high-confidence market reversal points, filtering signals so they only appear when both indicators align.
🔍 Core Components:
✅ WaveTrend Oscillator
Based on smoothed deviation from EMA (similar to TCI logic)
Plots:
WT1 (main line)
WT2 (signal line = SMA of WT1)
Uses overbought/oversold thresholds (default: ±53) to filter signals
✅ Stochastic RSI
Momentum oscillator based on RSI's stochastic value
Plots:
%K: smoothed Stoch of RSI
%D: smoothed version of %K
Adjustable oversold/overbought thresholds (default: 20/80)
🔁 Combined Reversal Signal Logic:
🔼 Buy Signal
WT1 crosses above WT2 below WT oversold level (e.g., -53)
%K crosses above %D below Stoch RSI oversold level (e.g., 20)
🔽 Sell Signal
WT1 crosses below WT2 above WT overbought level (e.g., 53)
%K crosses below %D above Stoch RSI overbought level (e.g., 80)
🔔 Signals are only plotted and alerted if both conditions are true.
📌 Features:
Toggle on/off:
WaveTrend lines and histogram
Stochastic RSI
Combined Buy/Sell signals
Horizontal reference lines (±100, OB/OS)
Fully customizable smoothing lengths and thresholds
Signal plots:
✅ Green up-triangle = Combo Buy
✅ Red down-triangle = Combo Sell
Optional: Circle/cross markers for WT-only and Stoch-only signals
🔔 Built-in alerts for Buy/Sell signals
📈 Use Cases:
Reversal Trading: Wait for both indicators to confirm momentum shift
Entry Filter: Use in combination with trend indicators (like EMA)
Scalping or Swing: Works on intraday and higher timeframes

Gaussian RSI For Loop [TrendX_]The Gaussian RSI For Loop indicator is a sophisticated tool designed for trend-following traders seeking to identify strong uptrends in the market. By integrating a Gaussian and Weighted-MA (GWMA) with the Relative Strength Index (RSI), this indicator employs a loop-based scoring system to provide clear signals for potential trading opportunities. The combination of Gaussian smoothing techniques and overbought/oversold filtering enhances the indicator's ability to capture significant price movements while reducing noise, making it an optimal choice for traders aiming to capitalize on robust upward trends.
💎 KEY FEATURES
Gaussian Weighted Moving Average (GWMA): Smooths price data to reduce noise and enhance responsiveness to significant price changes.
Filtered RSI: Applies the RSI to Gaussian-filtered data, allowing for more accurate momentum readings.
Wavetrend Analysis: Calculates the difference between the Filtered RSI and its short-term moving average, providing additional insights into momentum shifts.
Loop-Based Scoring System: Evaluates the strength and direction of uptrends through a systematic analysis of the Filtered RSI against defined thresholds.
⚙️ USAGES
Identifying Strong Uptrends: Traders can use this indicator to pinpoint periods of strong upward momentum, helping them make informed decisions about entering long positions and its exits.
Trend and Signal Confirmation: The Score confirms Long and Exit signals which traders can see through the Dots on the Gaussian RSI.
🔎 BREAKDOWN
Gaussian-Filtered Data:
The first component of the Gaussian RSI For Loop is the application of a GWMA to the sourced price data. This smoothing technique uses weighted averages based on a Gaussian distribution, which emphasizes more recent prices while diminishing the impact of older prices. This GWMA effectively reduces market noise, allowing traders to focus on significant price movements. By adjusting weights using sigma parameters, traders can fine-tune the sensitivity of the indicator, making it more responsive to genuine market trends while filtering out minor fluctuations that could lead to misleading signals.
Filtered RSI:
Next, the RSI is applied to the Gaussian-filtered data. The RSI measures the speed and change of price movements, providing insights into overbought or oversold conditions. By applying the RSI to smoothed price data, traders obtain a clearer view of momentum without the distortion caused by sudden price spikes or drops. This results in more reliable readings that help identify potential trend reversals or continuations.
Wavetrend Analysis:
The Wavetrend component calculates the difference between the Filtered RSI and its short-term moving average (MA). This difference serves as an additional momentum indicator. When the Filtered RSI is above its short-term MA, it suggests that upward momentum is strengthening; conversely, when it falls below, it indicates weakening momentum. This analysis helps traders confirm whether an uptrend is gaining strength or losing traction.
Loop-Based Scoring System:
Range Analysis: The system evaluates the Filtered RSI by comparing its current value against overbought (OB) and oversold (OS) thresholds over a defined range. This systematic approach ensures that each value within this range contributes to understanding overall trend strength.
Score Calculation: As the loop iterates through values within the defined range, it adjusts a score based on whether the current Filtered RSI and its previous values are higher or lower than established OB and OS levels. This scoring mechanism quantifies trend strength and direction.
Strong Uptrend Trigger: A strong uptrend signal is generated when the score exceeds a predefined Score Threshold (Long). This indicates that bullish momentum is robust enough to warrant entry into long positions.
None Trend: Conversely, if the score falls below the Score Threshold (Short), it suggests that upward momentum has weakened significantly, signaling potential exit points and it can be consolidated or downtrend.
DISCLAIMER
This indicator is not financial advice, it can only help traders make better decisions. There are many factors and uncertainties that can affect the outcome of any endeavor, and no one can guarantee or predict with certainty what will occur. Therefore, one should always exercise caution and judgment when making decisions based on past performance.

[volfgang] WAVEA compass to the financial charts.
The Volfgang WAVE Indicator helps you to decode complex market trends and make informed decisions in your trading.
Quick Summary
The WAVE has a signal line which alternates between Red or Blue.
Red is bearish and Blue is bullish.
It turns Blue when the WAVE line crosses above the signal and holds for 1 bar.
it turns Red when the WAVE line crosses below the signal and holds for 1 bar.
(You can change the signal line’s length in the settings, the default is 3 which is suited towards Day Trading – For Swing Traders I recommend 4 or 5 – For Investors 6 to 9).
The WAVE line will change colour to alert you when price is potentially pivoting.
When the WAVE is WHITE, the trend is currently Bearish but could flip bullish soon.
When the WAVE is GREEN, the trend is Bullish and there is strong Bullish momentum.
When the WAVE is ORANGE, it means trend is bullish but there is danger of a Bearish Reversal.
When the WAVE is PINK it means there is strong Bearish Momentum.
WAVETrend Scanner
The WAVETrend Scanner can be enabled in the settings and gives you a quick overview of the current trend across 8 potential timeframes:
You can use this to make sure the trades you are taking on lower timeframes align with the current bias on higher term timeframes, thus ensuring a higher chance of success.
WAVE Colours
The background colour of the WAVE also changes according to the current trend across multiple timeframes. The scanner is constantly measuring the current trend across 7 timeframes;
When 4 timeframes line up Bullish, the WAVE is LIGHT BLUE (Cyan)
When 5 timeframes line up Bullish, the WAVE is DARK BLUE (Navy)
When 6+ timeframes line up Bullish, the WAVE is GREEN
When 4 timeframes line up Bearish, the WAVE is ORANGE
When 5 timeframes line up Bearish, the WAVE is RED
When 6+ timeframes line up Bearish, the WAVE is PINK
Divergence Checker & Buy/Sell Signals
The BUY and SELL Signals are represented by a BLUE or RED Histogram line that extends from the WAVE to the 0 Line.
A BUY signal shows when a Crossover occurs & there is a Bullish Diversion Present within the last 50 bars.
A SELL signal appears when a Crossunder occurs & there is Bearish Diversion present within the last 50 bars.
You can change the length of the Divergence Checker in the settings, default is 50 bars.
Under The Hood
The WAVE pulls information from multiple sources within a set period such as;
Close Price
Highest Price
Lowest Price
EMA
The script applies a set of complicated algebraic equations. Which essentially measures the and of recent price action.
Then it uses EMA's to measure from the and , whilst applying more weight to recent price action.
The functions then calculate more averages which measure the difference from and .
Next, it uses all of these calculated averages to create a value that represents the current WAVE condition. This calculation will determine whether the WAVE is in a bullish or bearish trend.
This sum is then smoothed out to get one more value, which is used to display the info box content that allows us to see exactly at what price the WAVE will keep rising or keep falling.
One final calculation also predicts the point at which the WAVE will flip trend. It uses similar calculations to the "Keep Rising/Falling" prediction function, but its aim is to predict the exact price at which the WAVE will cross.
What gives the WAVE indicator an edge over most Stochastic Indicators, is how it uses Pinescript's "request.security" function to pull information from multiple timeframes in order to generate plots, info data and colours to add much more relevant information to the chart which you can use to make informed trading decisions. This is what allows the WAVETrend Scanner to work.
The WAVE indicator is designed to work with all markets and asset types.

Black MACDBlack MACD is combination of MACD / Awesome Oscillator / Wavetrend Oscillator / BB Squeeze (Multi Oscillator) with many features like Multi Symbol support, Dual Divergence, MACD Cross over/under and completely customizable.
MACD Oscillator
Awesome Oscillator
Wavetrend Oscillator
Bollinger Bands Squeeze
Multi Symbol
Dual Divergence
MACD Cross over/under
Full Customization
Multi Symbol
Bollinger Bands Squeeze
Dual Divergence
MACD Cross
Awesome Oscillator
Wavetrend Oscillator
What is Moving Average Convergence Divergence – MACD?
The most popular indicator used in technical analysis, Moving average convergence divergence ( MACD ) reveal changes in the strength, direction, momentum, and duration of a trend in a financial instrument’s price. It's a trend-following momentum indicator that shows the relationship between two moving averages of a security’s price. The MACD is calculated by subtracting the 26-period exponential moving average ( EMA ) from the 12-period EMA.
The MACD indicator is typically good for identifying three types of basic signals;
Signal Line Crossovers
A Signal Line Crossover is the most common signal produced by the MACD . On the occasions where the MACD Line crosses above or below the Signal Line, that can signify a potentially strong move. The standard interpretation of such an event is a recommendation to buy if the MACD line crosses up through the Signal Line (a "bullish" crossover), or to sell if it crosses down through the Signal Line (a "bearish" crossover). These events are taken as indications that the trend in the financial instrument is about to accelerate in the direction of the crossover.
Zero Line Crossovers
Zero Line Crossovers occur when the MACD Line crossed the Zero Line and either becomes positive (above 0) or negative (below 0). A change from positive to negative MACD is interpreted as "bearish", and from negative to positive as "bullish". Zero crossovers provide evidence of a change in the direction of a trend but less confirmation of its momentum than a signal line crossover
Divergence
Divergence is another signal created by the MACD . Simply, divergence occurs when the MACD and actual price are not in agreement. A "positive divergence" or "bullish divergence" occurs when the price makes a new low but the MACD does not confirm with a new low of its own. A "negative divergence" or "bearish divergence" occurs when the price makes a new high but the MACD does not confirm with a new high of its own. A divergence with respect to price may occur on the MACD line and/or the MACD Histogram
Moving Average Crossovers, another hidden signal that MACD Indicator identifies
Many traders will watch for a short-term moving average to cross above a longer-term moving average and use this to signal increasing upward momentum. This bullish crossover suggests that the price has recently been rising at a faster rate than it has in the past, so it is a common technical buy sign. Conversely, a short-term moving average crossing below a longer-term average is used to illustrate that the asset's price has been moving downward at a faster rate and that it may be a good time to sell.
Moving Average Crossovers in reality is Zero Line Crossovers, the value of the MACD indicator is equal to zero each time the two moving averages cross over each other. For easy interpretation by trades, Zero Line Crossovers are simply described as positive or negative MACD
False signals
Like any forecasting algorithm, the MACD can generate false signals. A false positive, for example, would be a bullish crossover followed by a sudden decline in a financial instrument. A false negative would be a situation where there is bearish crossover, yet the financial instrument accelerated suddenly upwards
What is Awesome Oscillator?
The Awesome Oscillator is an indicator used to measure market momentum. AO calculates the difference of a 34 Period and 5 Period Simple Moving Averages. The Simple Moving Averages that are used are not calculated using closing price but rather each bar's midpoints. AO is generally used to affirm trends or to anticipate possible reversals.
Disclaimer: DYOR. Not financial advice. Not a trading system. I am not affiliated with TradingView or any authors mentioned here; You alone have the sole responsibility of evaluating the script output and risks associated with the use of the script. Trading success is all about following your trading strategy and the indicators should fit within your trading strategy, and not to be traded upon solely. Always trade with confluence and Risk Management.
Feedback & Bug report
if you found any bug in this indicator or any suggestion, please let me know. Please give feedback & appreciate if you like to see more future updates and indicators. Thank you
Check out Black RSI indicator:

Black Arrow Wave Trend
Summary:
Goal was to add FIB Levels to the "WaveTrend with Crosses ". This tool is trying to identify if FIB levels in the "WaveTrend" oscillator has any relation to price action in candles.
Details:
1) Made FIB levels adjustable in the input sections under settings. Adjust to your needs.
2) Blue ribbon represents bullish waves and red ribbons represents bearish waves.
3) Purple line is at .5 "Fair Value", Two Gold lines represent "Golden Pocket", Red line represents the .786
How to use:
1) Observe either bullish or bearish waves enter FIB levels that are color coded.
2) Observe as momentum slows if following waves mark lower FIB levels.
3) Zero line is at the bottom color = grey.
4) As momentum ribbons momentum slows, this may indicate a reversal in momentum.
Probability levels:
1) Lowest: Purple line is "Fair Value" at 50% pullback. Reversal in momentum chance is weak.
2) Medium: Gold Double lines are the "Golden Pocket". Reversal in momentum chance is medium.
3) Highest: Red Line as a higher Probability for a Reversal in momentum.
Please let me know if there are any changes or items I should add.
This would be best used if combined with a support and resistance indicator.

WTC Step Buy Step Edition CbyCarlo📊 WT Cross Modified – Step Buy Step Edition (v4)
WTC_StepBuyStep_Edition is an enhanced, practical, and optimized version of the classic WaveTrend (WT) Cross Indicator.
Developed for the Step Buy Step project, this tool helps traders identify market momentum shifts, structural price zones, and potential reversal areas with high clarity and precision.
🔍 Concept & Purpose
This indicator builds upon the established WaveTrend / LazyBear logic and extends it with additional structural intelligence.
The goal is to make overbought/oversold phases and trend reversals easier to spot — while also highlighting historically validated price zones where the market has previously reacted strongly.
⚙️ Key Features
1️⃣ WT Cross Signals
WT1 (yellow) and WT2 (purple) visualize market momentum.
A WT1 cross above WT2 while below the Oversold zone (−53) can indicate potential Long opportunities.
A WT1 cross below WT2 while above the Overbought zone (+53) can indicate potential Short opportunities.
Signals only confirm after candle close to prevent repainting.
2️⃣ Dynamic “WT SignalZone” Panel
Displayed in the top-right corner, this panel shows the last three valid price levels derived from WT signals:
🟢 LonLev – Buy support levels from previous WT Long signals
🔴 ShoLev – Sell resistance levels from previous WT Short signals
These zones act as objective support/resistance structures, based on historical momentum turning points — not subjective lines.
3️⃣ Flexible Calculation Modes
Choose how levels are derived from each WT signal:
Pullback 50% → Midpoint of the signal candle (high+low)/2
Close → Close price of the signal candle
Next Open → Open of the following bar (ideal for system testing)
📈 How to Interpret the Indicator
Market Condition WT Event Meaning
WT1 < −53 & CrossUp Long Signal Potential reversal / buy zone
WT1 > +53 & CrossDown Short Signal Potential exhaustion / sell zone
Price revisits LonLev Support Re-entry or bounce zone
Price revisits ShoLev Resistance Profit-taking or short setup zone
This makes the tool highly effective for:
Swing traders
Zone-based trading strategies
Systematic re-entries
Identifying structural turning points
🧠 Advantages
No repainting (signals confirmed only after bar close)
Works on all timeframes (from intraday to weekly)
Clean overview without clutter or excessive chart markers
Excellent as a filter to confirm market context
💬 Best Use Case
Use WTC_StepBuyStep_Edition as a contextual confirmation tool.
It does not replace a full trading system — but it gives you objective, repeatable, and statistically relevant zones where the market has reacted before.
Combine it with price action, volume analysis, or trend tools for even stronger setups.
© Step Buy Step • Step-Buy-Step.com
Educational trading tool intended for market analysis.
Not financial advice.

Tunç ŞatıroğluTunç Şatıroğlu's Technical Analysis Suite
Description:
This comprehensive Pine Script indicator, inspired by the technical analysis teachings of Tunç Şatıroğlu, integrates six powerful TradingView indicators into a single, user-friendly suite for robust trend, momentum, and divergence analysis. Each component has been carefully selected and enhanced by beytun to improve functionality, performance, and visual clarity, aligning with Şatıroğlu's approach to technical analysis. The default configuration is meticulously set to match the exact settings of the individual indicators as used by Tunç Şatıroğlu in his training, ensuring authenticity and ease of use for followers of his methodology. Whether you're a beginner or an experienced trader, this suite provides a versatile toolkit for analyzing markets across multiple timeframes.
Included Indicators:
1. WaveTrend with Crosses (by LazyBear, modified): A momentum oscillator that identifies overbought/oversold conditions and trend reversals with clear buy/sell signals via crosses and bar color highlights.
2. Kaufman Adaptive Moving Average (KAMA) (by HPotter, modified): A dynamic moving average that adapts to market volatility, offering a smoother trend-following signal.
3. SuperTrend (by Alex Orekhov, modified): A trend-following indicator that plots dynamic support/resistance levels with buy/sell signals and optional wicks for enhanced accuracy.
4. Nadaraya-Watson Envelope (by LuxAlgo, modified): A non-linear envelope that highlights potential reversals with customizable repainting options for smoother outputs.
5. Divergence for Many Indicators v4 (by LonesomeTheBlue, modified): Detects regular and hidden divergences across multiple indicators (MACD, RSI, Stochastic, CCI, Momentum, OBV, VWMA, CMF, MFI, and more) for early reversal signals.
6. Ichimoku Cloud (TradingView built-in, modified): A multi-faceted indicator for trend direction, support/resistance, and momentum, with enhanced visuals for the Kumo Cloud.
Key Features:
- Authentic Default Settings : Pre-configured to mirror the exact parameters used by Tunç Şatıroğlu for each indicator, ensuring alignment with his proven technical analysis approach.
- Customizable Settings : Enable/disable individual indicators and fine-tune parameters to suit your trading style while retaining the option to revert to Şatıroğlu’s defaults.
- Enhanced User Experience : Modifications improve visual clarity, performance, and usability, with options like repainting smoothing for Nadaraya-Watson and adjustable Ichimoku projection periods.
- Multi-Timeframe Analysis : Combines trend-following, momentum, and divergence tools for a holistic view of market dynamics.
- Alert Conditions : Built-in alerts for SuperTrend direction changes, buy/sell signals, and divergence detections to keep you informed.
- Visual Clarity : Overlays (KAMA, SuperTrend, Nadaraya-Watson, Ichimoku) and pane-based indicators (WaveTrend, Divergences) are clearly distinguished, with customizable colors and styles.
Notes:
- The Nadaraya-Watson Envelope and Ichimoku Cloud may repaint in their default modes. Use the "Repainting Smoothing" option for Nadaraya-Watson or adjust Ichimoku settings to mitigate repainting if preferred.
- Published under the MIT License, with components licensed under GPL-3.0 (SuperTrend), CC BY-NC-SA 4.0 (Nadaraya-Watson), MPL 2.0 (Divergence), and TradingView's terms (Ichimoku Cloud).
Usage:
Add this indicator to your TradingView chart to leverage Tunç Şatıroğlu’s exact indicator configurations out of the box. Customize settings as needed to align with your strategy, and use the combined signals to identify trends, reversals, and divergences. Ideal for traders following Şatıroğlu’s methodologies or anyone seeking a powerful, all-in-one technical analysis tool.
Credits:
Original authors: LazyBear, HPotter, Alex Orekhov, LuxAlgo, LonesomeTheBlue, and TradingView.
Modifications and integration by beytun .
License:
Published under the MIT License, incorporating code under GPL-3.0, CC BY-NC-SA 4.0, MPL 2.0, and TradingView’s terms where applicable.

Aethix Cipher Pro2Aethix Cipher Pro: AI-Enhanced Crypto Signal Indicator grok Ai made signal created for aethix users.
Unlock the future of crypto trading with Aethix Cipher Pro—a powerhouse indicator inspired by Market Cipher A, turbocharged for Aethix.io users! Built on WaveTrend Oscillator, 8-EMA Ribbon, RSI+MFI, and custom enhancements like Grok AI confidence levels (70-100%), on-chain whale volume thresholds, and fun meme alerts ("To the moon! 🌕").
Key Features: no whale tabs
WaveTrend Signals: Spot overbought/oversold with levels at ±53/60/100—crosses trigger red diamonds, blood diamonds, yellow X's for high-prob buy/sell entries.
Neon Teal EMA Ribbon: Dynamic 5-34 EMA gradient (bullish teal/bearish red) for trend direction—crossovers plot green/red circles, blue triangles.
RSI+MFI Fusion: Overbought (70+)/oversold (30-) with long snippets for sentiment edges.

Aethix Cipher Pro2Aethix Cipher Pro: AI-Enhanced Crypto Signal Indicator grok Ai made signal created for aethix users.
Unlock the future of crypto trading with Aethix Cipher Pro—a powerhouse indicator inspired by Market Cipher A, turbocharged for Aethix.io users! Built on WaveTrend Oscillator, 8-EMA Ribbon, RSI+MFI, and custom enhancements like Grok AI confidence levels (70-100%), on-chain whale volume thresholds, and fun meme alerts ("To the moon! 🌕").
Key Features:
WaveTrend Signals: Spot overbought/oversold with levels at ±53/60/100—crosses trigger red diamonds, blood diamonds, yellow X's for high-prob buy/sell entries.
Neon Teal EMA Ribbon: Dynamic 5-34 EMA gradient (bullish teal/bearish red) for trend direction—crossovers plot green/red circles, blue triangles.
RSI+MFI Fusion: Overbought (70+)/oversold (30-) with long snippets for sentiment edges.
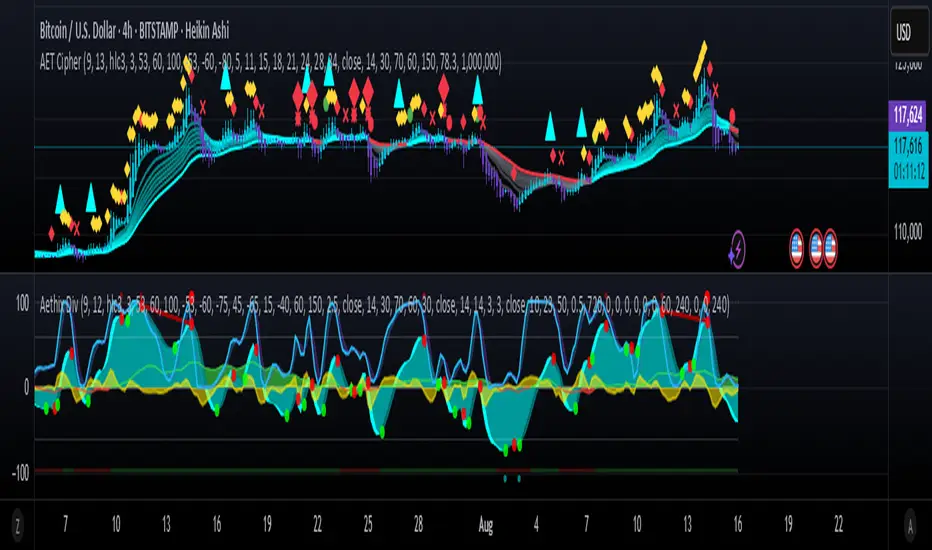
Aethix Cipher DivergencesAethix Cipher Divergences v6
Core Hook: Custom indicator inspired by VuManChu B, Grok-enhanced for crypto intel—blends WaveTrend (WT) oscillator with multi-divergences for buy/sell circles (green/teal buys #00FFFF, red sells) and dots (divs, gold overbought alerts).
Key Features:
WaveTrend Waves: Dual waves (teal WT1, darker teal WT2) with VWAP (purple for neon vibe), overbought/oversold lines, crosses for signals.
Divergences: Regular/hidden for WT, RSI, Stoch—red bearish, green bullish dots; extra range for deeper insights.
RSI + MFI Area: Colored area (green positive, red negative) for sentiment/volume flow.
Stochastic RSI: K/D lines with fill for overbought/oversold trends.
Schaff Trend Cycle: Purple line for cycle smoothing.
Sommi Patterns: Flags (pink bearish, blue bullish) and diamonds for HTF patterns, purple higher VWAP.
MACD Colors on WT: Dynamic WT shading based on MACD for enhanced reads.
