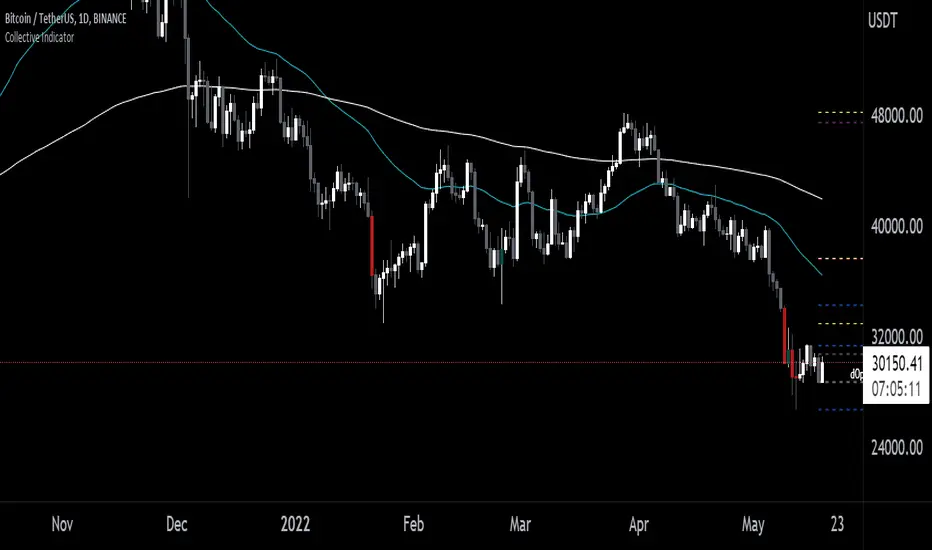
Collective IndicatorKey notes are that this indicators markets the High and Low of the previous day, week month and quarter. It also marks the open of the day, week, month and quarter. These are levels that can be important areas to take trades towards and away from.
It includes additional features some may wish to use that I've included for your convenience that I don't personally use anymore. This is the 50 and 200 EMAs and high volume candle coloring. EMAs can be helpful for identifying the average markup and markdown of a a trend on any given timeframe. Be careful with mean reversion strategies alone since they tend not to have great entries and could result in high losses if used in isolation.
The "Length" and "High Volume" settings control how the coloration of candles is applied. Length is the amount of bars it will use to calculate a volume average. "High Volume" is the multiplier used to distinguish how much additional volume you want to be considered "high" volume. 1x meaning average 2x meaning double volume and etc.
High volume identification can help show distributive or accumulative characteristics around key areas.
I personally focus on the Open, Low, High close data, apply SMC concepts and Wyckoff concepts to look for trades around these key areas.
Cerca negli script per "Wyckoff"
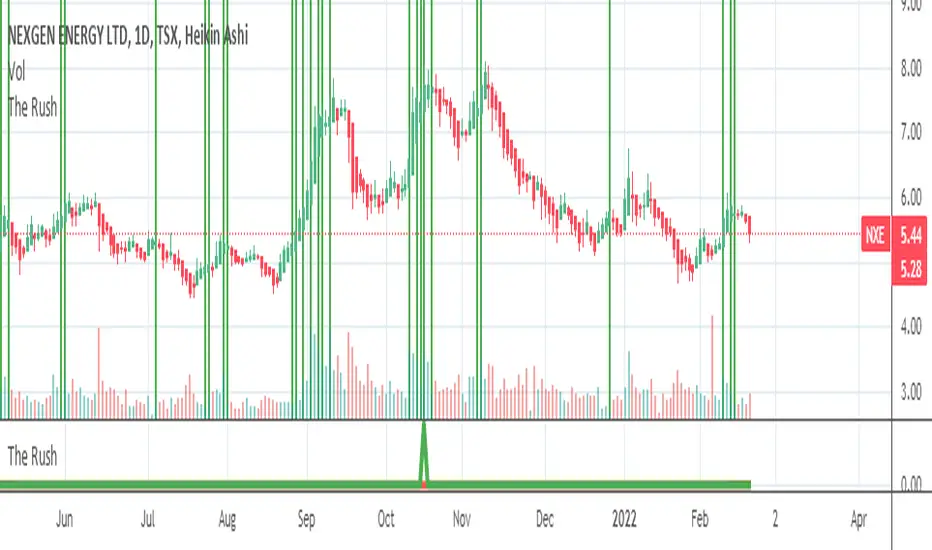
The Rush
█ OVERVIEW
This script shows when buyers are in a rush to buy and when sellers are in a rush to sell
═════════════════════════════════════════════════════════════════════════
█ CONCEPTS
Prophet Mohamed Peace be upon Him once said something similar to this "It is not advisable to trade if you do not know the
Volume".
In his book "The Day Trader's Bible - Or My Secret In Day trading Of Stocks", Richard D. Kickoff wrote in page 55
"This shows that there was only 100 shares for sale at 180 1/8, none at all at 180f^, and only 500 at 3/8. The jump from 1 to 8 to 3/8
Emphasizes both the absence of pressure and persistency on the part of the buyers. They are not content to wait patiently until they can
Secure the stock at 180^/4; they "reach" for it."
This script was inspired by these two great men.
Prophet Mohamed Peace be upon Him showed the importance of the volume and Richard D. Kickoff explained what Prophet
Mohamed Peace be upon Him meant.
So I created this script that gauge the movement of the stock and the sentiments of the traders.
═════════════════════════════════════════════════════════════════════════
• FEATURES: The script calculates The Percentage Difference of the price and The Percentage Difference of the volume between
two success bullish candles (or two success bearish candles) and then it creates a ratio between these two Percentage
Differences and in the end the ratio is compared to the previous one to see if there is an increase or a decrease.
═════════════════════════════════════════════════════════════════════════
• HOW TO USE: if you see 2 or more successive red bars that mean bears are in hurry to sell and you can expect a bearish trend soon
if the Market Maker allows it or later if the Market Maker wants to do some distribution.
if you see 2 or more successive green bars that mean bulls are in hurry to buy and you can expect a bullish trend soon if the Market
Maker allows it or later if the Market Maker wants to do some accumulation.
═════════════════════════════════════════════════════════════════════════
• LIMITATIONS:
1- Use only Heikin Ashi chart
2- Good only if volume data is correct , meaning good for a centralized Market. (You can use it for forex or
crypto but at your own risk because those markets are not centralized)
═════════════════════════════════════════════════════════════════════════
• THANKS: I pay homage to Prophet Mohamed Peace be upon Him and Richard D. Kickoff who inspired the creation of this
Script.
═════════════════════════════════════════════════════════════════════════
[cache_that_pass] 1m 15m Function - Weighted Standard DeviationTradingview Community,
As I progress through my journey, I have come to the realization that it is time to give back. This script isn't a life changer, but it has the building blocks for a motivated individual to optimize the parameters and have a production script ready to go.
Credit for the indicator is due to @rumpypumpydumpy
I adapted this indicator to a strategy for crypto markets. 15 minute time frame has worked best for me.
It is a standard deviation script that has 3 important user configured parameters. These 3 things are what the end user should tweak for optimum returns. They are....
1) Lookback Length - I have had luck with it set to 20, but any value from 1-1000 it will accept.
2) stopPer - Stop Loss percentage of each trade
3) takePer - Take Profit percentage of each trade
2 and 3 above are where you will see significant changes in returns by altering them and trying different percentages. An experienced pinescript programmer can take this and build on it even more. If you do, I ask that you please share the script with the community in an open-source fashion.
It also already accounts for the commission percentage of 0.075% that Binance.US uses for people who pay fees with BNB.
How it works...
It calculates a weighted standard deviation of the price for the lookback period set (so 20 candles is default). It recalculates each time a new candle is printed. It trades when price lows crossunder the bottom of that deviation channel, and sells when price highs crossover the top of that deviation channel. It works best in mid to long term sideways channels / Wyckoff accumulation periods.

Column XOColumn XO is an indicator in Prashant Shah's book Trading The Markets The Point & Figure Way. It counts a number of Xs and Os in every column for the long period. Then, the result is divided by the number of columns which is set by length.
This indicator is designed to identify changes in volatility and works well with Wyckoff's Law of Cause and Effect. The longer the price spends in the consolidation, the more volatile and far-reaching should the expansion phase be.
Good luck!

MS POIVThis indicator was introduced by Larry Williams in 2007 and is very similar to the well known OBV indicator.
As such, it should be examined for convergence and divergence with the price trend. The interpretation can be done using the Wyckoff principles.
* Price rises, POIV stays behind => no subsequent demand
* Price meets resistance, POIV reaches new highs => supply (distribution) in the background
* Price and POIV rise synchronously => price trend is intact
These statements can of course be applied correspondingly to falling prices.
Larry Williams wrote for explanation:
Despite the problem, volume indictors have proven their worth, but while it is
a good idea to watch the cumulative flow of buying and selling pressure, you
should not assign all of this buying and selling to bulls and bears. Combined
with other concepts, such as keying off the open, we can focus on something
more germane to trading based just on volume, or what some might consider
related volatility indicators, such as daily ranges.
Futures traders can consider at least one solution to this problem: open
interest. Open interest is the number of outstanding contracts in a particular
market. (...))
The formula is calculating the cumulative sum of open interest times the net
change in price, divided by the true range. We then add the OBV value to this
cumulative sum.
So we first take the net change in price (today’s close minus yesterday’s close)
to get a percentage of where within the range the close was. Not all of the
activity will be buying or selling; the market “tells” us what percentage of
open interest goes to the buy or sell side.
Not only that, it also means we are incorporating price and trend change into
the formula.
(...)
One note of warning is necessary. The Williams POIV AD is a specific formula
that compensates for the close within the range relationship, as well telling
us how much OI to use, but it is an indicator, not a trading system. In
practice, it is useful to confirm a trade or to focus attention on a potential
trade. It is not intended to stand as the sole reason to initiate a position
in the market.

Better OBVOBV with William C. Garrett's Approximation
In the classical OBV (On-Balance Volume) indicator, it simply takes the idea from traditional tape reading - treat the "up tick" as Buy, "down tick" as Sell, and it assumes no change in price as neutral* (*which is not the case in tape reading).
When it comes to interpret the daily volume as such, errors will add up cumulatively. For example, there are days when a Doji Star with high volume just merely one cent higher than yesterday price and the whole day volume would be taken as a BUY Volume....
Here is a gentlemen, William C. Garrett, attempted to break down the daily volume into two parts in his book - "Torque Analysis of Stock Market Cycle".
Published indicator has two modes: Cumulative and Time Segmented. Time Segmented Volume (TSV) - performs a MACD operation on the Garrett Money Flow.
Note on Divergence:
When using a indicator as Time Segmented Money Flow, divergence would surely occur on and off. This is where Wyckoff 3rd principle comes into play - "Effort vs Result" that is not matching. Meaning that the cumulation of shares goes in one direction while the price goes another direction.

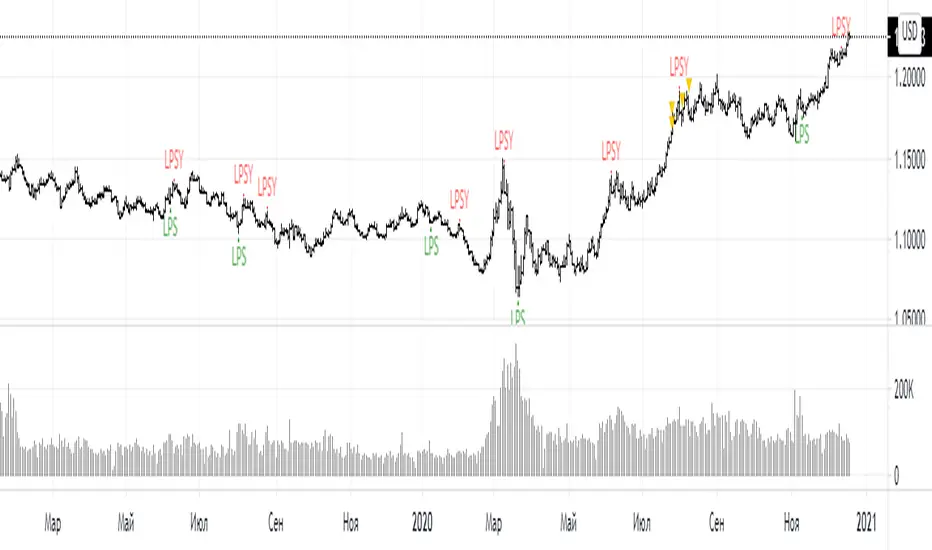
LPS PLSY INDICATOR for VSA( Google translation from Russian.)
Signal conditions:
1. There is a bar with an increased volume
2. The next bar after the bar with increased volume closes in the other direction
Arguments:
Comparison period - the period during which the volumes are compared with each other to calculate the bars with the increased volume.
sensitivity of increased volumes - according to the percentrank indicator - the border above which the volume will be considered large, the same as in the Volume on bar VSA indicator - indicator V2 - for clarity of how it works, I recommend looking at it.
efficiency of the next bar - (efficiency of the next bar from 0 to 100) ") - the efficiency of buying or selling on the next bar, bar field with a large volume. If the value is closer to 100, then the bars whose spread corresponds to the inserted volume will be taken into account, if closer to 0, then bars with a small spread and a large volume can be taken into account.
This argument is calculated similarly to the efficiency of bulls and bears for VSA
Attention.
In its original form, this indicator can give a large number of false signals. To filter out false signals, it should be used after studying the theory of VSA.
Russian language
Условия для сигнала:
1. Имеется бар с повышенным объёмом
2. Следующий бар после бара с повышенным объемом закрывается в другую сторону
Аргументы:
период для сравнения – период, на котором сравниваются между собой объёмы, для вычисления баров с повышенным объемом.
чувствительность повышенных объемов – согласно индикатору percentrank – граница выше которой̆ объем будет считаться большим, то же самое, что в индикаторе Volume on bar VSA - indicator V2 – для наглядности как это работает рекомендую посмотреть его.
эффективность следующего бара от 0 до 100 - эффективность покупок или продаж на следующем баре, поле бара с большим объемом. Если значение ближе к 100 то будут учитываться бары у которых спред соответствует вложенному объему, если ближе к 0 то могут учитываться бары у которых спред маленький а объем большой.
Расчёт этого аргумента производится аналогично индикатору efficiency of bulls and bears for VSA
Примечание
В исходном виде этот индикатор может давать большое количество ложных сигналов. Для отсеивания ложных сигналов его следует применять после изучения теории VSA.
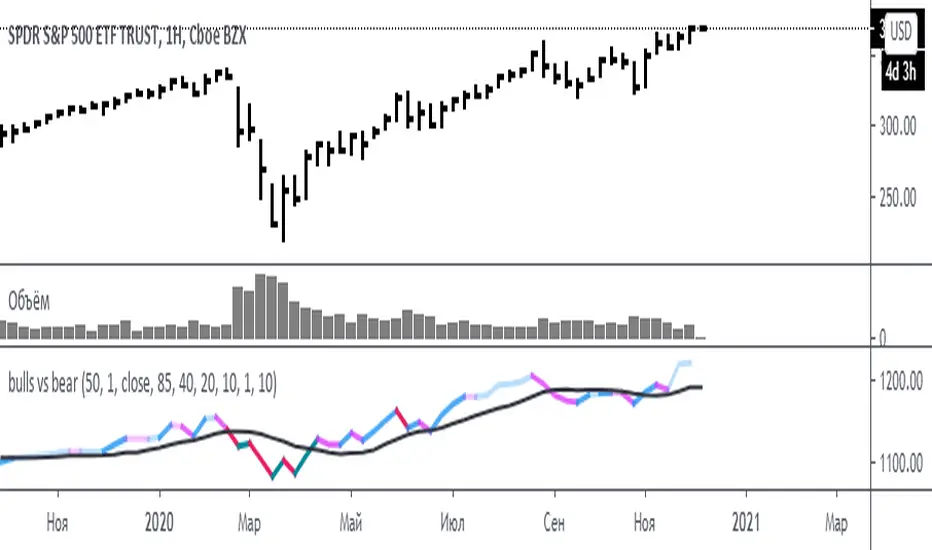
bulls vs bear for VSA(Google translation from Russian.)
This indicator is based on the efficiency of bulls and bears for VSA and has the same parameters.
Its only difference is that all the values of the efficiency of bulls and bears for VSA indicator are sequentially added here.
I want to note that the Period spread - Bars from close to close argument was made for experimental purposes, and shows interesting results for values 3-4-5, in theory this is not very logical. Because then the estimate of the spread for this interval (3-4-5) will be divided by the estimate of the volume of the current bar.
Also added here is a moving average with a default period of 10 - theoretically, if the indicator is above the moving average - the initiative is behind the bulls - if below - the initiative is behind the bears.
It is recommended to use this indicator with the indicator:
efficiency of bulls and bears for VSA
Volume on bar VSA - indicator V2
Russian language.
Этот индикатор сделан на основе efficiency of bulls and bears for VSA и имеет такие же параметры.
Единственное отличие его в том, что тут последовательно складываются все значения индикатора efficiency of bulls and bears for VSA .
Хочу отметить, что аргумент Period spread - Bars from close to close (Период спреда - Баров от закрытия до закрытия) сделан в экспериментальных целях, и показывает интересные результаты на значения 3-4-5, в теории это не очень логично. Потому-что тогда будет делиться оценка спреда за этот интервал (3-4-5), на оценку величины объема текущего бара.
Также тут добавлена скользящая средняя с периодом по умолчанию 10 – теоретически, если индикатор над скользящей средней – инициатива за быками – если ниже – инициатива за медведями.
Это индикатор рекомендуется использовать с индикатором:
efficiency of bulls and bears for VSA
Volume on bar VSA - indicator V2
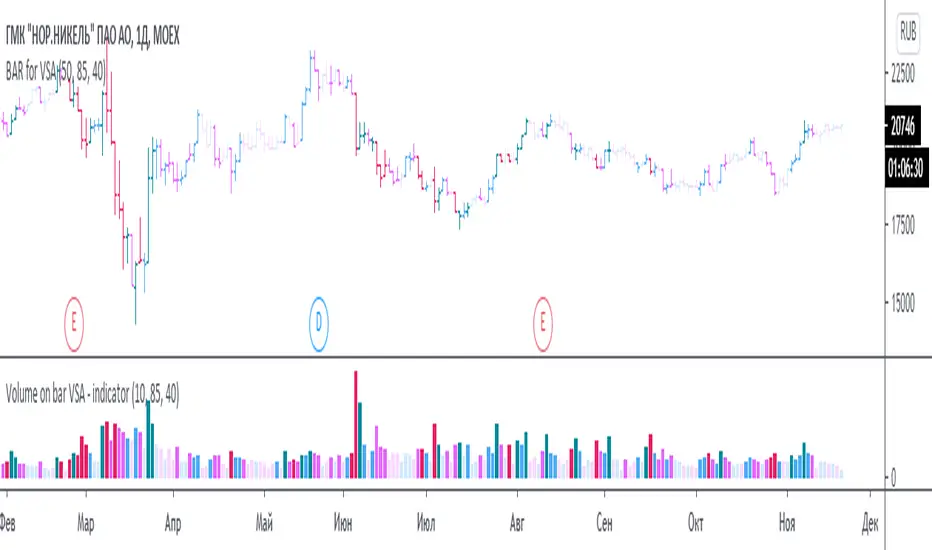
BAR for VSABars in which the open is equal to the previous close.
Bars are colored according to the indicator Volume on bar VSA - indicator V2
(Made for analysis by ICA ).
Бары в которых открытие равно предыдущему закрытию.
Бары раскрашиваюся согласно индикатору Volume on bar VSA - indicator V2
(Сделано для анализа по ВСА).
VSA indicatorGoogle translation from Russian:
This is VSA bar-by-bar analysis.
Spread, volume and progress are analyzed.
Spread is the difference between the current closing price and the previous one.
Progress is determined by dividing price by volume.
For each parameter (spread, volume, progress), a score is assigned according to the following assessment system:
Great value - 3 points
Average value - 2 points
Small value - 1 point
If the volume is small, i.e. 0 points, the other parameters are not evaluated.
Green bars represent a buyer and red bars represent a seller. It is selected based on the location of the closing price between the high and low prices of the bar. If the closing price is closer to the maximum, then these are purchases, if to the minimum, then these are sales.
The higher the bar value, the stronger the player. The maximum value on the bar is 9 (indicates the maximum values for all parameters of spread, volume and progress).
The blue line is the average value for the last 5 bars (the value changes in the settings), it can be interpreted as the balance of forces for the last 5 bars. The centerline value is multiplied by a scale factor of 2 for better display.
It should be borne in mind that to use the indicator, you need to know the VSA theory, since this indicator cannot assess the result of price changes, breaking through important levels, as well as the context in general.
Это побарный анализ VSA.
Анализируется спред, объем и прогресс.
Спред это – разница между текущей ценой закрытия и предыдущей.
Прогресс определяется делением цены на объем.
По каждому параметру (спред, объем, прогресс) присваивается балл по следующей системе оценке:
Большое значение – 3 балла
Среднее значение – 2 балла
Маленько значение – 1 балл
Если объем маленький, т.е. 0 баллов, то остальные параметры не оцениваются.
Зелёные бары обозначают покупателя, а красные продавца. Выбирается на основании расположения цены закрытия между максимальной и минимальной ценой бара. Если цена закрытия расположена ближе к максимуму, то это покупки, если к минимуму, то это продажи.
Чем больше значение бара, тем сильнее игрок. Максимальное значение на баре равно 9 (указывает максимальные значения по всем параметрам спреду, объему и прогрессу).
Синяя линия это среднее значение по последним 5 барам (значение меняется в настройках), его можно интерпретировать как баланс сил по последним 5 барам. Значение средней линии умножено на масштабный коэффициент равный 2 для лучшего отображения.
Следует учитывать, что для пользования индикатором необходимо знать теорию VSA, поскольку этот индикатор не может оценить результат изменения цены, пробитие важных уровней, а также в целом контекст.

DeltalexИндикатор связывает спред (momentum=1) и объем. Если они большие на конкретном баре, то индикатор будет повышенным.
Также учитывается хвосты продаж и покупок. Например спред положительный, объем тоже, но хвост покупок составляет всего 10% от диапазона изменения цены на баре, тогда индикатор будет умножен на эти 10%, тем самым уменьшив его и показывая как бы, что да покупки есть но плохие.
Индикатор подкрашивается в зависимости от направления спреда, зелёный если momentum>1, красный если momentum<1
Скрип следует использовать с теорией VSA
Google translate:
The indicator connects spread (momentum = 1) and volume . If they are large on a particular bar, then the indicator will be raised.
The tails of sales and purchases are also taken into account. For example, the spread is positive, the volume is also, but the buy tail is only 10% of the price change range on the bar, then the indicator will be multiplied by these 10%, thereby decreasing it and showing, as it were, that there are but bad buys.
The indicator is colored depending on the direction of the spread, green if momentum> 1, red if momentum <1
Squeak should be used with VSA theory

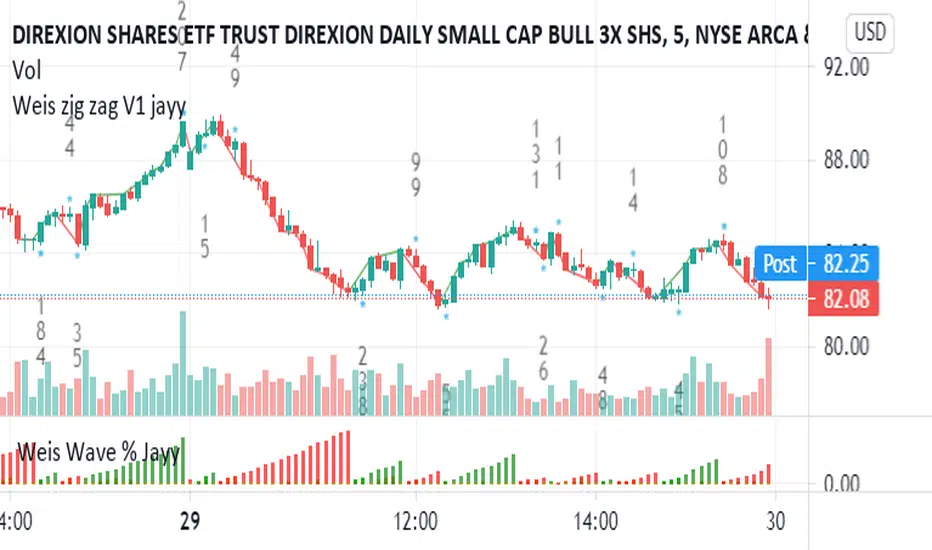
Weis pip zigzag jayyWhat you see here is the Weis pip zigzag wave plotted directly on the price chart. This script is the companion to the Weis pip wave ( ) which is plotted in the lower panel of the displayed chart and can be used as an alternate way of plotting the same results. The Weis pip zigzag wave shows how far in terms of price a Weis wave has traveled through the duration of a Weis wave. The Weis pip zigzag wave is used in combination with the Weis cumulative volume wave. The two waves must be set to the same "wave size".
To use this script you must set the wave size. Using the traditional Weis method simply enter the desired wave size in the box "Select Weis Wave Size" In this example, it is set to 5. Each wave for each security and each timeframe requires its own wave size. Although not the traditional method a more automatic way to set wave size would be to use ATR. This is not the true Weis method but it does give you similar waves and, importantly, without the hassle described above. Once the Weis wave size is set then the pip wave will be shown.
I have put a pip zigzag of a 5 point Weis wave on the bar chart - that is a different script. I have added it to allow your eye to see what a Weis wave looks like. You will notice that the wave is not in straight lines connecting wave tops to bottoms this is a function of the limitations of Pinescript version 1. This script would need to be in version 4 to allow straight lines. There are too many calculations within this script to allow conversion to Pinescript version 4 or even Version 3. I am in the process of rewriting this script to reduce the number of calculations and streamline the algorithm.
The numbers plotted on the chart are calculated to be relative numbers. The script is limited to showing only three numbers vertically. Only the highest three values of a number are shown. For example, if the highest recent pip value is 12,345 only the first 3 numerals would be displayed ie 123. But suppose there is a recent value of 691. It would not be helpful to display 691 if the other wave size is shown as 123. To give the appropriate relative value the script will show a value of 7 instead of 691. This informs you of the relative magnitude of the values. This is done automatically within the script. There is likely no need to manually override the automatically calculated value. I will create a video that demonstrates the manual override method.
What is a Weis wave? David Weis has been recognized as a Wyckoff method analyst he has written two books one of which, Trades About to Happen, describes the evolution of the now popular Weis wave. The method employed by Weis is to identify waves of price action and to compare the strength of the waves on characteristics of wave strength. Chief among the characteristics of strength is the cumulative volume of the wave. There are other markers that Weis uses as well for example how the actual price difference between the start of the Weis wave from start to finish. Weis also uses time, particularly when using a Renko chart. Weis specifically uses candle or bar closes to define all wave action ie a line chart.
David Weis did a futures io video which is a popular source of information about his method.
This is the identical script with the identical settings but without the offending links. If you want to see the pip Weis method in practice then search Weis pip wave. If you want to see Weis chart in pdf then message me and I will give a link or the Weis pdf. Why would you want to see the Weis chart for May 27, 2020? Merely to confirm the veracity of my algorithm. You could compare my Weis chart here () from the same period to the David Weis chart from May 27. Both waves are for the ES!1 4 hour chart and both for a wave size of 5.
Weis Pip Wave jayyWhat you see here is the Weis pip wave. The Weis pip wave shows how far in price a Weis wave has traveled through the duration of a Weis wave. The Weis pip wave is used in combination with the Weis cumulative volume wave. The two waves must be set to the same "wave size" and using the same method as described by Weis.
Using the traditional Weis method simply enter the desired wave size in the box "Select Weis Wave Size". In the example shown, it is set to 5 points. Each wave for each security and each timeframe requires its own wave size. Although not the traditional method a more automatic way to set wave size would be to use ATR. This is not the true Weis method but it does give you similar waves and, importantly, without the hassle of selecting a wave size for every chart. Once the Weis wave size is set then the pip wave will be shown.
I have put a zigzag of a 5 point Weis wave on the above bar chart. I have added it to allow your eye to get a better appreciation for Weis wave pivot points. You will notice that the wave is not in straight lines connecting wave tops to bottoms this is a function of the limitations of Pinescript version 1. This script would need to be in version 4 to allow straight lines. I will elaborate on the Weis pip zigzag script.
What is a Weis wave? David Weis has been recognized as a Wyckoff method analyst he has written two books one of which, Trades About to Happen, describes the evolution of the now popular Weis wave. The method employed by Weis is to identify waves of price action and to compare the strength of the waves on characteristics of wave strength. Chief among the characteristics of strength is the cumulative volume of the wave. There are other markers that Weis uses as well for example how the actual price difference between the start of the Weis wave from start to finish. Weis also uses time, particularly when using a Renko chart. Weis specifically uses candle/bar closes to define all wave action.
David Weis did a futures.io video which is a popular source of information about his method.
Cheers jayy
PS This script was published a day ago, however, I had included some links to the website of a person that uses Weis pip waves and also a dropbox link that contains the Weis wave chart for May 27, 2020, published by David Weis. Providing those links is against TV policy and so the script was hidden by TV. This is the identical script with the identical settings but without the offending links. If you want to see the pip Weis method in practice then search Weis pip wave. I have absolutely no affiliation. If you want to see Weis chart in pdf then message me and I will give a link or the Weis pdf. Why would you want to see the Weis chart for May 27, 2020? Merely to confirm the veracity of my algorithm. You could compare my chart () from the same period to the Weis chart. Both waves are for the ES!1 4 hour chart and both for a wave size of 5.

Renko Weis Wave VolumeThis is live and non-repainting Renko Weis Wave Volume tool. The tool has it’s own engine and not using integrated function of Trading View.
Renko charts ignore time and focus solely on price changes that meet a minimum requirement. Time is not a factor on Renko chart but as you can see with this script Renko RSI created on time chart.
Renko chart provide several advantages, some of them are filtering insignificant price movements and noise, focusing on important price movements and making support/resistance levels much easier to identify.
As source Closing price or High/Low can be used.
Traditional or ATR can be used for scaling. If ATR is chosen then there is rounding algorithm according to mintick value of the security. For example if mintick value is 0.001 and brick size (ATR/Percentage) is 0.00124 then box size becomes 0.001. And also while using dynamic brick size (ATR), box size changes only when Renko closing price changed.
This tool is based on the Weis Wave described by David H. Weis (a Wyckoff specialist). The Weis Waves Indicator sums up volumes in each wave. This is how we receive a bar chart of cumulative volumes of alternating waves and The cumulative volume makes the Weis wave charts unique.
If there is no volume information for the security then this tool has an option to use “True Range” instead of volume .
Better to use this script with the following one:
Enjoy!

Point and Figure (PnF) Weis Wave VolumeThis is live and non-repainting Point and Figure Chart Weis Wave Volume tool. The script has it’s own P&F engine and not using integrated function of Trading View.
Point and Figure method is over 150 years old. It consist of columns that represent filtered price movements. Time is not a factor on P&F chart but as you can see with this script P&F chart created on time chart.
P&F chart provide several advantages, some of them are filtering insignificant price movements and noise, focusing on important price movements and making support/resistance levels much easier to identify.
This tool is based on the Weis Wave described by David H. Weis (a Wyckoff specialist). The Weis Waves Indicator sums up volumes in each wave. This is how we receive a bar chart of cumulative volumes of alternating waves and The cumulative volume makes the Weis wave charts unique.
If there is no volume information for the security then this tool has an option to use “True Range” instead of volume .
If you are new to Point & Figure Chart then you better get some information about it before using this tool. There are very good web sites and books. Please PM me if you need help about resources.
Options in the Script
Box size is one of the most important part of Point and Figure Charting. Chart price movement sensitivity is determined by the Point and Figure scale. Large box sizes see little movement across a specific price region, small box sizes see greater price movement on P&F chart. There are four different box scaling with this tool: Traditional, Percentage, Dynamic (ATR), or User-Defined
4 different methods for Box size can be used in this tool.
User Defined: The box size is set by user. A larger box size will result in more filtered price movements and fewer reversals. A smaller box size will result in less filtered price movements and more reversals.
ATR: Box size is dynamically calculated by using ATR, default period is 20.
Percentage: uses box sizes that are a fixed percentage of the stock's price. If percentage is 1 and stock’s price is $100 then box size will be $1
Traditional: uses a predefined table of price ranges to determine what the box size should be.
Price Range Box Size
Under 0.25 0.0625
0.25 to 1.00 0.125
1.00 to 5.00 0.25
5.00 to 20.00 0.50
20.00 to 100 1.0
100 to 200 2.0
200 to 500 4.0
500 to 1000 5.0
1000 to 25000 50.0
25000 and up 500.0
Default value is “ATR”, you may use one of these scaling method that suits your trading strategy.
If ATR or Percentage is chosen then there is rounding algorithm according to mintick value of the security. For example if mintick value is 0.001 and box size (ATR/Percentage) is 0.00124 then box size becomes 0.001.
And also while using dynamic box size (ATR or Percentage), box size changes only when closing price changed.
Reversal : It is the number of boxes required to change from a column of Xs to a column of Os or from a column of Os to a column of Xs. Default value is 3 (most used). For example if you choose reversal = 2 then you get the chart similar to Renko chart.
Source: Closing price or High-Low prices can be chosen as data source for P&F charting.
There is only one option for Weis Wave Volume, “Use True Range (if no Volume info)” if you select this option and volume info is not avaliable then it uses “true range”, but if volume info is available, it never use true range. Default value is set to use true range.

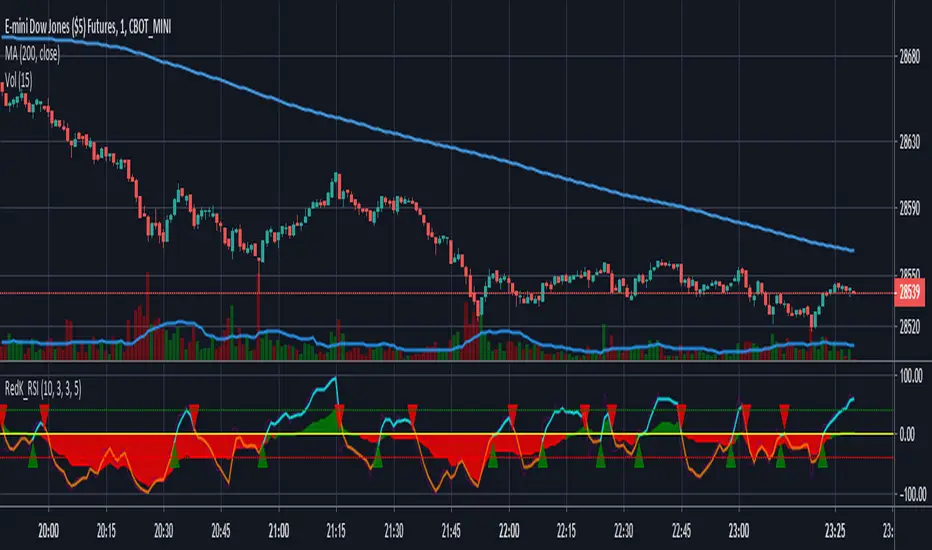
RedK Vol_Weighted RSI: Extending the power of the classic RSILet's take the classic Relative Strength Index (RSI) and give it couple of modern upgrades - the results are better visuals with improved signals and trade decision support:
Options and features:
- Dual period: look at the short term RSI vs a backdrop of a longer period RSI (expressing the longer-term "prevailing sentiment") - get clearer "re-entry" points in long bull or bear runs
- Longer period RSI has a "Step" option - since what we won't be really interested in the fractions, but more of the broad "strength" of the sentiment (weak, medium..) - default set to a step of 5. please experiment with what works best for you.
- Option to make the RSI volume-weighted. (On by default) - won't say much here, but possibly this is the biggest and most important added feature for those keen on the combined price - volume effect (and Wyckoff'ians)
- Smoothing option -- i would keep this set to 3 to avoid extra lag due to the smoothing
- scaled to +100 / -100 with zero as the signal line - that's how i like oscillators to work
- Adjustable optional overbought / oversold levels - can also be used to also mark strong up/down levels
- designed for the "visually oriented" -- like me :)
- code is open and commented
What Values to use:
many setting combinations possible. play around and find your sweet spot based on what/how you trade. for me, i usually prefer what i set as defaults in the study.
tip: if you set Length = 14, smoothing = 1, Sent. factor =1, Vol Weighted = No, you're back (almost) with a classic RSI - the only difference would be that i use Weighted Moving Average in my calculation of the RSI (i tend to believe WMA is the most naturally-suited for looking at "market price" data series)
Please feel free to use, share or give feedback.
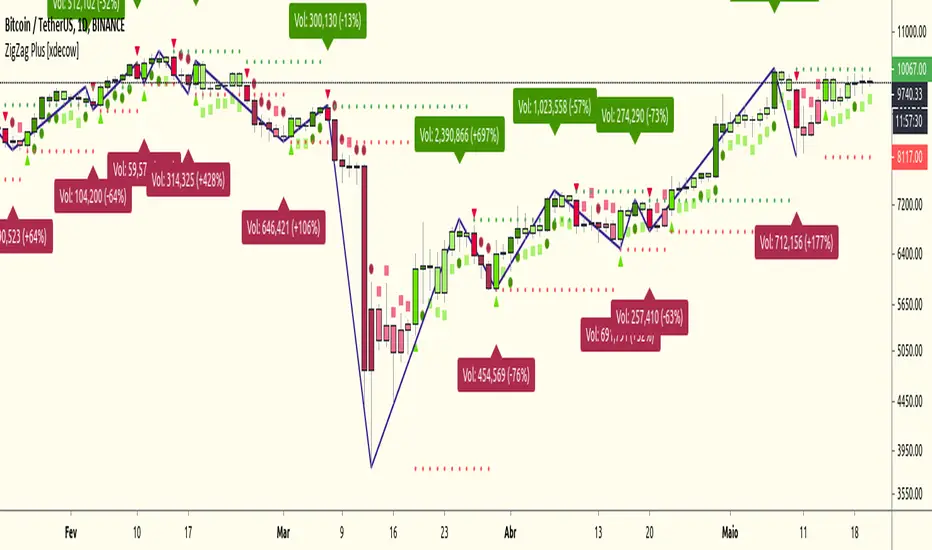
ZigZag Plus [xdecow]A ZigZag Like based on candle close.
A lot of options that can be hide in options.
Triangle/bright - reversal confirmation candle
Circle/dark - higher/lower candle breakout
Square/light - Insidebar
R100 Wave Volume v2 (*v*)This indicator is similar to the Weis Wave Volume indicator in that it shows cumulative volume for each up and down price wave. However it is calculated differently, using the Jurik moving average to determine turning points. Use this in conjunction with the R100 Wave indicator to determine the best fit Jurik length and power settings.
A great indicator to help analyse the strength of pullbacks, continuation moves and changes in behaviour.
I hope you get some value out of it. Only conditions of use are that if you improve it, let me know and if you publish something that uses it, don't hide the code! Enjoy!
Code pinched and modified from Zero Lag ZigZag by Duyck - thankyou
Jurik Moving Average (for turning points) by Everget - thankyou
and Weis Wave by Modhelius - thankyou
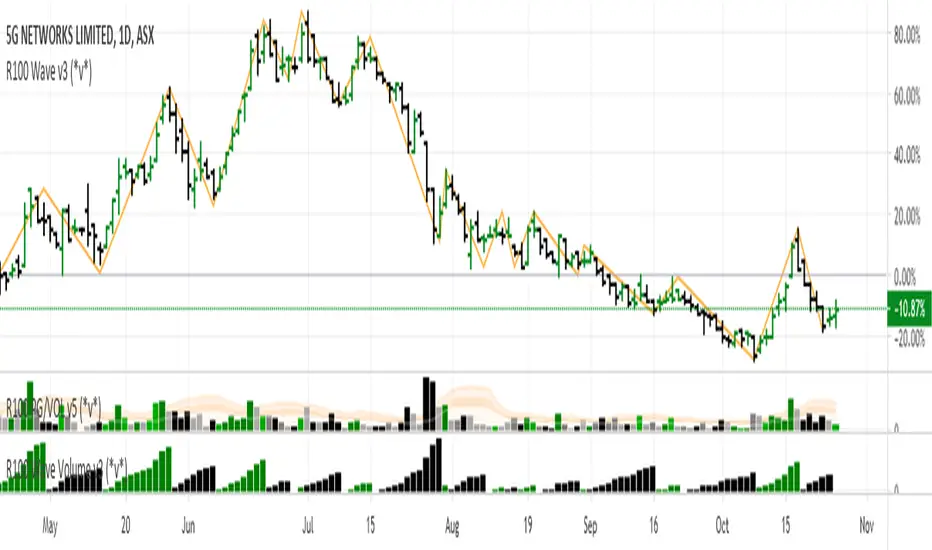
R100 Wave v2 (*v*)This is a Wave (or Zig Zag) indicator I made to use in conjunction with the Wave Volume indicator I use.
It uses the Jurik moving average to determine turning points, and will plot the tops and bottoms of the wave based on the most recent high- so you can also use to quickly find pivot highs and lows. If you are using with the R100 Wave Volume indicator, first adjust the wave to fit better (if required) using the Jurik length and/or power, and then use the same settings on the Wave Volume indicator. Default settings work pretty well for most stocks, but adjusting the length between 8 and 14 should be enough for a good fit, or adjust the power between 1 and 3, or get fussy and tweak it with both.
The Jurik MA has been modified to include a VWAP component, so will only work where you have volume. The last "leg" of the wave will move about until the next pivot high or low is found and then will remain fixed.
I hope you find some value with it. Only conditions of use are that if you improve it, let me know and if you publish something that uses it, don't hide the code! Enjoy!
Code pinched and modified from Zero Lag ZigZag by Duyck - thankyou
Jurik Moving Average (for turning points) by Everget - thankyou
and Weis Wave by Modhelius - thankyou

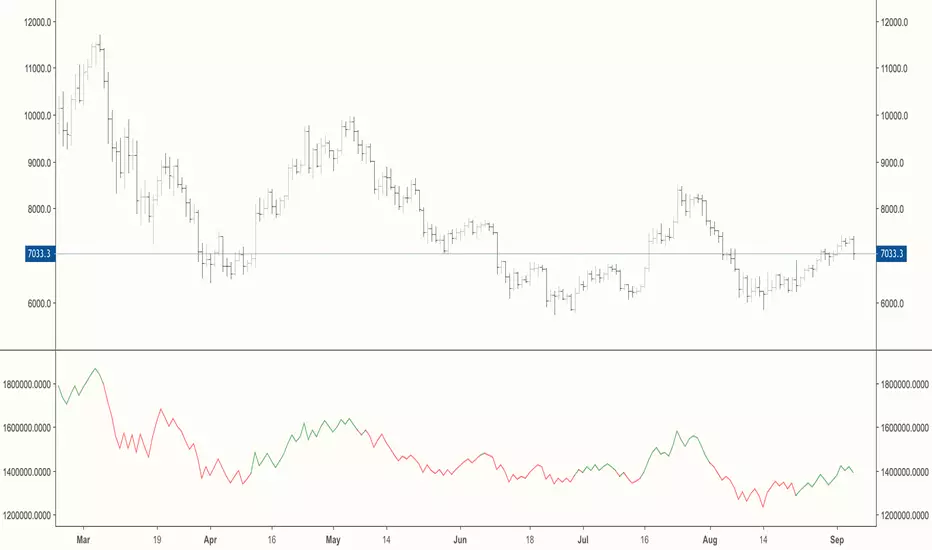
OBV/CCI By AssetDisplay on balance volume, with trend strength identification by colour of another asset in a window of your current chart.
The Lie Detector [LucF]Sometimes the simplest things turn out to be surprisingly useful.
Wyckoff's second law of cause and effect implies that price movement (up or down) should be proportional to the effort (volume) supplied. Price is not subject to gravity; without volume it cannot move.
This one-line indicator acts a bit like a lie detector for price action.
It simply identifies bars with decreasing volume, the idea being that movement on a bar where volume has decreased is considered suspicious.
Falling volume accompanied by much price movement is more suspicious than it is on bars with less movement.
Pure luck would have it that the varying size of the candlestick bodies provides an easy way to visually grasp the degree of suspiciousness their movement should be considered with because it is directly proportional to the body's size. Large, empty bodies are more suspicious than small ones.
Taking things from the opposite perspective, this indicator reveals the more meaningful candles on your chart, the ones telling the truth, since their color is not changed if they are accompanied by rising volume.

My WaveThis is my implementation in TradingView of my modified version of the "Weis Wave".
Given the limitations of TradingView in alter past variable values, whenever the close change direction and the wave don't I sum the volume to the present wave and also to a possible future wave.
This results in columns of a mixed color within the columns of the histogram. By changing the percentage input you can and must keep this extra columns to a minimum.
You must insert two copies of the indicator on your chart and "unmerge down" one of them. On the overlayed you must * format and edit and unmark Histup and Histdown, on the unmerged down you must * format and edit and unmark BetaZigZag and stableZigZag.
You can also unmark Bar Color on both if you don't want to colour the bars according to the waves.
Trend: If the buying waves are longer than the selling waves the immediate trend is up, and vice versa.
Look out for a change in trend if in an uptrend the selling waves begin to increase in time and distance or the buying waves shorten, and vice versa.
From the volume histogram you can get the force of the buying and selling waves.
From the price waves you get the result of that force. You can also spot the "shortening of the thrust" up or down.
Comparing the two you can spot "effort without result" "ease of movement".
References: "Trades About To Happen" David H. Weis, Division 2 of the Richard D. Wyckoff Method of Trading in Stocks.
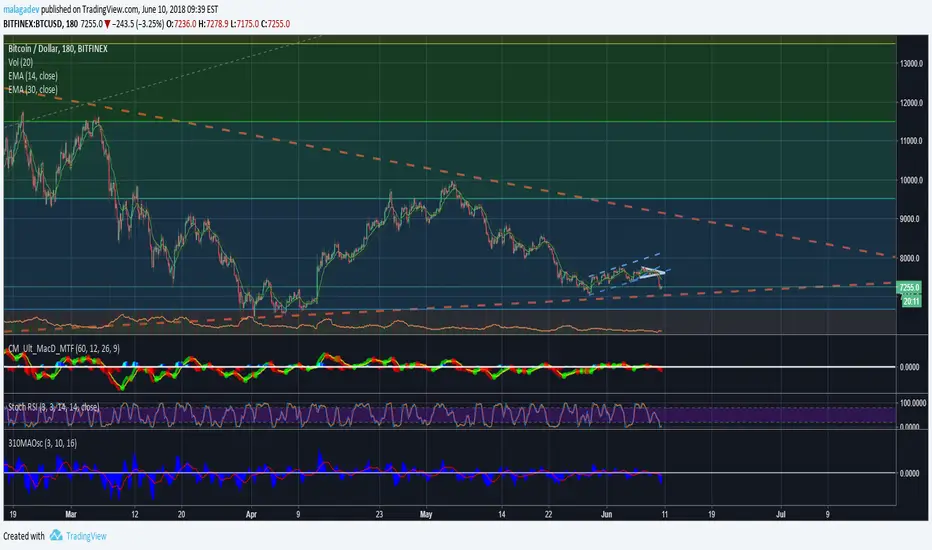
3-10 MA Oscillator (Wyckoff) by malagadev- If ControlSMA(16) exceeds 0 means market is bullish, below 0 means market is bearish.
- Difference between SMA(3,10) is represented with blue area.
- You can operate using changes in color or trend, or simply knowing that once 0 is crossed upwards, it means the pullback is proportional so we just need a simple pattern in the price or, entering after it just crosses.
- It's better to open positions in the first pullback after the ControlSMA(16) firstly crosses 0 ("First Cross").
- It's possible to operate using momentum divergences.