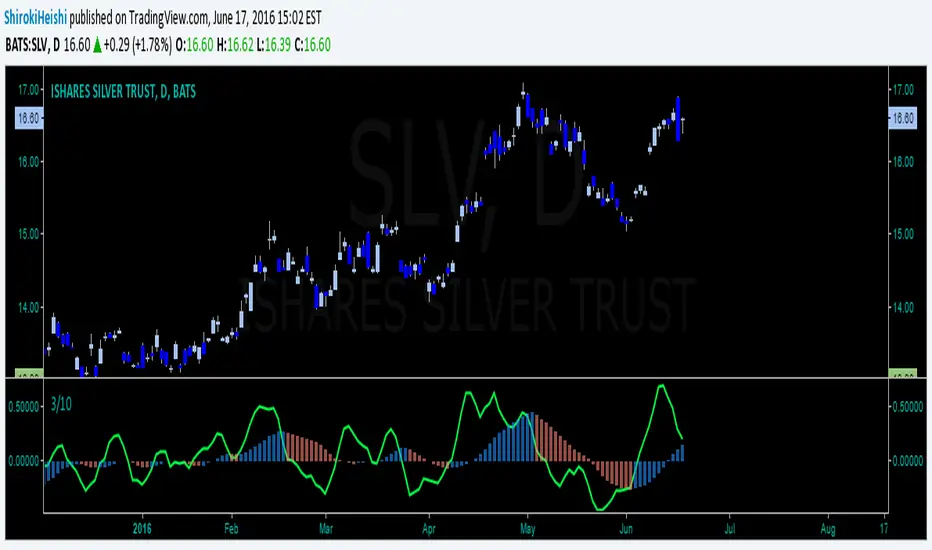
3/10 OscConstance Brown liked to use this by taking the first break of the zero line by the 3/10 oscillator in the direction of the trend-line relative to above or below zero. The similarities between the histogram and the MACD histogram are striking and its use is almost the same. Useful for seeing divergence in the same way noted by DR. Elder, take the first opposite colored bar after divergence which he stated was to have one peak lower than the previous but must break below zero in between. (opposite is true for bearish play)
I offer no updates to its use. this is the 3/10 oscillator popularized by Constance Brown. The only customization done here is cosmetic. This is just a copy for the user who saw my screen and wanted it exactly how mine was.
Enjoy responsibly, and as always, if you use this, take responsibility for your actions for good or ill, because I cannot be.
Good trading all,
Shiroki
Cerca negli script per "a股板块+沪深两市+股价不超过10元的股票+技术形态好"
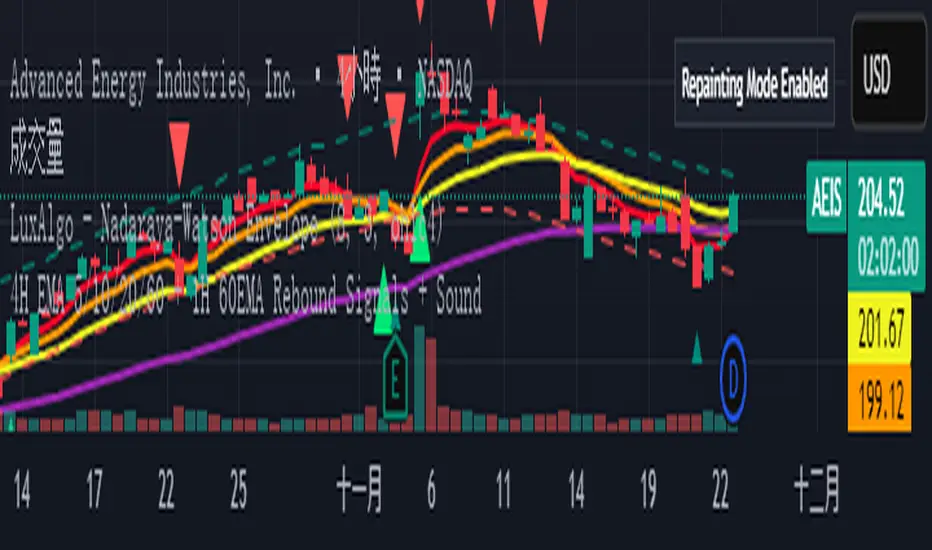
4H EMA 5/10/20/60 + 1H 60EMA Rebound Signals + Sou4H EMA 5/10/20/60 + 1H 60EMA Rebound Signals + Sou
Simple Moving Averages (5, 10, 20, 60, 120, 200SMA for different time frames.
Covers 5, 10, 20, 60, 120, 200 sma units
MA Suite 10/50/150/200 + Legend (v6)ma 10 50 150 200 that i have made with chat gpt to help find moving avarage

MA 5-10-30-60-90-120 by MMCThis indicator only plots 6 moving average lines:
MA 5, MA 10, MA 30, MA 60, MA 90, MA 120
No ribbon, no fill, no clouds, no arrows, no alerts — completely clean and minimal.
Lines are thin (linewidth = 2) but colors are very bright/neon so they pop even on dark charts.
Two inputs:
MA Type → EMA (default, faster) or SMA (smoother but lags more)
Color Theme → 3 preset themes:
Canlı Kontrast → brightest and most visible (red-orange-yellow-green-blue-purple)
Gökkuşağı → classic rainbow order
Kırmızı-Yeşil → red/orange tones for short-term, green tones for long-term
Change the theme and colors update instantly.

Spooky Time (10/31/25) [VTB]Get ready to add some eerie fun to your charts this Halloween! "Spooky Time" is a lighthearted indicator that draws a festive, animated Halloween scene right on your TradingView chart. Perfect for traders who want to celebrate the spooky season without missing a beat on the markets. Whether you're analyzing stocks, crypto, or forex, this overlay brings a touch of holiday spirit to your setup.
#### Key Features:
- **Jack-o'-Lantern Pumpkin**: A detailed, glowing pumpkin with carved eyes, nose, and a jagged mouth. The eyes and mouth cycle through black (off), yellow, and red glows for a subtle animation effect, giving it that classic haunted vibe.
- **Flickering Candle**: A wax candle with a wick and an animated flame that shifts positions slightly across three frames, mimicking a real flickering light. The flame color changes between yellow, red, and orange for added dynamism.
- **Spider Web and Spider**: A spiral web with radial lines, complete with a creepy-crawly spider. The spider's legs animate with small movements, as if it's ready to pounce—perfect for that extra spooky touch!
- **Customization Options**: Toggle the "Desiringmachine" label on/off, choose its position on the chart (e.g., Bottom Center), and select the text color. The entire scene is positioned relative to the chart's open price and ATR for better scaling.
- **Animation Cycle**: The whole setup uses a simple 3-frame animation based on bar_index, making it feel alive without overwhelming your chart.
This indicator is purely visual and non-intrusive—it doesn't plot any trading signals or data, so it won't interfere with your strategies. Just add it to your chart for some Halloween cheer during your trading sessions!
**Date Note**: Timed for Halloween 2025 (10/31/25)—feel the spooky energy!
**Happy Halloween!!!** 🎃👻🕸️

2 Bandas de Bollinguer (10-20) + 4 EMA + 2 SMA 2 BB (10-20) + 4 EMA (35-50-100-200) + 2 SMA (75-100) configurable


(SPY to ES) ETF→Futures Multi-Level (10 Levels + Select All)Converts selected ETF levels (SPY or QQQ) into equivalent futures levels (ES or NQ).
Uses live price ratio between ETF and futures for real-time level translation.
Supports 10 independent levels (A–J) with user-defined ETF price inputs.
Provides checkboxes to toggle each level’s visibility or show all at once.
Applies smoothing (ta.sma) to reduce noise from short-term price movement.
Lets user customize each line’s color, width, and style (solid, dashed, dotted).
Automatically updates lines as new bars form without user interaction.
Uses persistent line objects to keep levels stable when scrolling or zooming.
Adapts to either SPY→ES or QQQ→NQ depending on the “Convert SPY?” toggle.
Draws clean horizontal lines without legend clutter for visual precision.
SOME ONE PUBLISHED THIS FUNCTIONALITY FOR A CHARGE SO I MADE IT FREE.
-rA

SJA WINFUT B3-10
INDICATOR FOR WINFUT B3 – 5-minute chart.
This indicator was designed to trade the Bovespa index futures contract (WINFUT) on the 5-minute chart.
It integrates technical analysis and macroeconomic context elements.
It combines several indicators in which the system calculates a score weighted by color and intensity for each indicator, generating a metric called “STRENGTH %,” which reflects the dominance of buyers (green), sellers (red), or sideways movement (orange) at the moment.
The calculation is adapted to market hours:
Between 9:00 a.m. and 9:59 a.m., it considers only the available indicators; after 10:00 a.m., it uses all data.
The panel displays real-time information, including divergences between strength and price, providing robust decision support for short-term operations on the mini index.
Buying trend.
The more green indicators (at the top of the panel) and dark blue indicators (at the bottom of the panel) and the higher the strength percentage, the greater the probability of buying.
Selling trend.
The more red indicators (at the top of the panel) and dark blue indicators (at the bottom of the panel) and the higher the strength percentage, the greater the probability of selling.
Translated with DeepL.com (free version)

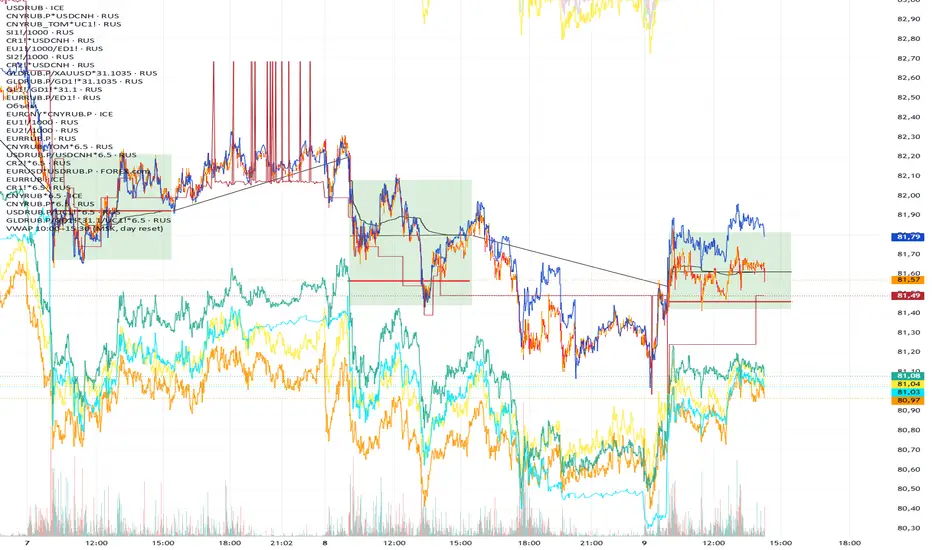
VWAP 10:00–15:00 (MSK, daily reset)Calculates the volume-weighted average price (VWAP) from 10:00 to 15:00 MSK.
The data is used to determine the funding rate of MOEX perpetual futures by comparing the average price of the perpetual contract with the official Central Bank exchange rate on the following day.
30-10-3 MAX,min dynamicsSupported timeframes: The script works only on timeframes of 1 minute or lower (including second-based timeframes).
Displayed levels: The highs and lows of the last closed candle are plotted for the 30-minute, 10-minute, and 3-minute timeframes.
Updates: The levels update only when a candle closes in the respective timeframe (e.g., every 30 minutes for the 30m levels).
Visualization: Dashed lines for highs and lows (blue for 30m, green for 10m, red for 3m).
Labels indicating "Max 30m", "Min 30m", etc., positioned above the highs and below the lows.

30-10-3 MAX,min dinamici Supported timeframes: The script works only on timeframes of 1 minute or lower (including second-based timeframes).
Displayed levels: The highs and lows of the last closed candle are plotted for the 30-minute, 10-minute, and 3-minute timeframes.
Updates: The levels update only when a candle closes in the respective timeframe (e.g., every 30 minutes for the 30m levels).
Visualization: Dashed lines for highs and lows (blue for 30m, green for 10m, red for 3m).
Labels indicating "Max 30m", "Min 30m", etc., positioned above the highs and below the lows.

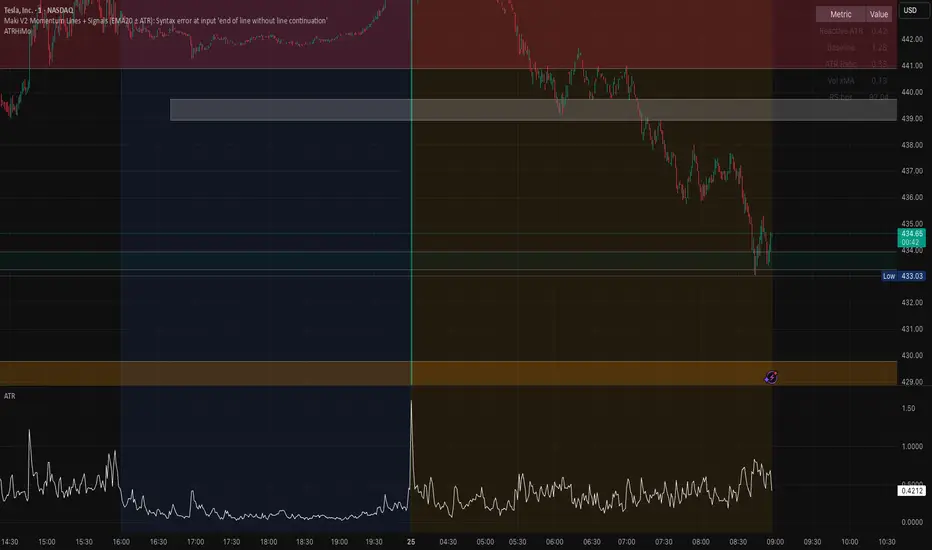
Opening ATR + High Momentum (10/30/60)this is a custom momentum indicator using atr
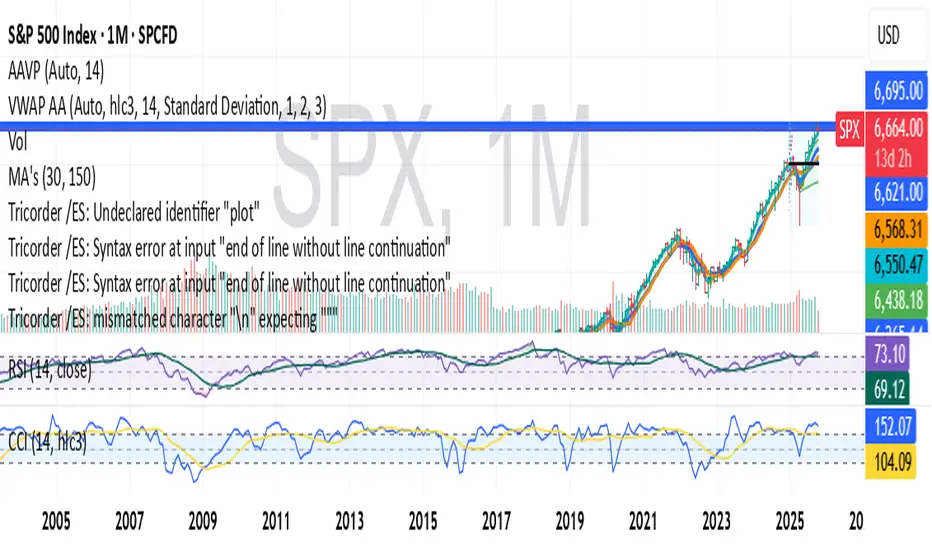
A fixed, compiling Pine v5 script is below with the three issues corrected: no plots in local scope, a ≤10-character shorttitle, and cleaned ternaries/formatting that remove the “end of line without line continuation” error.
QQQ Ladder → Adjusted to Active Ticker (5s & 10s)This indicator allows you to a grid of QQQ levels directly on futures chart like NQ, MNQ, ES and MES, automatically adjusting for the spread between the displayed symbol and QQQ. This is particularly useful for traders who perform technical analysis on QQQ but execute trades on Futures.
Features:
Renders every 5 and 10 points steps of QQQ in your current chart.
The script adjusts these levels in real-time based on the current spread between QQQ and the displayed symbol!
Plots updated horizontal lines that move with the spread
Supports Multiple Tickers, ES1!, MES1!, NQ1!, MNQ1! SPY and SPX500USD.

NDX Ladder → Adjusted to Active Ticker (5s & 10s)This indicator allows you to a grid of NDX levels directly on the NQ! (E-mini NASDAQ 100 Futures) chart, automatically adjusting for the spread between NDX and NQ1!. This is particularly useful for traders who perform technical analysis on SPX but execute trades on NQ1!.
Features:
Renders every 5 and 10 points steps of the NDX in your current chart.
The script adjusts these levels in real-time based on the current spread between NDX and NQ / MNQ
Plots updated horizontal lines that move with the spread

SPX Ladder → Adjusted to Active Ticker (5s & 10s)This indicator allows you to a grid of SPX levels directly on the ES1! (E-mini S&P 500 Futures) chart, automatically adjusting for the spread between SPX and ES1!. This is particularly useful for traders who perform technical analysis on SPX but execute trades on ES1!.
Features:
Renders every 5 and 10 points steps of the SPX in your current chart.
The script adjusts these levels in real-time based on the current spread between SPX and ES1!
Plots updated horizontal lines that move with the spread
Supports Multiple Tickers, ES1!, SPY and SPX500USD.
Ideal for futures traders who want SPX context while trading ES1!.

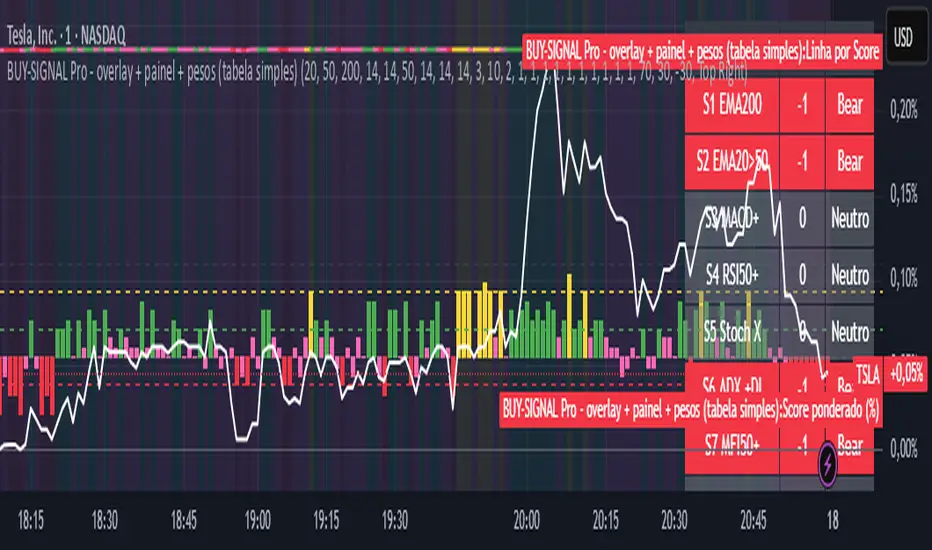
BUY-SIGNAL Pro - 10 Indicators - Strategy Godinho 2Best 10 indicators
Strong buy YELLOW
Buy GREEN
Hold PINK
Sell RED
MA 10/20/50A Simple MA array including 10, 20, and 50 day.
Used primarily for determining crypto bullish or bearish technical trending primarily on the 1-day chart.

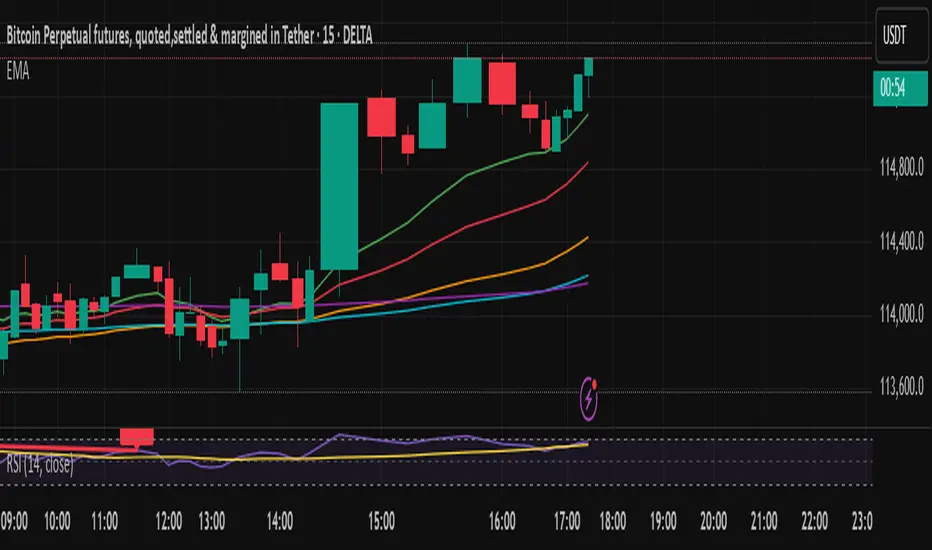
EMA 10/20/50/100/200plot 10, 20, 50,100,200 EMA on the chart. can be used to determine on any timeframe EMA
EMA 10/20 Crossover BackgroundThis script works best on a weekly chart and it taints the background green if the EMA-10 is larger than EMA-20 (EMA lengths can be configured) and red otherwise. I use this script to immediately determine if a market is trending upwards or downwards.

EMA 10,20 SMA 50, 200This indicator is very helpful for swing traders who plan their trades using EMAs and SMAs. It is used on the daily chart and displays the 10- and 20-EMA, as well as the 50- and 200-SMA.
