SP500 Earnings Yield Spread: SP500 vs 3 Month & 10 Year TreasuryAdd the SP500 ttm Earnings Yield Spreads vs the 3 Month and 10 Year Treasury Rates.
Short Spread = SP500 E/P ttm - 3 Month Treasury Rate
Long Spread = SP500 E/P ttm - 10 Year Treasury Rate
Symbol "SP500_EARNINGS_YIELD_MONTH" as the SP500 Earnings Yield
Symbol "US03MY" as the 3 Month Treasury Rate
Symbol "US10Y" as the 10 Year Treasury Rate
Based on research suggesting Earnings Yield and Interest Rates may have predictive power of future returns:
- Market-Timing Strategies That Worked? - Pu Shen
- Valuation Ratios and the Long-Run Stock Market Outlook - Campbell and Shiller
Inputs:
Short Term Spread - Line for Short Term Spread
Long Term Spread - Line for Long Term Spread
Zero Line - Horizontal line at 0
Color Lines Based on Spread - Color the spreads green/red if spread is positive/negative
Short 10th PCT - Line for Short Term Spread 10th percentile of historical values
Long 10th PCT - Line for Long Term Spread 10th percentile of historical values
Shade Below 10 PCT: Spread Must be Negative - Requirement the spread is negative to shade background
Shade Background Below Short 10th Percentile - Shade the background if the Short Term Spread is below its 10th percentile. (and spread is negative if input above chosen)
Shade Background Below Long 10th Percentile - Shade the background if the Long Term Spread is below its 10th percentile. (and spread is negative if input above chosen)
Cerca negli script per "a股近10年第二天溢价的股票"

Davin's 10/200MA Pullback on SPY Strategy v2.0Strategy:
Using 10 and 200 Simple moving averages, we capitalize on price pullbacks on a general uptrend to scalp 1 - 5% rebounds. 200 MA is used as a general indicator for bullish sentiment, 10 MA is used to identify pullbacks in the short term for buy entries.
An optional bonus: market crash of 20% from 52 days high is regarded as a buy the dip signal.
An optional bonus: can choose to exit on MA crossovers using 200 MA as reference MA (etc. Hard stop on 50 cross 200)
Recommended Ticker: SPY 1D (I have so far tested on SPY and other big indexes only, other stocks appear to be too volatile to use the same short period SMA parameters effectively) + AAPL 4H
How it works:
Buy condition is when:
- Price closes above 200 SMA
- Price closes below 10 SMA
- Price dumps at least 20% (additional bonus contrarian buy the dip option)
Entry is on the next opening market day the day after the buy condition candle was fulfilled.
Sell Condition is when:
- Prices closes below 10 SMA
- Hard stop at 15% drawdown from entry price (adjustable parameter)
- Hard stop at medium term and long term MA crossovers (adjustable parameters)
So far this strategy has been pretty effective for me, feel free to try it out and let me know in the comments how you found :)
Feel free to suggest new strategy ideas for discussion and indicator building

7-10 flattener tradeIn the budget speech for FY 2023, market borrowing of 14.95 lakh crore from the market. In the Feb MPC meeting, the RBI brought down its estimates of growth and inflation potentially signaling that economy is/will go through a demand slowdown.
Now in a slowing economy, the govt. finances will be affected. Therefore, to bring back the economy on the fiscal consolidation so that sovereign bond ratings are not hit, the Indian govt. must figure out a way
1. Lower its interest payments in the face of increasing public expenditure on creating public infrastructure (read roads/highways etc. ). One simple way is to go down the yield curve in lower maturities to bring down the interest costs.
Keeping in mind (1) above, it was not difficult to expect a borrowing schedule where the shorter tenors will form a bigger percentage of the net issuance by the government.
In fact, if you look at the issuance calendar for securities below the tenor of 10 yrs (which is 2,5,7 yrs), you will find that itself comprises of ~31% of total borrowings.
Therefore, due to increased pressure on the shorter tenors and relatively less pressure on 10 yr bond yield, we can expect the yields spreads to compress in 7-10 yr region of the yield curve.
This script is written to track the same yield spread compression across 7 & 10 yr tenor.

Stage 2 Trend Signals (10/21/50/200) *Trend-following indicator designed to focus on **strong Stage 2 uptrends**, not bottom-fishing or chop.
* Plots **10 EMA, 21 EMA, 50 SMA, and 200 SMA** as core moving averages.
* Uses a **trend filter** so buy signals only occur when:
* Price is above the **50 SMA** (and optionally above the **200 SMA**), and
* The **50 SMA is above the 200 SMA**, reflecting classic Stage 2 alignment.
* Prints a **green “BUY” label** when the **10 EMA crosses above the 21 EMA** within this bullish environment, signaling momentum turning up in an established uptrend.
* Prints a **red “SELL” label** when the **10 EMA crosses below the 21 EMA** or when price is in a bearish context and closes below the 21 EMA, prompting risk reduction as trend/momentum weaken.
* Light **green background shading** highlights periods where the bullish Stage 2 conditions are active (“trend-on” zones).
* Works on **any timeframe**; commonly used on:
* **Weekly charts** for big-picture trend confirmation.
* **Daily charts** for swing entries, exits, and active trade management.

90D High % Pullback Lines (Hybrid 10 Lines)90D High % Pullback Lines (Hybrid 10 Lines) visualizes drawdown levels from the 90-day high, with up to 10 fully customizable percentage-based lines.
This tool makes it easy to identify pullbacks, dip-buy zones, trend continuation points, and discount regions in any market.
🔍 Features
✅ Up to 10 customizable pullback levels
Each line has its own % drop setting
Turn any line ON/OFF individually
Example presets: −10%, −20%, −30%, … −95%
✅ Two rendering modes
1. Hybrid Fixed Line Mode (Stable / Anti-Shift)
Prevents line drift caused by chart updates
Keeps horizontal levels synchronized on every bar
Best stability for intraday & real-time use
2. Lightweight plot (stepline) Mode
Ideal for backtesting
Fully compatible with alerts
Clean and fast rendering
✅ Supports daily-based 90-day high
Even on lower timeframes, the indicator can use the daily 90-day high
Ideal for MTF (multi-timeframe) analysis
🎯 Use Cases
Instantly see how far price has pulled back (%) from the 90-day high
Build systematic dip-buy / trend-follow setups
Identify discount zones during volatility
Monitor recovery signals after strong sell-offs
Works great for crypto, FX, indices, and stocks
🚨 Alerts Included
Alerts trigger when closing price crosses any selected pullback line
Useful for automated dip-buy alerts, breakout alerts, etc.
📌 Notes
Due to internal TradingView behavior, public indicators may behave slightly differently from real-time script editing mode.
The Hybrid Line Mode is designed to provide the most stable and drift-free line display.

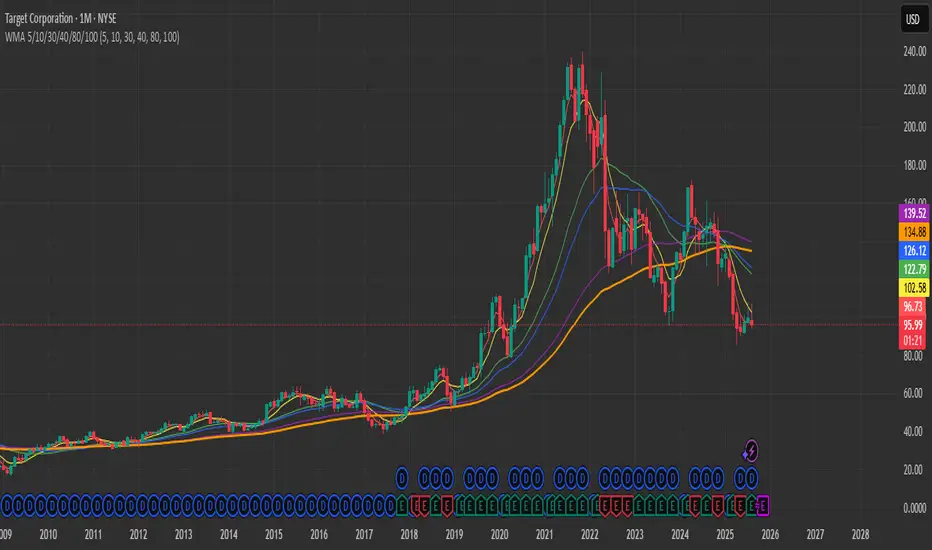
WMA 5/10/30/40/80/1006 WMAs on the chart: 5, 10, 30, 40, 80, and 100 — each in its own color.
This indicator plots multiple Weighted Moving Averages (WMA) on the price chart: 5, 10, 30, 40, 80, and 100.
Shorter WMAs (5 & 10) react quickly to price changes and are useful for short-term trend detection.
Longer WMAs (30, 40, 80, 100) help identify medium- to long-term trends and dynamic support/resistance zones.
Traders often watch for crossovers between short-term and long-term WMAs as potential trade signals.
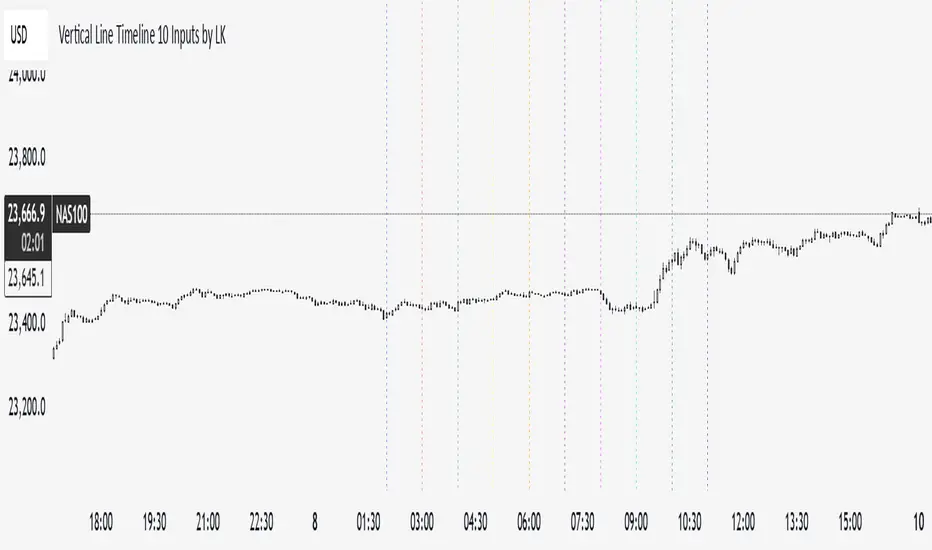
Vertical Line Timeline 10 Inputs by LK**Vertical Line Timeline (10 Inputs)**
This TradingView indicator plots vertical lines on your chart at up to **10 specific times of day**. You can define each time in **HH.MM format** (e.g., `9.30` for 9:30 AM). When the current bar’s time matches any of the defined times (based on the chart’s timezone), the indicator automatically draws a **full-height vertical line** at that bar.
**Features:**
* **Up to 10 custom time inputs** (HH.MM format)
* **Custom color** for each time marker
* **Adjustable line width** (1–6 px)
* **Solid or dotted style** toggle
* **Full-height vertical lines** (extend through the entire chart height)
* Works on any intraday timeframe where bar start times can match the defined times
* No labels or extra elements — clean and minimal display
**Use cases:**
* Marking important market sessions (e.g., London Open, New York Open, Asian Close)
* Highlighting personal trade execution windows
* Visual cues for strategy backtesting or time-based setups
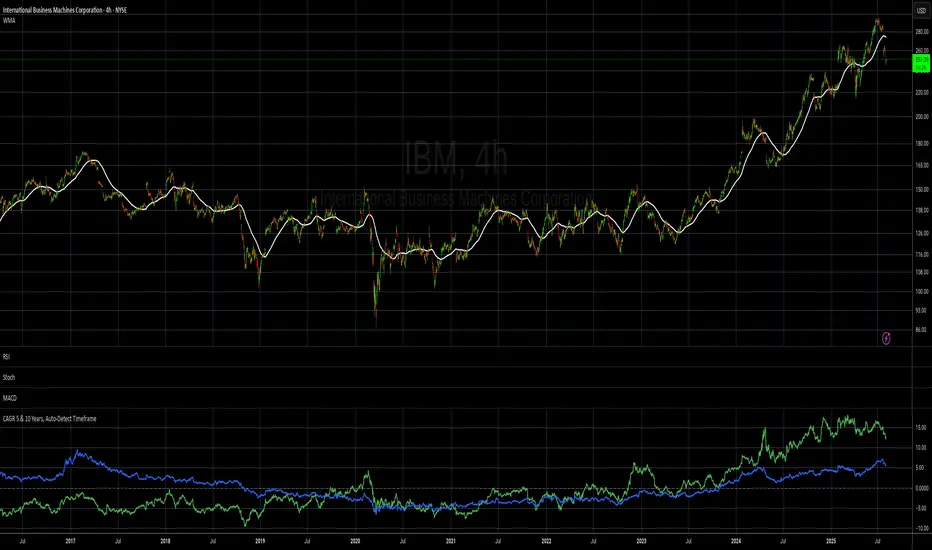
CAGR 5 & 10 Years, Auto-Detect Timeframe# CAGR 5 & 10 Years, Auto-Detect Timeframe
## Overview
This indicator automatically calculates the **Compound Annual Growth Rate (CAGR)** for 5-year and 10-year periods, adapting intelligently to different asset types and timeframes.
## Key Features
### 🤖 **Smart Market Detection**
- **Automatically detects** if the asset operates 24/7 (crypto, crypto futures) or traditional hours (stocks, forex)
### ⏰ **Multi-Timeframe Support**
**Compatible timeframes**: 1H, 2H, 3H, 4H, 6H, 8H, 12H, 1D, 3D, 1W, 1M, 3M, 6M, 12M
### 📊 **Visual Display**
- **Green line**: 5-year CAGR percentage
- **Blue line**: 10-year CAGR percentage
- **Zero reference line** for easy interpretation
## Use Cases
- **Long-term performance analysis** across different timeframes
- **Cross-asset comparison** with automatic market type adjustment
- **Investment planning** with standardized annual growth rates
- **Historical perspective** on asset performance
Perfect for investors and analysts who need consistent, comparable growth metrics across different assets and market types.
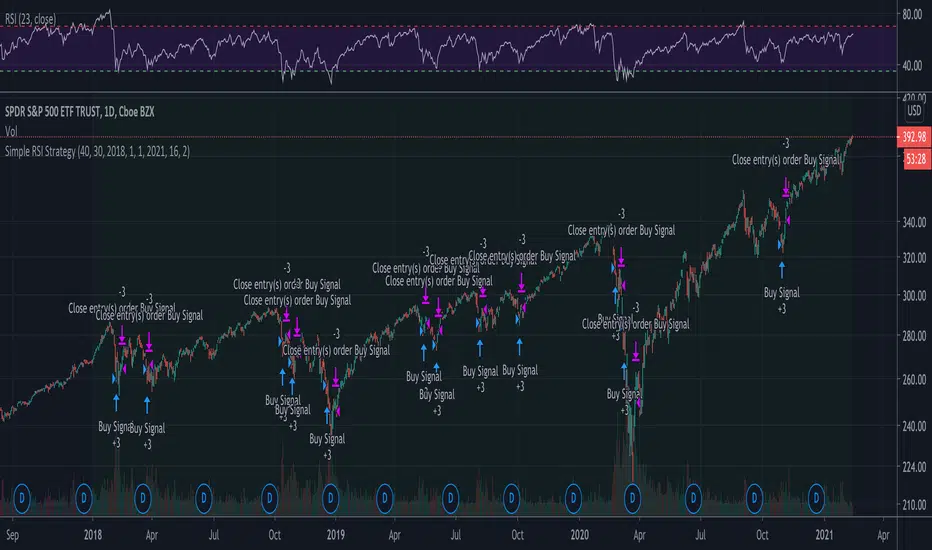
Example of Simple RSI Buy/Sell at a level and hold for 10 daysScript implements strategy:
1 Buy at RSI (10) < 30
2 Sell at RSI (10) > 40 or after 10 days
The strategy is not profitable for long term trading.
EMA 5/10/21 SMA 50/100/200The Script is mixture of both EMAs and SMAs. EMA 5/10/21 are powerful indicators for short term providing more weightage to the recent prices. SMA 50/100/200 provide the long term view.
5 Day EMA: This is a sign of strong momentum. It tracks the trend in the short term time frame. This is support in the strongest up trends. This line can only be used in low volatility trends with strong momentum. A break back above this line is a sign for me that an uptrend may be resuming. I primarily use it as an end of day trailing stop. It is rare that this line does not break intraday, even in the strongest trending markets.
• 10 day EMA: The 10 day EMA is a great moving average to use to keep you on the right side of the major market trend. It is usually the first line to be lost before any real trouble begins. It can be used as a standalone signal in some stocks and markets that tend to trend strongly in one direction for long periods.
• 21 day EMA: This is the intermediate term moving average. It is generally the last line of support in a volatile uptrend. To me, it is the inevitable reversion to the mean in a market when it finally pulls back after an extended trend.
• 50 day SMA: This is the line that strong leading stocks typically pull back to. This is usually the support level for strong uptrends. It is normal for uptrending markets to pull back to this line and find support. Most bull markets and uptrends will pull back to this level. It is generally a great “Buy the dip” level.
• 100 day SMA: This is the line that provides the support between the 50 day and the 200 day. If it does not hold as support, there is a high probability that the 200 day SMA is the next stop. This is the deeper pullback level in bull markets and uptrends. It usually presents a great risk/reward ratio in bull markets.
• 200 day SMA: Bulls like to buy dips when markets are trading above the 200 day moving average, while bears sell rallies short below it. Bears usually win below this line, as the 200 day becomes longer term resistance, and bulls buy pullbacks to the 200 day as long as the price stays above it. This line is one of the biggest signals in the market telling you which side to be on. Bull above, Bear below. Bad things happen to stocks and markets when this line is lost.

Ema Cross, 10 /21 / 55Ema Cross tool using Ema 10 / Ema 21 / Ema 55
I have found these settings very useful for catching breakouts on Alt coins.
Alerts Added,
Breakout = Ema 10 crossing above Ema 21
Breakdown = Ema 10 crossing under Ema 21
Ema 55 added as a useful area to catch dips when price is trending

Linda Raschke - 3/10 oscillator The MACD indicator is very useful when thinking of it in terms of momentum and trend and not as a holy grail.
There are many settings that can be used and I prefer to use the settings that reflect the 3/10 oscillator (Raschke).
While you can simply input the numbers 3,10,16 into your standard MACD, the proper 3/10 uses simple averages.

Trinity Ultimate 10 MA Ribbons)I got tired of trying to find a multi MA ribbon that could also color change and allow different types, if it exists then I could not find it... So here it is...
The **Trinity Ultimate 10 MA Ribbon** is a highly customizable, professional-grade moving average ribbon that combines extreme flexibility with beautiful visual feedback. Designed for traders who want full control without sacrificing clarity, it allows you to build a ribbon using up to ten completely independent moving averages — each with its own length, type, color, thickness, and visibility setting — while automatically coloring both the lines and the fills according to bullish or bearish conditions.
### Key Features
- Ten fully independent moving averages that can be mixed and matched exactly as you want.
- Each MA has its own selectable type: EMA (default), SMA, WMA, HMA, RMA, VWMA, or ALMA — perfect for combining fast EMAs with a slow HMA or a classic 200-period SMA.
- Every single MA line automatically changes color in real time: bright green when price is above the MA (bullish) and red when price is below the MA (bearish), making trend strength instantly visible across all timeframes.
- Smart, reactive ribbon fills that appear only between consecutive enabled MAs. Turn any MA on or off and the fills instantly adjust — no gaps, no broken bands, no manual rework.
- Nine layered fills with individually adjustable transparency (default is gradually increasing transparency from the fastest to the slowest MA), creating a smooth, depth-like ribbon effect that looks stunning on any chart background.
- Fill color itself is dynamic: green for bullish candles (close > open) and red for bearish candles, or you can customize both colors to any shade you prefer.
- Full control over every visual element: base colors, line thickness (1–10), lengths, and show/hide toggles for each of the ten MAs.
- Clean and lightweight code that compiles instantly in Pine Script v5 and works on all markets and timeframes without lag.
In short, this is the most flexible and visually informative moving-average ribbon available on TradingView today. Whether you want a classic 9-EMA ribbon, a Guppy-style multiple-timeframe setup, a hybrid EMA/HMA mix, or just three or four key levels, the indicator adapts perfectly while always telling you at a glance where the bulls and bears are in control.

SMAs (10,50,100,200) by BenderDescription:
Multi-timeframe Simple Moving Average indicator displaying four popular SMAs (10, 50, 100, 200) commonly used for trend analysis and support/resistance levels. Each SMA is fully customizable with individual settings for period length, data source, timeframe, and color. Perfect for traders who want to view higher timeframe SMAs on lower timeframe charts or combine multiple timeframe analyses in one view.
Key Features:
Four independent SMAs with default periods of 10, 50, 100, and 200
Multi-timeframe capability - view daily SMAs on any chart timeframe
Fully customizable: length, source (close, open, high, low, etc.), timeframe, and color
Toggle each SMA on/off individually
Clean, organized settings menu with grouped parameters
Semi-transparent lines for better chart visibility

Nifty Participants - Top 10 📌 Nifty Participants – Top 10 (Indicator Description)
This indicator displays the top 10 weighted stocks from the NIFTY index and shows how each stock is contributing to the index movement in real time.
For each participant, the script calculates price change, percentage change, RSI, VWAP position, volume spike, previous day levels, and their estimated participation based on weightage.
A dynamic table is plotted on the chart with color-coded cells for bullish, bearish, and neutral conditions. Users can customize which columns to display (LTP, Change, Change %, Share, RSI, VWAP, Volume Spike, Previous Day High/Low) and select the timeframe for calculations. The index itself appears as the first row for quick comparison.
Volume spikes are highlighted when current volume exceeds a configurable multiple of the average volume. RSI and VWAP columns also use adaptive coloring to quickly show strength or weakness.
All weightages are user-editable, and the table automatically limits output to the selected number of rows. This makes it an ideal real-time market breadth and contribution tracker for intraday and positional traders.

EMA Trend Alignment (10/20/50) with MTF & SignalsBullish Crossovers 10>20>50 and Bearish Crossover 10<20<50

NY KZ High/Low (live → lock @10:00 UTC-5)NY KZ High/Low (live → lock @10:00 UTC-5) NY KZ High/Low (live → lock @10:00 UTC-5)

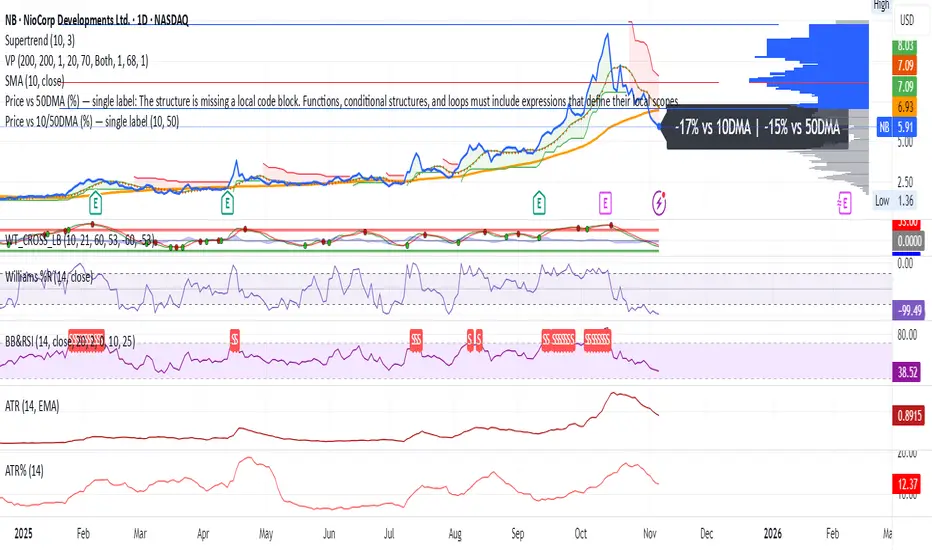
Price vs 10/50DMA (%) — single labelThis TradingView script shows how far the current price is from its 10-day and 50-day moving averages (DMAs), expressed as percentages, and displays both values as a single label near the latest candle — for example, “+3% vs 10DMA | +8% vs 50DMA.” You can switch between simple and exponential moving averages using the “Use EMA” checkbox, and adjust the period lengths in the input panel. To use it, simply copy the code into TradingView’s Pine Editor, click Add to chart, and you’ll see one live label updating each bar along with the plotted 10- and 50-day average lines.
Vertical Lines at 10:00 & 11:30Sales-Style Description
This script is a simple but powerful TradingView add-on that automatically marks your chart with clear, bold vertical lines at exactly 10:00 AM and 11:30 AM every day. No more manually drawing lines or setting reminders — it does the work for you.
Always on time: It tracks the market clock in real-time and drops a line the moment your chart hits those times.
Clean visibility : The lines are bright blue (#2962FF), solid, and drawn with thickness level 3, so they stand out against any background or chart theme.
Automatic housekeeping: It keeps your workspace clean by automatically deleting old lines once you reach a set limit, so your chart never gets cluttered.
Customizable : You can change the time zone, thickness, and the number of days’ worth of lines to keep.
Set it and forget it: Once added to your chart, it runs quietly in the background — you’ll always know when the 10:00 and 11:30 sessions hit without lifting a finger.

COG-10 + Deviation BandsClassic Center of Gravity, COG
«Center of Gravity»
COG is a weighted moving average, in which new bars have more weight, and old ones have less.
Formula (Pine equivalent):
COG = – Σ (price × (i+1)) / Σ price
• i = 0 – the most recent bar
• i = length-1 – the oldest bar
The minus sign simply flips the curve so that the extremes coincide with the price reversals.
Bars: | 9 | 8| 7 | 6| 5| 4| 3 | 2 | 1 | 0 |
Weight: |1 | 2 | 3 | 4| 5| 6| 7| 8 | 9| 10|
Where COG is used
Reversal zones
– when the price moves far from the COG, it is considered «overbought/oversold»; return to COG – potential reversal.
Dynamic support/resistance
– in a sideways trend, the price often bounces off the COG.
Trend filter
– if COG grows → uptrend, falls → downtrend.
Strategy pairs
• COG + deviation bands (analogous to Bollinger) is given in lines
• COG + RSI – confirmation of divergences
• COG + volume (weighted by volume) is given in yellow lines
Перевод для русской аудитории
Classic Center of Gravity, COG
«Центр тяжести»
COG – это взвешенное скользящее среднее, в котором новые бары имеют больший вес, а старые – меньший.
Формула (Pine-эквивалент):
COG = – Σ (price × (i+1)) / Σ price
• i = 0 – самый свежий бар
• i = length-1 – самый старый бар
Знак «минус» просто переворачивает кривую, чтобы экстремумы совпадали с разворотами цены.
Бары: | 9 | 8| 7 | 6| 5| 4| 3 | 2 | 1 | 0 |
Вес: |1 | 2 | 3 | 4| 5| 6| 7| 8 | 9| 10|
Где применяют COG
Разворотные зоны
– когда цена отходит далеко от COG, считается «перекупленностью/перепроданностью»; возврат к COG – потенциальный разворот.
Динамическая опора/сопротивление
– в боковике цена часто отталкивается от COG.
Фильтр тренда
– если COG растёт → восходящий тренд, падает → нисходящий.
Пары стратегий
• COG + полосы отклонения (аналог Bollinger) приводится в линиях
• COG + RSI – подтверждение дивергенций
• COG + объём (взвешивать по volume) приводится в желтых линиях
Customizable 10‑MA SuiteCustomizable 10‑Moving‑Average Suite
OverviewPlot up to 10 independent moving averages on a single chart. Every line can be tailored to your trading style with adjustable length, timeframe, MA type (SMA, EMA, WMA, RMA, VWMA, HMA, LinReg), data source, colour, width, and plot style.
Key Features
True multi‑time‑frame support via request.security(): mix intraday and higher‑time‑frame MAs effortlessly.
Fine‑grained visibility control: toggle each MA on/off to keep charts clean and script performance high.
Versatile display options: choose between line, step, histogram, or area plots for every MA.
Typical Use‑Cases
Quickly compare short‑, medium‑, and long‑term trends.
Identify dynamic support/resistance and moving‑average crossovers.
Add confluence to existing strategies or discretionary setups.
Pro TipHighlight your primary trend MA with a thicker line and bolder colour, while setting secondary MAs to thinner or dashed styles—this keeps focus where it matters and prevents visual clutter.
Enjoy!
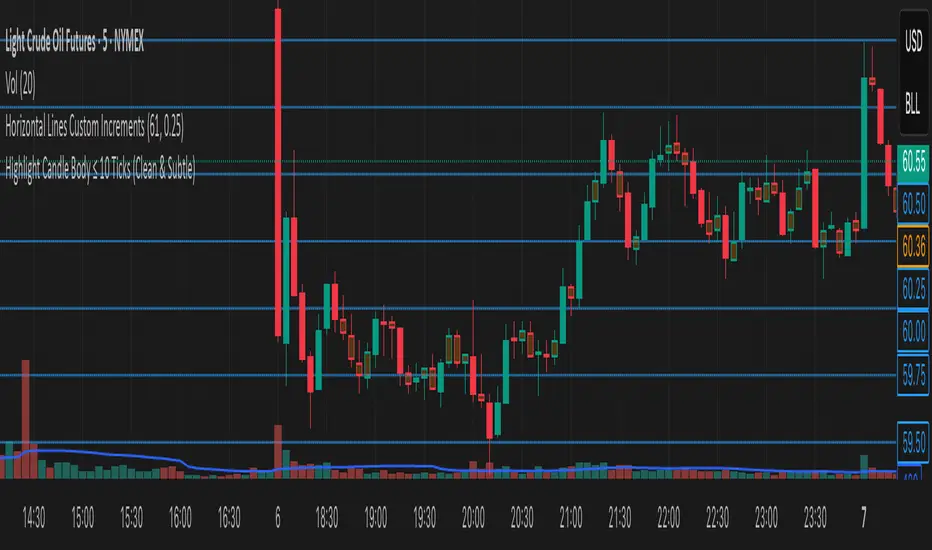
Highlight Candle Body ≤ 10 Ticks (Clean & Subtle)Purpose:
This indicator highlights candlesticks where the body size (difference between open and close) is 10 ticks or less, specifically for instruments like Crude Oil futures (CL) where 1 tick = 0.01.
How it works:
It calculates the body size: abs(close - open)
If the body is ≤ 0.10 (10 ticks), the candle is softly colored in muted orange.
Wicks are ignored — only the body is considered.
No additional shapes or markers — clean and minimal.
Use case:
Helps identify periods of indecision or low momentum — such as potential pause candles, traps, or setups just before volatility returns.
China 10-Year Yield Inverted with Time Lead (Months)The "China 10-Year Yield Inverted with Time Lead (Months)" indicator is a Pine Script tool for TradingView that displays the inverted China 10-Year Government Bond Yield (sourced from TVC:CN10Y) with a user-defined time lead or lag in months. The yield is inverted by multiplying it by -1, making a rising yield appear as a downward movement and vice versa, which helps visualize inverse correlations with other assets. Users can input the number of months to shift the yield forward (lead) or backward (lag), with the shift calculated based on the chart’s timeframe (e.g., 20 bars per month on daily charts). The indicator plots the shifted, inverted yield as a blue line in a separate pane, with a zero line for reference, enabling traders to analyze leading or lagging relationships with other financial data, such as the PBOC Balance Sheet or Bitcoin price.
